Benton, IL (Illinois) Houses and Residents
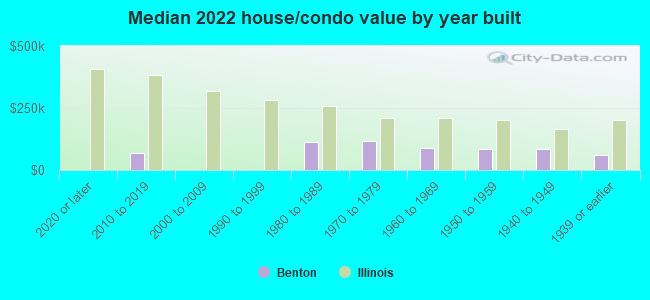
| Benton: | $85,445 |
| Illinois: | $251,600 |
Total population: 7,016 (Urban population: 6,533 (all inside urban clusters), Rural population: 307 (all nonfarm))
Houses: 3,449 (2,936 occupied: 1,926 owner occupied, 1,048 renter occupied)
| % of renters here: | 35% |
| State: | 33% |
Housing density: 645 houses/condos per square mile
Median price asked for vacant for-sale houses and condos in 2022: $63,653.
Median contract rent in 2022: $549 (lower quartile is $406, upper quartile is $699)
Median rent asked for vacant for-rent units in 2022: $547
Median gross rent in Benton, IL in 2022: $705
Housing units in Benton with a mortgage: 854 (66 second mortgage, 0 home equity loan, 20 both second mortgage and home equity loan)
Houses without a mortgage: 45
Median household income for houses/condos with a mortgage: $58,588
Median household income for apartments without a mortgage: $57,176
Median monthly housing costs: $662
Compare current foreclosures near Benton, IL:
| Photo | Address | Area | Beds / Baths | Price | Details |
|---|---|---|---|---|---|

|
#1
N Buchanan St
Benton, IL 62812
|
2,304 sq. feet
|
2 baths 3 beds |
show details | |

|
#2
Joplin St
Benton, IL 62812
|
1 sq. feet
|
1 baths 3 beds |
show details | |

|
#3
Fairland St
Benton, IL 62812
|
- sq. feet
|
- baths - beds |
show details | |

|
#4
E Bond St
Benton, IL 62812
|
- sq. feet
|
- baths - beds |
show details | |

|
#5
Long Prairie Rd
Benton, IL 62812
|
- sq. feet
|
- baths - beds |
show details | |

|
#6
Michael St
Benton, IL 62812
|
- sq. feet
|
- baths - beds |
show details | |

|
#7
Hunters Cir
Benton, IL 62812
|
- sq. feet
|
- baths - beds |
show details | |

|
#8
S Gardner St
West Frankfort, IL 62896
|
1,196 sq. feet
|
1 baths 3 beds |
$105,000
|
show details |

|
#9
S Midway St
Herrin, IL 62948
|
1,772 sq. feet
|
2 baths 3 beds |
$174,900
|
show details |

|
#10
N Buchanan St
Benton, IL 62812
|
- sq. feet
|
- baths - beds |
show details |
| Photo | Address | Area | Beds / Baths | Price | Details |
|---|---|---|---|---|---|

|
#11
W 6th St
Benton, IL 62812
|
- sq. feet
|
- baths - beds |
show details | |

|
#12
Bailey Ln
Benton, IL 62812
|
- sq. feet
|
- baths - beds |
show details | |

|
#13
S Wilson St
Benton, IL 62812
|
- sq. feet
|
- baths - beds |
show details | |

|
#14
2nd St
Benton, IL 62812
|
- sq. feet
|
- baths - beds |
show details | |

|
#15
Election Dr
Benton, IL 62812
|
- sq. feet
|
- baths - beds |
show details | |

|
#16
Grammer Hill Rd
Benton, IL 62812
|
- sq. feet
|
- baths - beds |
show details | |

|
#17
E Webster St
Benton, IL 62812
|
- sq. feet
|
- baths - beds |
show details | |

|
#18
Bowling Alley Rd
Benton, IL 62812
|
- sq. feet
|
- baths - beds |
show details | |

|
#19
N Stuyvesant St
Benton, IL 62812
|
- sq. feet
|
- baths - beds |
show details | |

|
#20
N Commercial St
Benton, IL 62812
|
- sq. feet
|
- baths - beds |
show details |
| Photo | Address | Area | Beds / Baths | Price | Details |
|---|---|---|---|---|---|

|
#21
E Bond St
Benton, IL 62812
|
- sq. feet
|
- baths - beds |
show details | |

|
#22
N 8th St
Benton, IL 62812
|
- sq. feet
|
- baths - beds |
show details | |

|
#23
W Tyler St
Herrin, IL 62948
|
1,120 sq. feet
|
1 baths 2 beds |
show details | |

|
#24
Court H
Herrin, IL 62948
|
1,024 sq. feet
|
1 baths 3 beds |
show details | |

|
#25
S T. Road
Mulkeytown, IL 62865
|
1,823 sq. feet
|
1 baths 3 beds |
show details | |

|
#26
County Rd 100 N
Thompsonville, IL 62890
|
- sq. feet
|
- baths - beds |
$49,900
|
show details |

|
#27
E Saint Louis St
West Frankfort, IL 62896
|
1,705 sq. feet
|
2 baths 4 beds |
show details | |

|
#28
Napolean Rd
Marion, IL 62959
|
920 sq. feet
|
2 baths 3 beds |
show details | |

|
#29
N Emma St
Christopher, IL 62822
|
- sq. feet
|
- baths - beds |
$19,900
|
show details |

|
#30
E 7th St
West Frankfort, IL 62896
|
- sq. feet
|
2 baths 3 beds |
show details |
| Photo | Address | Area | Beds / Baths | Price | Details |
|---|---|---|---|---|---|

|
#31
N Horn St
West Frankfort, IL 62896
|
- sq. feet
|
- baths - beds |
$19,900
|
show details |

|
#32
N Adams St
West Frankfort, IL 62896
|
- sq. feet
|
- baths - beds |
$3,400
|
show details |

|
#33
E Florence St
Sesser, IL 62884
|
- sq. feet
|
2 baths 3 beds |
show details | |

|
#34
W Ray Ave
Christopher, IL 62822
|
- sq. feet
|
1 baths 2 beds |
show details | |

|
#35
Stotlar Rd
Marion, IL 62959
|
- sq. feet
|
- baths - beds |
show details | |

|
#36
Walker Rd
Johnston City, IL 62951
|
- sq. feet
|
- baths - beds |
show details | |

|
#37
Corinth Rd
Pittsburg, IL 62974
|
- sq. feet
|
- baths - beds |
show details | |

|
#38
E Bonnie Rd
Belle Rive, IL 62810
|
- sq. feet
|
- baths - beds |
show details | |

|
#39
W 5th St
Johnston City, IL 62951
|
- sq. feet
|
- baths - beds |
show details | |

|
#40
N Goshen Ln
Belle Rive, IL 62810
|
- sq. feet
|
- baths - beds |
show details |
| Photo | Address | Area | Beds / Baths | Price | Details |
|---|---|---|---|---|---|

|
#41
E Bonnie Rd
Bonnie, IL 62816
|
- sq. feet
|
- baths - beds |
show details | |

|
#42
N Spring Garden Ln
Bonnie, IL 62816
|
- sq. feet
|
- baths - beds |
show details | |

|
#43
Stotlar Rd
Johnston City, IL 62951
|
- sq. feet
|
- baths - beds |
show details | |

|
#44
Circus St
Herrin, IL 62948
|
- sq. feet
|
- baths - beds |
show details | |

|
#45
S Sims St
Royalton, IL 62983
|
- sq. feet
|
- baths - beds |
show details | |

|
#46
Pittsburg Rd
Marion, IL 62959
|
- sq. feet
|
- baths - beds |
show details | |

|
#47
S Fairdale St
Royalton, IL 62983
|
- sq. feet
|
- baths - beds |
show details | |

|
#48
N Main St
Royalton, IL 62983
|
- sq. feet
|
- baths - beds |
show details | |

|
#49
N Main St
Royalton, IL 62983
|
- sq. feet
|
- baths - beds |
show details | |

|
Check over 1 million property listings on Foreclosure.com!
|
browse all offers | |||

Latest news about housing in Benton, IL collected exclusively by city-data.com from local newspapers, TV, and radio stations

 | Anyone from Benton IL here? (3 replies) |
| Great schools and affordable housing near Argonne (13 replies) |
| River Street Plaza Condos Downtown Aurora??? (16 replies) |
| Anyone seriously thinking about leaving Illinois (94 replies) |
| Glen Ellyn vs La Grange - need Lookout Kid, Chet and JJSki's advice (197 replies) |
| Best Bet In Southwest Suburbs? Lenox, Manhattan, Mokena, Tinley Park... (37 replies) |
Median year apartment built: 1973
Household type by relationship:
Households: 6,902- Male householders: 1,160 (352 living alone), Female householders: 1,721 (670 living alone)
1,221 spouses (1,206 opposite-sex spouses), 182 unmarried partners, (182 opposite-sex unmarried partners), 1,790 children (1,611 natural, 0 adopted, 178 stepchildren), 114 grandchildren, 27 brothers or sisters, 70 parents, 7 foster children, 199 other relatives, 116 non-relatives
- In group quarters: 289
Size of family households: 775 2-persons, 462 3-persons, 260 4-persons, 38 5-persons, 200 6-persons, 11 7-or-more-persons.
Size of nonfamily households: 1,077 1-person, 113 2-persons, 38 3-persons.
858 married couples with children.
394 single-parent households (83 men, 311 women).
98.5% of residents of Benton speak English at home.
1.0% of residents speak Spanish at home (58% speak English very well, 42% speak English well).
0.2% of residents speak other Indo-European language at home (100% speak English very well).
Foreign born population: 41 (0.6%)
(100.0% of them are naturalized citizens)
| Here: | 6.1 |
| State: | 6.4 |
| Here: | 4.9 |
| State: | 4.1 |
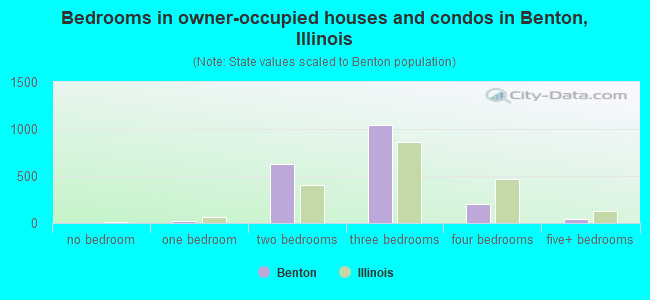
- Bedrooms in owner-occupied houses and condos in Benton, Illinois
- 0no bedroom
- 201 bedroom
- 6252 bedrooms
- 1,0403 bedrooms
- 2034 bedrooms
- 395+ bedrooms
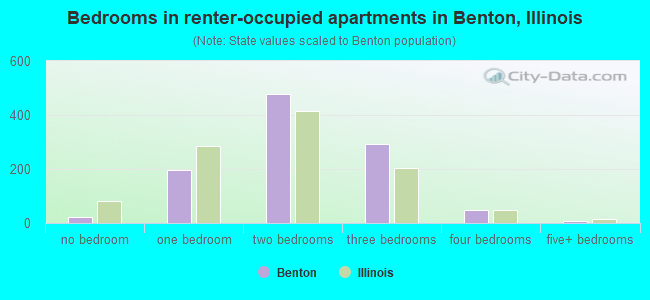
- Bedrooms in renter-occupied apartments in Benton, Illinois
- 23no bedroom
- 1961 bedroom
- 4792 bedrooms
- 2923 bedrooms
- 504 bedrooms
- 75+ bedrooms
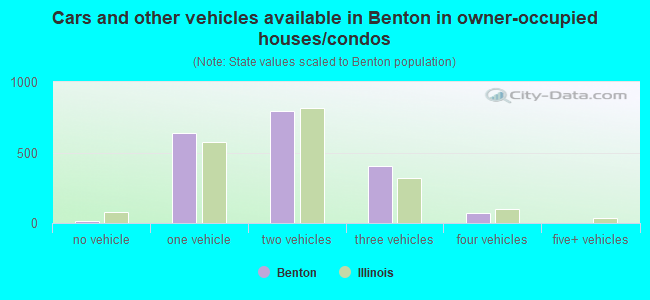
- Cars and other vehicles available in Benton in owner-occupied houses/condos
- 17no vehicle
- 6381 vehicle
- 7952 vehicles
- 4023 vehicles
- 744 vehicles
- 05+ vehicles
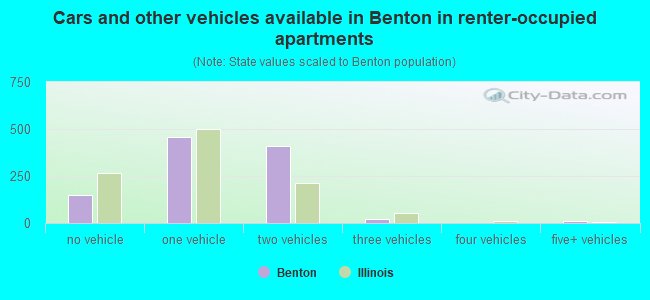
- Cars and other vehicles available in Benton in renter-occupied apartments
- 149no vehicle
- 4591 vehicle
- 4092 vehicles
- 203 vehicles
- 04 vehicles
- 115+ vehicles
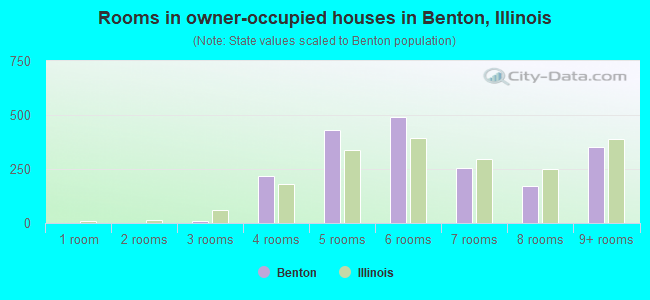
- Rooms in owner-occupied houses in Benton, Illinois
- 01 room
- 02 rooms
- 93 rooms
- 2184 rooms
- 4295 rooms
- 4936 rooms
- 2557 rooms
- 1698 rooms
- 3539+ rooms
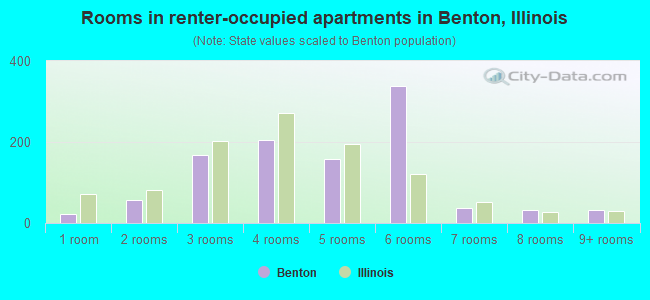
- Rooms in renter-occupied apartments in Benton, Illinois
- 231 room
- 582 rooms
- 1683 rooms
- 2044 rooms
- 1585 rooms
- 3396 rooms
- 387 rooms
- 318 rooms
- 319+ rooms
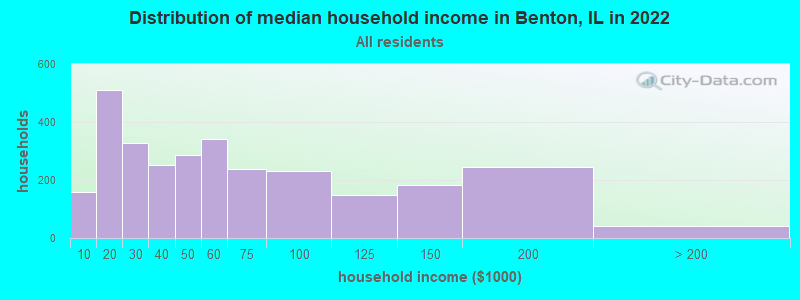
Benton, IL household income distribution

- 158Less than $10,000
- 509$10,000 to $19,999
- 329$20,000 to $29,999
- 252$30,000 to $39,999
- 287$40,000 to $49,999
- 342$50,000 to $59,999
- 238$60,000 to $74,999
- 230$75,000 to $99,999
- 150$100,000 to $124,999
- 183$125,000 to $149,999
- 246$150,000 to $199,999
- 43$200,000 or more
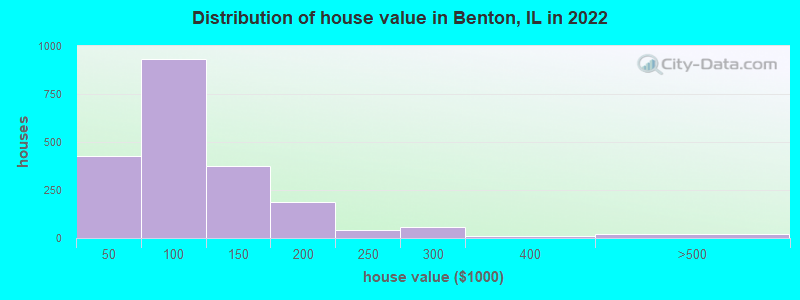
Home value of owner - occupied houses in 2022 in Benton, IL
-
- 34Less than $10,000
- 59$10,000 to $14,999
- 30$20,000 to $24,999
- 18$25,000 to $29,999
- 62$30,000 to $34,999
- 30$35,000 to $39,999
- 190$40,000 to $49,999
- 164$50,000 to $59,999
- 250$60,000 to $69,999
- 103$70,000 to $79,999
- 124$80,000 to $89,999
- 96$90,000 to $99,999
- 296$100,000 to $124,999
- 79$125,000 to $149,999
- 121$150,000 to $174,999
- 64$175,000 to $199,999
- 43$200,000 to $249,999
- 58$250,000 to $299,999
- 7$300,000 to $399,999
- 22$400,000 to $499,999
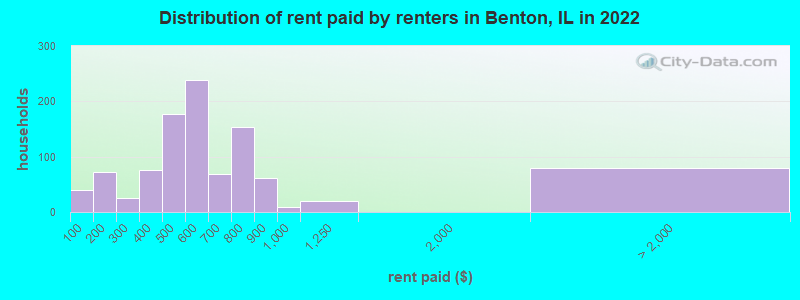
Rent paid by renters in 2022 in Benton, IL
-
- 38Less than $100
- 71$150 to $199
- 19$200 to $249
- 6$250 to $299
- 76$300 to $349
- 137$400 to $449
- 39$450 to $499
- 102$500 to $549
- 137$550 to $599
- 8$600 to $649
- 59$650 to $699
- 92$700 to $749
- 60$750 to $799
- 60$800 to $899
- 8$900 to $999
- 20$1,000 to $1,249
- 80No cash rent
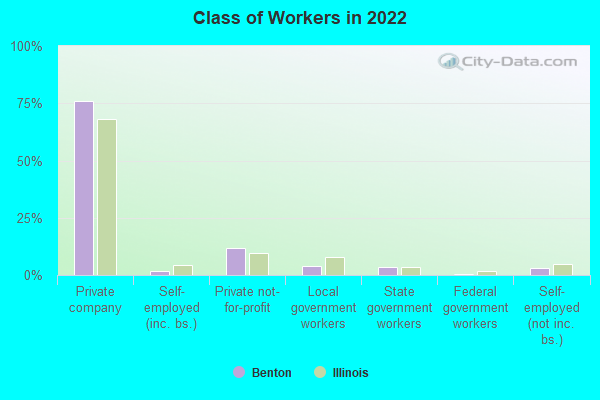
Percentage of workers working in this county: 58.3%
Number of people working at home: 224 (8.0% of all workers)
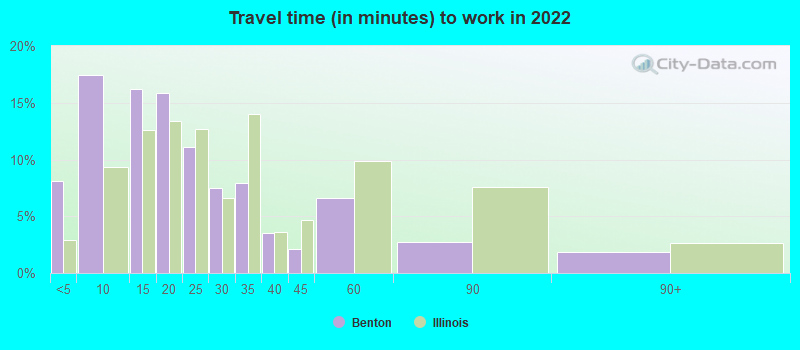
Travel time to work (commute)
- Less than 5 minutes: 168
- 5 to 9 minutes: 464
- 10 to 14 minutes: 270
- 15 to 19 minutes: 274
- 20 to 24 minutes: 150
- 25 to 29 minutes: 113
- 30 to 34 minutes: 475
- 35 to 39 minutes: 176
- 40 to 44 minutes: 42
- 45 to 59 minutes: 164
- 60 to 89 minutes: 157
- 90 or more minutes: 53
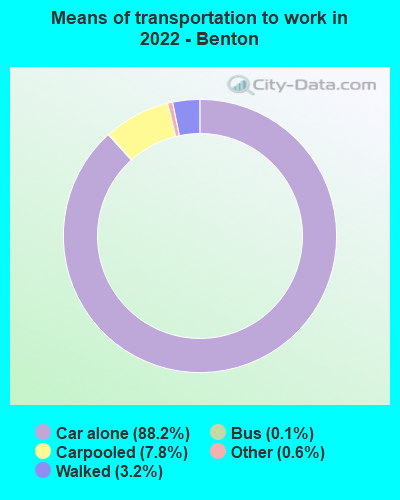
Means of transportation to work:
- Drove a car alone: 1,973 (79.1%)
- Carpooled: 185 (7.4%)
- Bus: 2 (0.1%)
- Taxi: 14 (0.6%)
- Walked: 73 (2.9%)
- Worked at home: 224 (9.0%)
- Unemployment by race in 2022
- Unemployment rate for White non-Hispanic residents
- 5.9%Males
- 2.2%Females
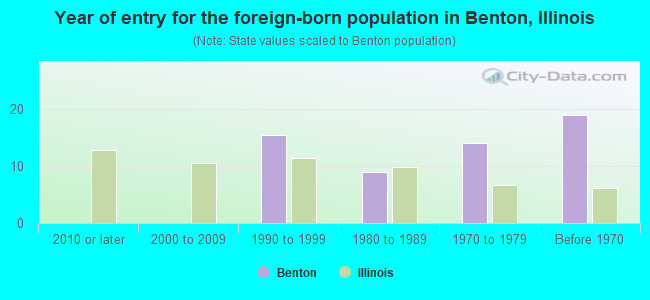
- Year of entry for the foreign-born population in Benton, Illinois
- 02010 or later
- 02000 to 2009
- 151990 to 1999
- 91980 to 1989
- 141970 to 1979
- 19Before 1970
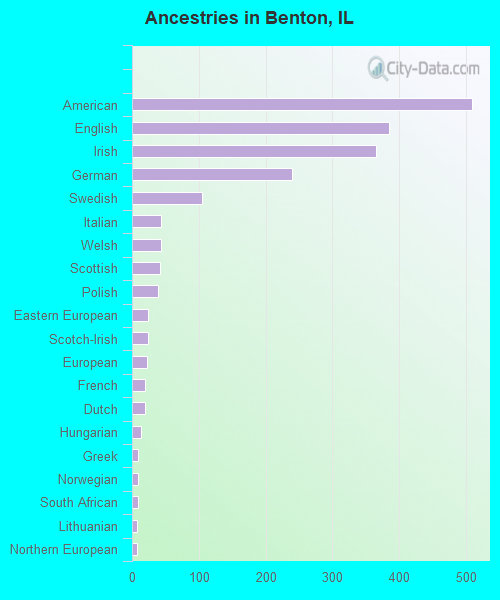
First ancestries reported:
- American: 509 (20.8%)
- English: 384 (15.7%)
- Irish: 365 (14.9%)
- German: 239 (9.8%)
- Swedish: 105 (4.3%)
- Italian: 44 (1.8%)
- Welsh: 44 (1.8%)
- Scottish: 42 (1.7%)
- Polish: 39 (1.6%)
- Eastern European: 24 (1.0%)
- Scotch-Irish: 24 (1.0%)
- European: 22 (0.9%)
- French: 20 (0.8%)
- Dutch: 19 (0.8%)
- Hungarian: 13 (0.5%)
- Greek: 9 (0.4%)
- Norwegian: 9 (0.4%)
- South African: 9 (0.4%)
- Lithuanian: 7 (0.3%)
- Northern European: 7 (0.3%)
- British: 4 (0.2%)
- Scandinavian: 2 (0.08%)
- African: 2 (0.08%)
Most common places of birth for foreign-born residents (%):
| Benton: | 41.5% (17) |
| Illinois: | 0.2% (2,988) |
| Benton: | 36.6% (15) |
| Illinois: | 34.7% (626,958) |
| Benton: | 19.5% (8) |
| Illinois: | 1.1% (19,306) |
| Benton: | 7.3% (3) |
| Illinois: | 1.0% (18,753) |
Place of birth for U.S.-born residents:
- This state: 5,696
- Other state: 1,130
- Northeast: 68
- Midwest: 432
- South: 353
- West: 275
75.1% of Benton residents lived in the same house 1 years ago.
Out of people who lived in different houses, 37.9% lived in this county.
Out of people who lived in different counties, 91.8% lived in Illinois.
| Benton: | 75.1% |
| State average: | 88.3% |
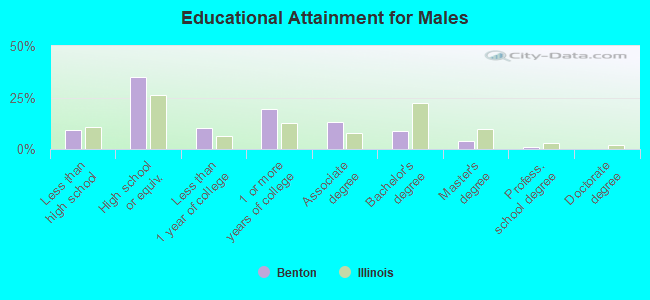
Education attainment for males 25 years and older:
- No schooling: 0
- Nursery to 4th grade: 16
- 5th and 6th grade: 0
- 7th and 8th grade: 0
- 9th grade: 16
- 10th grade: 53
- 11th grade: 63
- 12th grade, no diploma: 61
- High school graduate (or equivalency): 776
- Less than 1 year of college: 227
- Some college more than 1 year, no degree: 431
- Associate degree: 286
- Bachelor's degree: 191
- Master's degree: 85
- Professional school degree: 17
- Doctorate degree: 0
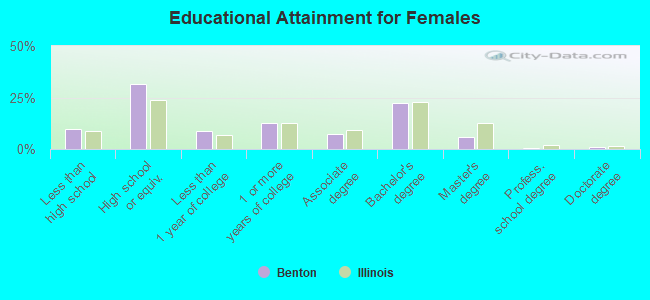
Education attainment for females 25 years and older:
- No schooling: 31
- Nursery to 4th grade: 8
- 5th and 6th grade: 0
- 7th and 8th grade: 0
- 9th grade: 44
- 10th grade: 38
- 11th grade: 106
- 12th grade, no diploma: 27
- High school graduate (or equivalency): 820
- Less than 1 year of college: 230
- Some college more than 1 year, no degree: 322
- Associate degree: 194
- Bachelor's degree: 584
- Master's degree: 149
- Professional school degree: 18
- Doctorate degree: 21
Housing units in structures:
- One, detached: 2,639
- One, attached: 89
- Two: 330
- 3 or 4: 94
- 5 to 9: 45
- 10 to 19: 41
- 20 to 49: 11
- 50 or more: 85
- Mobile homes: 113
Housing units lacking complete kitchen facilities in 2022: 8.0%
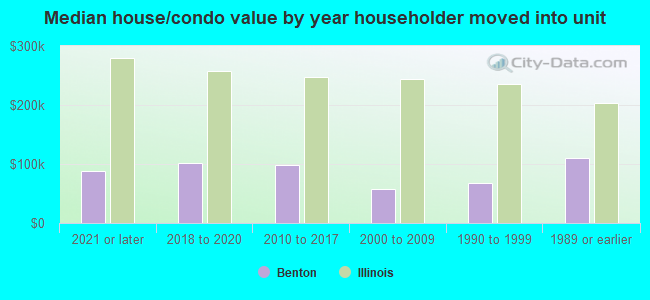
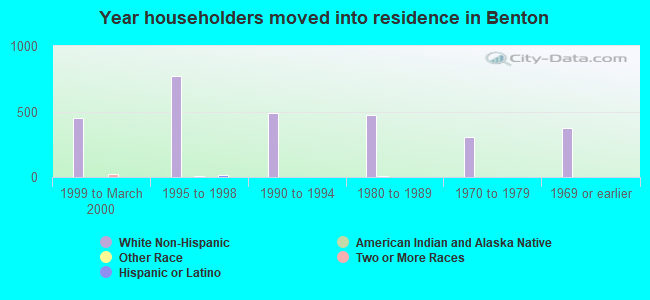
House/condo owner moved in on average 15 years ago
Renter moved in on average 2 years ago
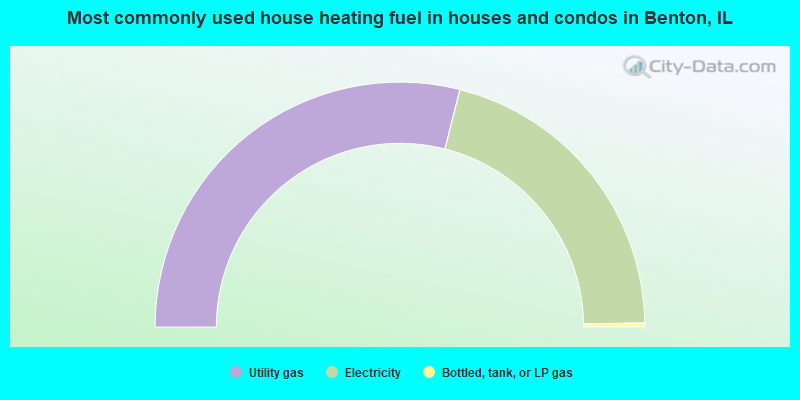
- 57.9%Utility gas
- 41.6%Electricity
- 0.5%Bottled, tank, or LP gas
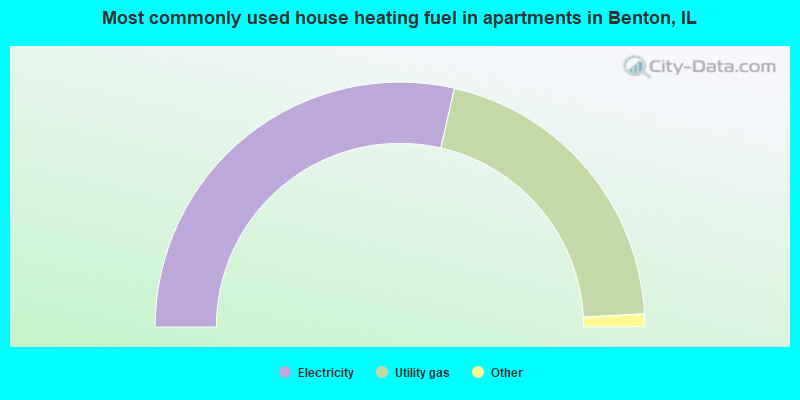
- 57.2%Electricity
- 41.2%Utility gas
- 1.1%Other fuel
- 0.6%No fuel used
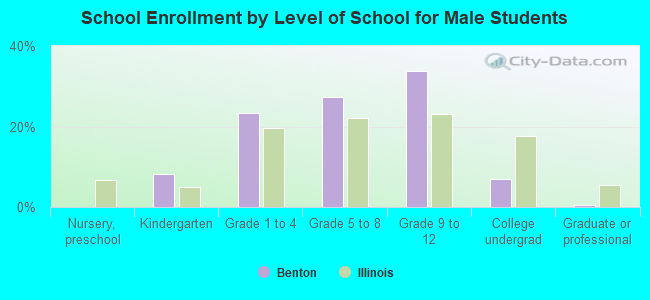
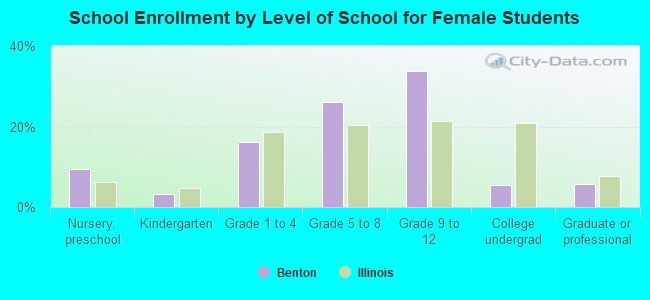
Private vs. public school enrollment:
| Here: | 2.9% |
| Illinois: | 13.3% |
| Here: | 4.6% |
| Illinois: | 9.9% |
| Here: | 11.8% |
| Illinois: | 27.4% |