Bethlehem, PA (Pennsylvania) Houses and Residents
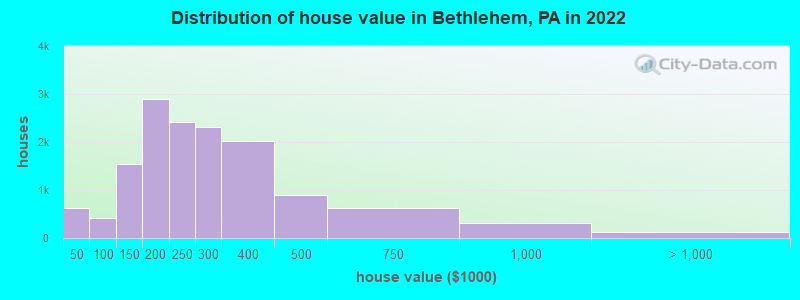
Estimated median house or condo value in 2022: $256,800 (it was $97,100 in 2000 )
Bethlehem:
$256,800Pennsylvania:
$245,500
Lower value quartile - upper value quartile: $190,500 - $338,800Mean price in 2022: Detached houses: $314,814 Here:
$314,814State:
$317,202
Townhouses or other attached units: $225,237 Here:
$225,237State:
$254,369
In 2-unit structures: $184,112 Here:
$184,112State:
$249,182
In 3-to-4-unit structures: $286,142 Here:
$286,142State:
$297,446
In 5-or-more-unit structures: $226,318 Here:
$226,318State:
$320,068
Mobile homes: $53,680 Here:
$53,680State:
$92,414
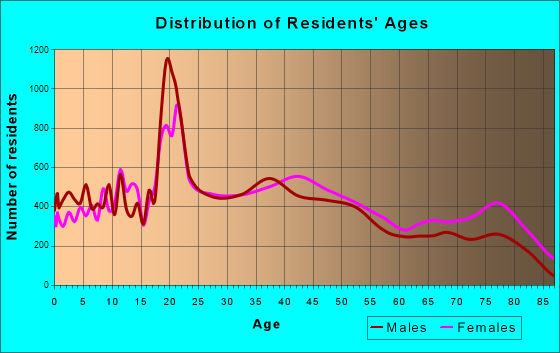
Total population: 75,135 (Urban population: 71,140, Rural population: 189 (all nonfarm) )
Houses: 32,404 (31,251 occupied: 15,782 owner occupied, 15,469 renter occupied )
% of renters here:
49%State:
31%
Housing density: 1,683 houses/condos per square mile
Median price asked for vacant for-sale houses and condos in 2022: $483,022.
Median contract rent in 2022: $1,043 (lower quartile is $731, upper quartile is $1,423)
Median rent asked for vacant for-rent units in 2022: $1,939
Median gross rent in Bethlehem, PA in 2022: $1,215
Housing units in Bethlehem with a mortgage: 9,609 (853 second mortgage, 0 home equity loan, 853 both second mortgage and home equity loan )Houses without a mortgage: 424
Median household income for houses/condos with a mortgage: $97,813
Median household income for apartments without a mortgage: $55,941
Median monthly housing costs: $1,218
Data:
Median house or condo value ($)
Median house or condo value ($ change since 2000)
Median house or condo value ($) - White
Median house or condo value ($) - Black or African American
Median house or condo value ($) - Asian
Median house or condo value ($) - Hispanic or Latino
Median house or condo value ($) - American Indian and Alaska Native
Median house or condo value ($) - Multirace
Median house or condo value ($) - Other Race
Median price asked for mobile homes ($)
Household density (households per square mile)
Mean house or condo value by units in structure - 1, detached ($)
Mean house or condo value by units in structure - 1, attached ($)
Mean house or condo value by units in structure - 2 ($)
Mean house or condo value by units in structure by units in structure - 3 or 4 ($)
Mean house or condo value by units in structure - 5 or more ($)
Mean house or condo value by units in structure - Boat, RV, van, etc. ($)
Mean house or condo value by units in structure - Mobile home ($)
Median contract rent ($)
Median contract rent - Lower quartile ($)
Median contract rent - Upper quartile ($)
Median gross rent ($)
Urban houses (%)
Rural houses (%)
Houses occupied (%)
Houses occupied (% change since 2000)
Houses owner occupied (%)
Houses owner occupied (% change since 2000)
Houses renter occupied (%)
Houses renter occupied (% change since 2000)
Vacant housing units - For rent (%)
Vacant housing units - For rent (% change since 2000)
Vacant housing units - For sale only (%)
Vacant housing units - For sale only (% change since 2000)
Vacant housing units - Rented or sold, not occupied (%)
Vacant housing units - Rented or sold, not occupied (% change since 2000)
Vacant housing units - For seasonal, recreational, or occasional use (%)
Vacant housing units - For seasonal, recreational, or occasional use (% change since 2000)
Vacant housing units - For migrant workers (%)
Vacant housing units - For migrant workers (% change since 2000)
Vacant housing units - Other vacant (%)
Vacant housing units - Other vacant (% change since 2000)
Median monthly housing costs ($)
Median household income for houses/condos with a mortgage ($)
Median household income for houses/condos without a mortgage ($)
Median household income ($)
Median household income ($) - White
Median household income ($) - Black or African American
Median household income ($) - Asian
Median household income ($) - Hispanic or Latino
Median household income ($) - American Indian and Alaska Native
Median household income ($) - Multirace
Median household income ($) - Other Race
Mortgage status - with mortgage (%)
Mortgage status - with second mortgage (%)
Mortgage status - with home equity loan (%)
Mortgage status - with both second mortgage and home equity loan (%)
Mortgage status - without a mortgage (%)
Median year house/condo built
Median year apartment built
Household type by relationship - Male householder living alone (%)
Household type by relationship - Male householder not living alone (%)
Household type by relationship - Female householder living alone (%)
Household type by relationship - Female householder not living alone (%)
Household type by relationship - Opposite-Sex spouse (%)
Household type by relationship - Same-Sex spouse (%)
Household type by relationship - Opposite-Sex unmarried partner (%)
Household type by relationship - Same-Sex unmarried partner (%)
Household type by relationship - In group quarters (%)
Size of family households - 2-person household (%)
Size of family households - 3-person household (%)
Size of family households - 4-person household (%)
Size of family households - 5-person household (%)
Size of family households - 6-person household (%)
Size of family households - 7-or-more-person household (%)
Size of nonfamily households - 1-person household (%)
Size of nonfamily households - 2-person household (%)
Size of nonfamily households - 3-person household (%)
Size of nonfamily households - 4-person household (%)
Size of nonfamily households - 5-person household (%)
Size of nonfamily households - 6-person household (%)
Size of nonfamily households - 7-or-moreperson household (%)
Year house built - Built 2010 or later (%)
Year house built - Built 2000 to 2009 (%)
Year house built - Built 1990 to 1999 (%)
Year house built - Built 1980 to 1989 (%)
Year house built - Built 1970 to 1979 (%)
Year house built - Built 1960 to 1969 (%)
Year house built - Built 1950 to 1959 (%)
Year house built - Built 1940 to 1949 (%)
Year house built - Built 1939 or earlier (%)
Median number of rooms in houses and condos
Median number of rooms in apartments
Median number of bedrooms in owner occupied houses
Mean number of bedrooms in owner occupied houses
Median number of bedrooms in renter occupied houses
Mean number of bedrooms in renter occupied houses
Median number of vehichles in owner occupied houses
Mean number of vehichles in owner occupied houses
Median number of vehichles in renter occupied houses
Mean number of vehichles in renter occupied houses
Rooms in owner-occupied houses - 1 room (%)
Rooms in owner-occupied houses - 2 rooms (%)
Rooms in owner-occupied houses - 3 rooms (%)
Rooms in owner-occupied houses - 4 rooms (%)
Rooms in owner-occupied houses - 5 rooms (%)
Rooms in owner-occupied houses - 6 rooms (%)
Rooms in owner-occupied houses - 7 rooms (%)
Rooms in owner-occupied houses - 8 rooms (%)
Rooms in owner-occupied houses - 9+ rooms (%)
Rooms in renter-occupied houses - 1 room (%)
Rooms in renter-occupied houses - 2 rooms (%)
Rooms in renter-occupied houses - 3 rooms (%)
Rooms in renter-occupied houses - 4 rooms (%)
Rooms in renter-occupied houses - 5 rooms (%)
Rooms in renter-occupied houses - 6 rooms (%)
Rooms in renter-occupied houses - 7 rooms (%)
Rooms in renter-occupied houses - 8 rooms (%)
Rooms in renter-occupied houses - 9+ rooms (%)
Bedrooms in owner-occupied houses - no bedrooms (%)
Bedrooms in owner-occupied houses - 1 bedroom (%)
Bedrooms in owner-occupied houses - 2 bedrooms (%)
Bedrooms in owner-occupied houses - 3 bedrooms (%)
Bedrooms in owner-occupied houses - 4 bedrooms (%)
Bedrooms in owner-occupied houses - 5+ bedrooms (%)
Bedrooms in renter-occupied houses - no bedrooms (%)
Bedrooms in renter-occupied houses - 1 bedroom (%)
Bedrooms in renter-occupied houses - 2 bedrooms (%)
Bedrooms in renter-occupied houses - 3 bedrooms (%)
Bedrooms in renter-occupied houses - 4 bedrooms (%)
Bedrooms in renter-occupied houses - 5+ bedrooms (%)
Vehicles available in owner-occupied houses - no vehicle available (%)
Vehicles available in owner-occupied houses - 1 vehicle available(%)
Vehicles available in owner-occupied houses - 2 Vehicles available (%)
Vehicles available in owner-occupied houses - 3 Vehicles available (%)
Vehicles available in owner-occupied houses - 4 Vehicles available (%)
Vehicles available in owner-occupied houses - 5+ Vehicles available (%)
Vehicles available in renter-occupied houses - no vehicle available (%)
Vehicles available in renter-occupied houses - 1 vehicle available (%)
Vehicles available in renter-occupied houses - 2 Vehicles available (%)
Vehicles available in renter-occupied houses - 3 Vehicles available (%)
Vehicles available in renter-occupied houses - 4 Vehicles available (%)
Vehicles available in renter-occupied houses - 5+ Vehicles available (%)
Housing units in structures - 1, detached (%)
Housing units in structures - 1, attached (%)
Housing units in structures - 2 (%)
Housing units in structures - 3 or 4 (%)
Housing units in structures - 5 to 9 (%)
Housing units in structures - 10 to 19 (%)
Housing units in structures - 20 to 49 (%)
Housing units in structures - 50 or more (%)
Housing units in structures - Mobile home (%)
Housing units in structures - Boat, RV, van, etc. (%)
Housing units in structures - Owners - 1, detached (%)
Housing units in structures - Owners - 1, attached (%)
Housing units in structures - Owners - 2 (%)
Housing units in structures - Owners - 3 or 4 (%)
Housing units in structures - Owners - 5 to 9 (%)
Housing units in structures - Owners - 10 to 19 (%)
Housing units in structures - Owners - 20 to 49 (%)
Housing units in structures - Owners - 50 or more (%)
Housing units in structures - Owners - Mobile home (%)
Housing units in structures - Owners - Boat, RV, van, etc. (%)
Housing units in structures - Renters - 1, detached (%)
Housing units in structures - Renters - 1, attached (%)
Housing units in structures - Renters - 2 (%)
Housing units in structures - Renters - 3 or 4 (%)
Housing units in structures - Renters - 5 to 9 (%)
Housing units in structures - Renters - 10 to 19 (%)
Housing units in structures - Renters - 20 to 49 (%)
Housing units in structures - Renters - 50 or more (%)
Housing units in structures - Renters - Mobile home (%)
Housing units in structures - Renters - Boat, RV, van, etc. (%)
House/condo owner moved in on average (years ago)
Renter moved in on average (years ago)
Year householder moved into unit - Moved in 1999 to March 2000 (%)
Year householder moved into unit - Moved in 1999 to March 2000 (%) - White
Year householder moved into unit - Moved in 1999 to March 2000 (%) - Black or African American
Year householder moved into unit - Moved in 1999 to March 2000 (%) - Asian
Year householder moved into unit - Moved in 1999 to March 2000 (%) - Hispanic or Latino
Year householder moved into unit - Moved in 1999 to March 2000 (%) - American Indian and Alaska Native
Year householder moved into unit - Moved in 1999 to March 2000 (%) - Multirace
Year householder moved into unit - Moved in 1999 to March 2000 (%) - Other Race
Year householder moved into unit - Moved in 1995 to 1998 (%)
Year householder moved into unit - Moved in 1995 to 1998 (%) - White
Year householder moved into unit - Moved in 1995 to 1998 (%) - Black or African American
Year householder moved into unit - Moved in 1995 to 1998 (%) - Asian
Year householder moved into unit - Moved in 1995 to 1998 (%) - Hispanic or Latino
Year householder moved into unit - Moved in 1995 to 1998 (%) - American Indian and Alaska Native
Year householder moved into unit - Moved in 1995 to 1998 (%) - Multirace
Year householder moved into unit - Moved in 1995 to 1998 (%) - Other Race
Year householder moved into unit - Moved in 1990 to 1994 (%)
Year householder moved into unit - Moved in 1990 to 1994 (%) - White
Year householder moved into unit - Moved in 1990 to 1994 (%) - Black or African American
Year householder moved into unit - Moved in 1990 to 1994 (%) - Asian
Year householder moved into unit - Moved in 1990 to 1994 (%) - Hispanic or Latino
Year householder moved into unit - Moved in 1990 to 1994 (%) - American Indian and Alaska Native
Year householder moved into unit - Moved in 1990 to 1994 (%) - Multirace
Year householder moved into unit - Moved in 1990 to 1994 (%) - Other Race
Year householder moved into unit - Moved in 1980 to 1989 (%)
Year householder moved into unit - Moved in 1980 to 1989 (%) - White
Year householder moved into unit - Moved in 1980 to 1989 (%) - Black or African American
Year householder moved into unit - Moved in 1980 to 1989 (%) - Asian
Year householder moved into unit - Moved in 1980 to 1989 (%) - Hispanic or Latino
Year householder moved into unit - Moved in 1980 to 1989 (%) - American Indian and Alaska Native
Year householder moved into unit - Moved in 1980 to 1989 (%) - Multirace
Year householder moved into unit - Moved in 1980 to 1989 (%) - Other Race
Year householder moved into unit - Moved in 1970 to 1979 (%)
Year householder moved into unit - Moved in 1970 to 1979 (%) - White
Year householder moved into unit - Moved in 1970 to 1979 (%) - Black or African American
Year householder moved into unit - Moved in 1970 to 1979 (%) - Asian
Year householder moved into unit - Moved in 1970 to 1979 (%) - Hispanic or Latino
Year householder moved into unit - Moved in 1970 to 1979 (%) - American Indian and Alaska Native
Year householder moved into unit - Moved in 1970 to 1979 (%) - Multirace
Year householder moved into unit - Moved in 1970 to 1979 (%) - Other Race
Year householder moved into unit - Moved in 1969 or earlier (%)
Year householder moved into unit - Moved in 1969 or earlier (%) - White
Year householder moved into unit - Moved in 1969 or earlier (%) - Black or African American
Year householder moved into unit - Moved in 1969 or earlier (%) - Asian
Year householder moved into unit - Moved in 1969 or earlier (%) - Hispanic or Latino
Year householder moved into unit - Moved in 1969 or earlier (%) - American Indian and Alaska Native
Year householder moved into unit - Moved in 1969 or earlier (%) - Multirace
Year householder moved into unit - Moved in 1969 or earlier (%) - Other Race
Housing units lacking complete plumbing facilities (%)
Housing units lacking complete kitchen facilities (%)
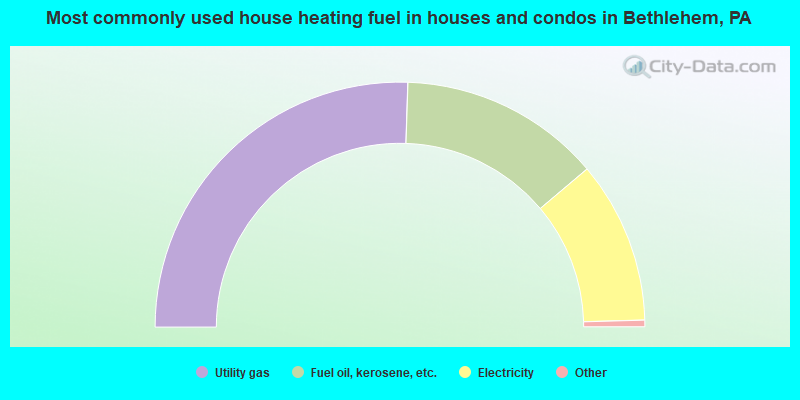
House heating fuel used in houses and condos - Utility gas (%)
House heating fuel used in houses and condos - Bottled, tank, or LP gas (%)
House heating fuel used in houses and condos - Electricity (%)
House heating fuel used in houses and condos - Fuel oil, kerosene, etc. (%)
House heating fuel used in houses and condos - Coal or coke (%)
House heating fuel used in houses and condos - Wood (%)
House heating fuel used in houses and condos - Solar energy (%)
House heating fuel used in houses and condos - Other fuel (%)
House heating fuel used in houses and condos - No fuel used (%)
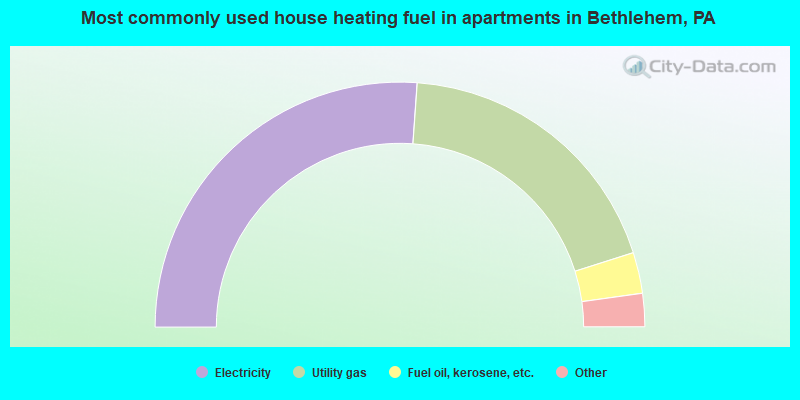
House heating fuel used in apartments - Utility gas (%)
House heating fuel used in apartments - Bottled, tank, or LP gas (%)
House heating fuel used in apartments - Electricity (%)
House heating fuel used in apartments - Fuel oil, kerosene, etc. (%)
House heating fuel used in apartments - Coal or coke (%)
House heating fuel used in apartments - Wood (%)
House heating fuel used in apartments - Solar energy (%)
House heating fuel used in apartments - Other fuel (%)
House heating fuel used in apartments - No fuel used (%)
Latest news about housing in Bethlehem, PA collected exclusively by city-data.com from local newspapers, TV, and radio stations
Median year house/condo built: 1954Median year apartment built: 1962Household type by relationship:
Households: 78,854
Male householders: 12,670 (4,538 living alone ), Female householders: 18,581 (7,121 living alone )9,855 spouses (9,737 opposite-sex spouses ), 3,214 unmarried partners , (3,102 opposite-sex unmarried partners ), 19,524 children (18,676 natural , 678 adopted , 170 stepchildren ), 1,648 grandchildren , 1,049 brothers or sisters , 1,006 parents , 0 foster children , 1,208 other relatives , 3,867 non-relatives In group quarters: 6,232
Size of family households: 7,639 2-persons , 3,514 3-persons , 2,047 4-persons , 2,122 5-persons , 696 6-persons , 272 7-or-more-persons .
Size of nonfamily households: 11,659 1-person , 2,811 2-persons , 139 3-persons , 217 4-persons , 97 5-persons , 38 7-or-more-persons .
6,303 married couples with children. single-parent households (490 men , 6,000 women ).
74.6% of residents of Bethlehem speak English at home. of residents speak Spanish at home (56% speak English very well , 20% speak English well , 18% speak English not well , 6% don't speak English at all ).of residents speak other Indo-European language at home (70% speak English very well , 16% speak English well , 10% speak English not well , 4% don't speak English at all ).of residents speak Asian or Pacific Island language at home (62% speak English very well , 27% speak English well , 11% speak English not well ).of residents speak other language at home (76% speak English very well , 24% speak English well ).
Foreign born population: 7,064 (9.0%)of them are naturalized citizens )
Median number of rooms in houses and condos:
Median number of rooms in apartments
Owner-occupied Renter-occupied
Bedrooms in owner-occupied houses and condos in Bethlehem, Pennsylvania
0 no bedroom 494 1 bedroom 2,110 2 bedrooms 8,614 3 bedrooms 3,358 4 bedrooms 1,206 5+ bedrooms
Bedrooms in renter-occupied apartments in Bethlehem, Pennsylvania
1,012 no bedroom 5,056 1 bedroom 5,455 2 bedrooms 2,952 3 bedrooms 897 4 bedrooms 97 5+ bedrooms
Owner-occupied Renter-occupied
Rooms in owner-occupied houses in Bethlehem, Pennsylvania
0 1 room 91 2 rooms 54 3 rooms 624 4 rooms 1,703 5 rooms 4,751 6 rooms 3,508 7 rooms 2,173 8 rooms 2,878 9+ rooms
Rooms in renter-occupied apartments in Bethlehem, Pennsylvania
481 1 room 1,332 2 rooms 3,798 3 rooms 3,852 4 rooms 2,705 5 rooms 1,746 6 rooms 714 7 rooms 445 8 rooms 396 9+ rooms
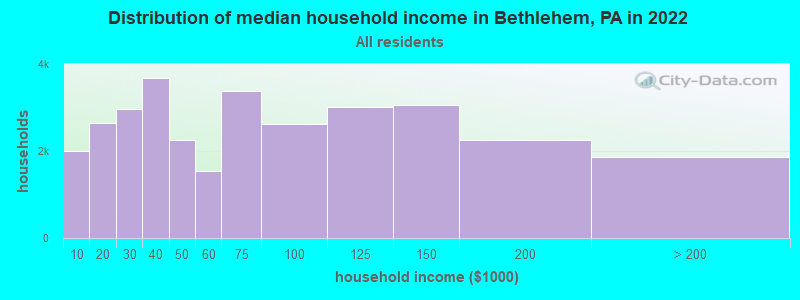
Bethlehem, PA household income distribution 1,991 Less than $10,0002,637 $10,000 to $19,9992,970 $20,000 to $29,9993,670 $30,000 to $39,9992,252 $40,000 to $49,9991,551 $50,000 to $59,9993,389 $60,000 to $74,9992,622 $75,000 to $99,9993,003 $100,000 to $124,9993,050 $125,000 to $149,9992,264 $150,000 to $199,9991,852 $200,000 or more
Home value of owner - occupied houses in 2022 in Bethlehem, PA 229 Less than $10,00014 $10,000 to $14,99942 $15,000 to $19,999169 $20,000 to $24,99910 $25,000 to $29,99937 $30,000 to $34,99979 $35,000 to $39,99935 $40,000 to $49,99946 $50,000 to $59,9997 $60,000 to $69,99927 $70,000 to $79,999137 $80,000 to $89,999163 $90,000 to $99,999637 $100,000 to $124,999913 $125,000 to $149,9991,377 $150,000 to $174,9991,514 $175,000 to $199,9992,410 $200,000 to $249,9992,309 $250,000 to $299,9992,028 $300,000 to $399,999898 $400,000 to $499,999617 $500,000 to $749,999311 $750,000 to $999,99963 $1,000,000 to $1,499,99916 $1,500,000 to $1,999,99936 $2,000,000 or moreRent paid by renters in 2022 in Bethlehem, PA 474 Less than $100163 $100 to $149346 $150 to $199122 $200 to $249592 $250 to $299127 $300 to $34940 $350 to $399157 $400 to $449934 $450 to $49985 $500 to $54919 $550 to $599155 $600 to $649275 $650 to $699558 $700 to $749634 $750 to $7991,180 $800 to $8991,249 $900 to $9993,219 $1,000 to $1,2491,682 $1,250 to $1,4992,480 $1,500 to $1,999340 $2,000 to $2,49953 $3,000 to $3,499439 $3,500 or more146 No cash rent
Percentage of workers working in this county: 63.2%Number of people working at home: 5,391 (14.8% of all workers )
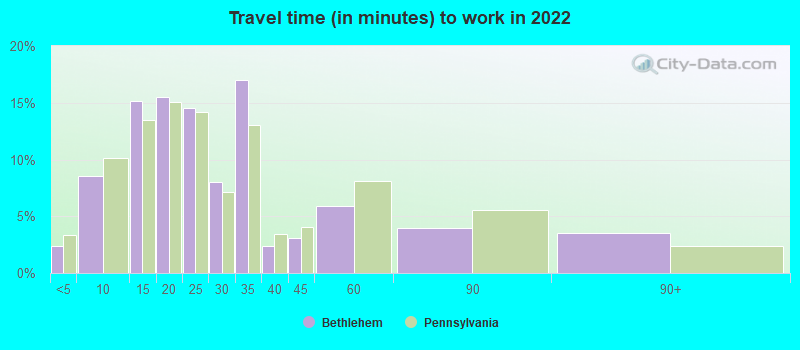
Travel time to work (commute)
Less than 5 minutes: 8715 to 9 minutes: 4,10310 to 14 minutes: 6,92415 to 19 minutes: 6,14120 to 24 minutes: 3,31225 to 29 minutes: 2,80030 to 34 minutes: 3,39035 to 39 minutes: 52240 to 44 minutes: 58645 to 59 minutes: 1,23160 to 89 minutes: 67290 or more minutes: 1,420
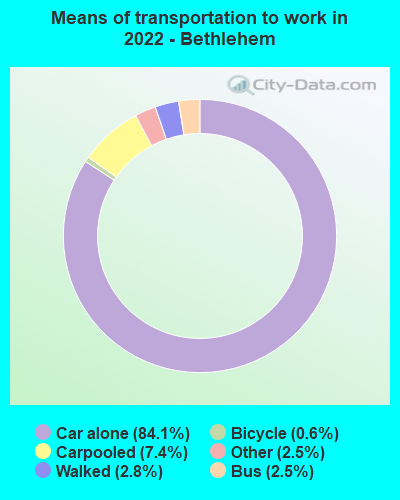
Means of transportation to work:
Drove a car alone: 37,727 (74.6%)Carpooled: 3,302 (6.5%)Bus : 1,774 (3.5%)Subway or elevated rail : 10 (0.0%)Taxi: 1,111 (2.2%)Bicycle: 338 (0.7%)Walked: 1,048 (2.1%)Worked at home: 5,391 (10.7%)
Unemployment by race in 2022
Unemployment rate for White non-Hispanic residents 6.3% Males1.7% FemalesUnemployment rate for Black residents 24.9% Males9.4% FemalesUnemployment rate for Asian residents 3.8% Males12.0% FemalesUnemployment rate for other race residents 0.8% Males5.5% FemalesUnemployment rate for two or more race residents 4.8% Males9.3% FemalesUnemployment rate for Hispanic or Latino residents 5.7% Males5.1% Females
Year of entry for the foreign-born population in Bethlehem, Pennsylvania
4,518 2010 or later 1,795 2000 to 2009 1,487 1990 to 1999 930 1980 to 1989 544 1970 to 1979 964 Before 1970
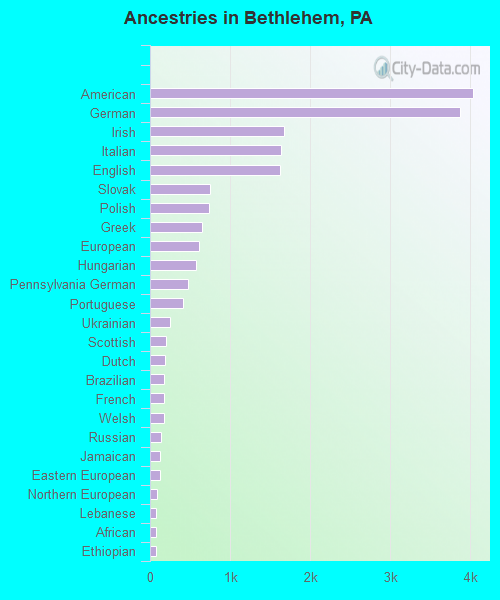
First ancestries reported:
American: 4,033 (10.4%)
German: 3,867 (9.9%)
Irish: 1,669 (4.3%)
Italian: 1,635 (4.2%)
English: 1,629 (4.2%)
Slovak: 745 (1.9%)
Polish: 736 (1.9%)
Greek: 651 (1.7%)
European: 611 (1.6%)
Hungarian: 573 (1.5%)
Pennsylvania German: 471 (1.2%)
Portuguese: 407 (1.0%)
Ukrainian: 254 (0.7%)
Scottish: 197 (0.5%)
Dutch: 191 (0.5%)
Brazilian: 174 (0.4%)
French: 171 (0.4%)
Welsh: 169 (0.4%)
Russian: 136 (0.3%)
Jamaican: 128 (0.3%)
Eastern European: 121 (0.3%)
Northern European: 82 (0.2%)
Lebanese: 78 (0.2%)
African: 75 (0.2%)
Ethiopian: 72 (0.2%)
West Indian: 71 (0.2%)
Serbian: 63 (0.2%)
Lithuanian: 56 (0.1%)
Czechoslovakian: 52 (0.1%)
Scotch-Irish: 48 (0.1%)
Arab: 48 (0.1%)
Haitian: 47 (0.1%)
Croatian: 47 (0.1%)
Canadian: 32 (0.08%)
Egyptian: 31 (0.08%)
Finnish: 31 (0.08%)
Turkish: 31 (0.08%)
Trinidadian and Tobagonian: 30 (0.08%)
Slovene: 29 (0.07%)
Yugoslavian: 28 (0.07%)
British: 28 (0.07%)
Ugandan: 27 (0.07%)
French Canadian: 27 (0.07%)
Norwegian: 24 (0.06%)
Austrian: 24 (0.06%)
Slavic: 22 (0.06%)
Scandinavian: 21 (0.05%)
Syrian: 20 (0.05%)
Iranian: 20 (0.05%)
Liberian: 19 (0.05%)
Luxembourger: 19 (0.05%)
Swedish: 18 (0.05%)
Bulgarian: 17 (0.04%)
Albanian: 15 (0.04%)
Nigerian: 14 (0.04%)
Belgian: 12 (0.03%)
Israeli: 11 (0.03%)
Alsatian: 10 (0.03%)
Swiss: 7 (0.02%)
Afghan: 7 (0.02%)
Bermudan: 7 (0.02%)
U.S. Virgin Islander: 4 (0.01%)
Most common places of birth for foreign-born residents (%): Dominican Republic Bethlehem:
19.7% (1,685)Pennsylvania:
9.2% (86,544)
China, excluding Hong Kong and Taiwan Bethlehem:
10.1% (860)Pennsylvania:
7.2% (67,704)
Jamaica Bethlehem:
6.2% (529)Pennsylvania:
2.4% (22,612)
Mexico Bethlehem:
5.4% (463)Pennsylvania:
5.8% (54,190)
Colombia Bethlehem:
4.8% (408)Pennsylvania:
1.5% (13,823)
Brazil Bethlehem:
4.3% (369)Pennsylvania:
1.4% (13,077)
Ecuador Bethlehem:
4.0% (346)Pennsylvania:
1.1% (10,035)
Philippines Bethlehem:
2.9% (247)Pennsylvania:
2.2% (21,039)
India Bethlehem:
2.9% (244)Pennsylvania:
10.7% (100,596)
Portugal Bethlehem:
2.7% (228)Pennsylvania:
0.3% (3,185)
Korea Bethlehem:
2.5% (216)Pennsylvania:
2.9% (27,433)
Cameroon Bethlehem:
1.8% (156)Pennsylvania:
0.2% (2,325)
Germany Bethlehem:
1.8% (152)Pennsylvania:
1.9% (18,065)
Greece Bethlehem:
1.7% (145)Pennsylvania:
0.6% (5,438)
Honduras Bethlehem:
1.5% (131)Pennsylvania:
0.9% (8,463)
Place of birth for U.S.-born residents:
This state: 42,605Other state: 22,645Northeast: 16,932Midwest: 1,633South: 2,488West: 1,592 85.3% of Bethlehem residents lived in the same house 1 years ago.
Out of people who lived in different houses, 23.3% lived in this county.
Out of people who lived in different counties, 69.5% lived in Pennsylvania.
Bethlehem:
85.3%State average:
89.3%
Education attainment for males 25 years and older:
No schooling: 253Nursery to 4th grade: 05th and 6th grade: 07th and 8th grade: 1349th grade: 44910th grade: 25611th grade: 95112th grade, no diploma: 876High school graduate (or equivalency): 7,048Less than 1 year of college: 889Some college more than 1 year, no degree: 3,108Associate degree: 1,666Bachelor's degree: 5,913Master's degree: 1,787Professional school degree: 967Doctorate degree: 426
Education attainment for females 25 years and older:
No schooling: 228Nursery to 4th grade: 05th and 6th grade: 3967th and 8th grade: 469th grade: 26110th grade: 75111th grade: 83712th grade, no diploma: 103High school graduate (or equivalency): 8,280Less than 1 year of college: 1,219Some college more than 1 year, no degree: 2,664Associate degree: 3,156Bachelor's degree: 6,389Master's degree: 2,386Professional school degree: 419Doctorate degree: 613
Housing units in structures:
One, detached: 11,906One, attached: 8,613Two: 2,7973 or 4: 2,0535 to 9: 1,78810 to 19: 1,91420 to 49: 69450 or more: 2,620Mobile homes: 19House/condo owner moved in on average 10 years ago
Renter moved in on average 4 years ago
Private vs. public school enrollment:
Students in private schools in grades 1 to 8 (elementary and middle school): 729 Here:
9.7%Pennsylvania:
15.7%
Students in private schools in grades 9 to 12 (high school): 218 Here:
6.9%Pennsylvania:
13.4%
Students in private undergraduate colleges: 5,093 Here:
72.4%Pennsylvania:
39.8%