Bowie, MD (Maryland) Houses and Residents
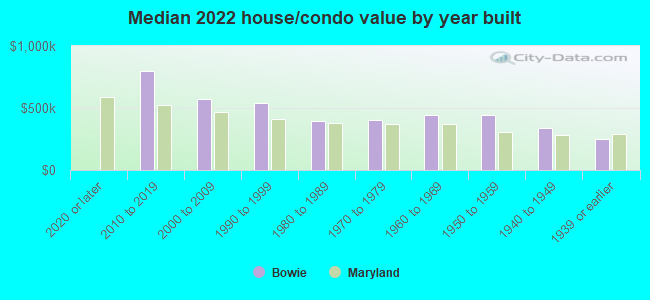
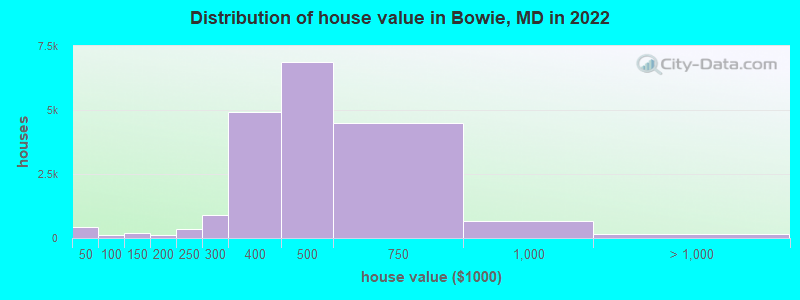
Estimated median house or condo value in 2022: $452,582 (it was $157,800 in 2000 )
Bowie:
$452,582Maryland:
$398,100
Lower value quartile - upper value quartile: $361,240 - $534,283Mean price in 2022: Detached houses: $422,042 Here:
$422,042State:
$526,819
Townhouses or other attached units: $335,135 Here:
$335,135State:
$328,305
In 5-or-more-unit structures: $266,545 Here:
$266,545State:
$350,378
Mobile homes: $230,447 Here:
$230,447State:
$89,353
Total population: 57,646 (Urban population: 49,866, Rural population: 0)
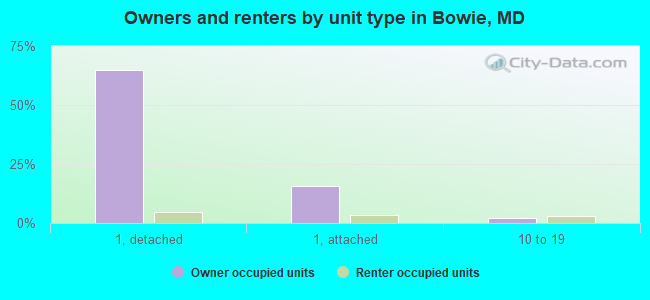
Houses: 21,645 (21,154 occupied: 18,286 owner occupied, 2,964 renter occupied )
% of renters here:
14%State:
32%
Housing density: 1,344 houses/condos per square mile
Median price asked for vacant for-sale houses and condos in 2022: $533,033.
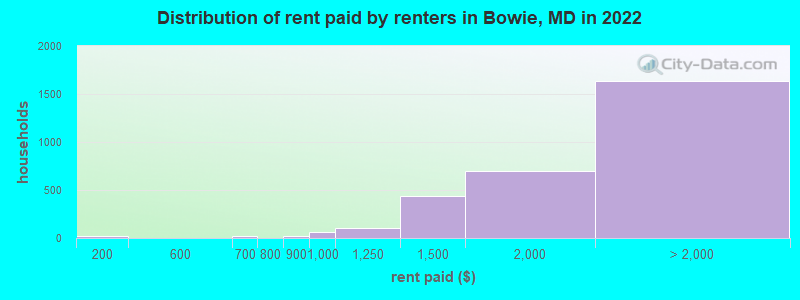
Median contract rent in 2022: $1,882 (lower quartile is $1,454, upper quartile is over $2,000)
Median rent asked for vacant for-rent units in 2022: $3,821
Median gross rent in Bowie, MD in 2022: over $2,000
Housing units in Bowie with a mortgage: 14,775 (1,662 second mortgage, 39 home equity loan, 1,238 both second mortgage and home equity loan )Houses without a mortgage: 321
Median household income for houses/condos with a mortgage: $149,323
Median household income for apartments without a mortgage: $113,967
Median monthly housing costs: $2,109
Data:
Median house or condo value ($)
Median house or condo value ($ change since 2000)
Median house or condo value ($) - White
Median house or condo value ($) - Black or African American
Median house or condo value ($) - Asian
Median house or condo value ($) - Hispanic or Latino
Median house or condo value ($) - American Indian and Alaska Native
Median house or condo value ($) - Multirace
Median house or condo value ($) - Other Race
Median price asked for mobile homes ($)
Household density (households per square mile)
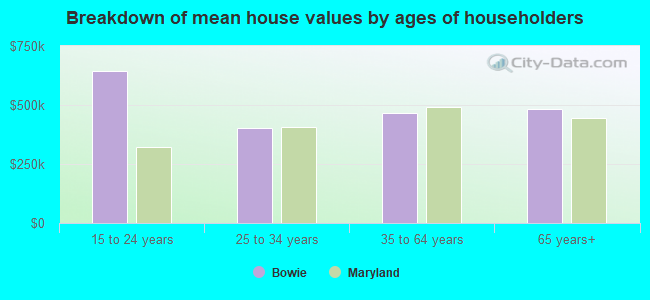
Mean house or condo value by units in structure - 1, detached ($)
Mean house or condo value by units in structure - 1, attached ($)
Mean house or condo value by units in structure - 2 ($)
Mean house or condo value by units in structure by units in structure - 3 or 4 ($)
Mean house or condo value by units in structure - 5 or more ($)
Mean house or condo value by units in structure - Boat, RV, van, etc. ($)
Mean house or condo value by units in structure - Mobile home ($)
Median contract rent ($)
Median contract rent - Lower quartile ($)
Median contract rent - Upper quartile ($)
Median gross rent ($)
Urban houses (%)
Rural houses (%)
Houses occupied (%)
Houses occupied (% change since 2000)
Houses owner occupied (%)
Houses owner occupied (% change since 2000)
Houses renter occupied (%)
Houses renter occupied (% change since 2000)
Vacant housing units - For rent (%)
Vacant housing units - For rent (% change since 2000)
Vacant housing units - For sale only (%)
Vacant housing units - For sale only (% change since 2000)
Vacant housing units - Rented or sold, not occupied (%)
Vacant housing units - Rented or sold, not occupied (% change since 2000)
Vacant housing units - For seasonal, recreational, or occasional use (%)
Vacant housing units - For seasonal, recreational, or occasional use (% change since 2000)
Vacant housing units - For migrant workers (%)
Vacant housing units - For migrant workers (% change since 2000)
Vacant housing units - Other vacant (%)
Vacant housing units - Other vacant (% change since 2000)
Median monthly housing costs ($)
Median household income for houses/condos with a mortgage ($)
Median household income for houses/condos without a mortgage ($)
Median household income ($)
Median household income ($) - White
Median household income ($) - Black or African American
Median household income ($) - Asian
Median household income ($) - Hispanic or Latino
Median household income ($) - American Indian and Alaska Native
Median household income ($) - Multirace
Median household income ($) - Other Race
Mortgage status - with mortgage (%)
Mortgage status - with second mortgage (%)
Mortgage status - with home equity loan (%)
Mortgage status - with both second mortgage and home equity loan (%)
Mortgage status - without a mortgage (%)
Median year house/condo built
Median year apartment built
Household type by relationship - Male householder living alone (%)
Household type by relationship - Male householder not living alone (%)
Household type by relationship - Female householder living alone (%)
Household type by relationship - Female householder not living alone (%)
Household type by relationship - Opposite-Sex spouse (%)
Household type by relationship - Same-Sex spouse (%)
Household type by relationship - Opposite-Sex unmarried partner (%)
Household type by relationship - Same-Sex unmarried partner (%)
Household type by relationship - In group quarters (%)
Size of family households - 2-person household (%)
Size of family households - 3-person household (%)
Size of family households - 4-person household (%)
Size of family households - 5-person household (%)
Size of family households - 6-person household (%)
Size of family households - 7-or-more-person household (%)
Size of nonfamily households - 1-person household (%)
Size of nonfamily households - 2-person household (%)
Size of nonfamily households - 3-person household (%)
Size of nonfamily households - 4-person household (%)
Size of nonfamily households - 5-person household (%)
Size of nonfamily households - 6-person household (%)
Size of nonfamily households - 7-or-moreperson household (%)
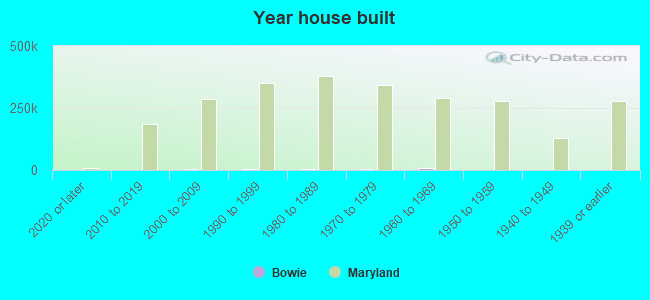
Year house built - Built 2010 or later (%)
Year house built - Built 2000 to 2009 (%)
Year house built - Built 1990 to 1999 (%)
Year house built - Built 1980 to 1989 (%)
Year house built - Built 1970 to 1979 (%)
Year house built - Built 1960 to 1969 (%)
Year house built - Built 1950 to 1959 (%)
Year house built - Built 1940 to 1949 (%)
Year house built - Built 1939 or earlier (%)
Median number of rooms in houses and condos
Median number of rooms in apartments
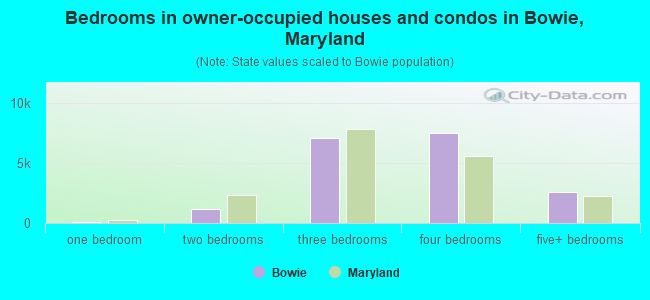
Median number of bedrooms in owner occupied houses
Mean number of bedrooms in owner occupied houses
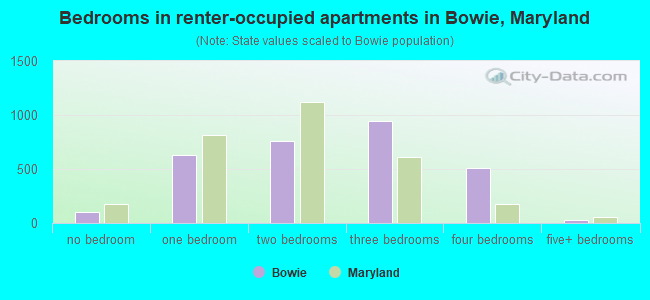
Median number of bedrooms in renter occupied houses
Mean number of bedrooms in renter occupied houses
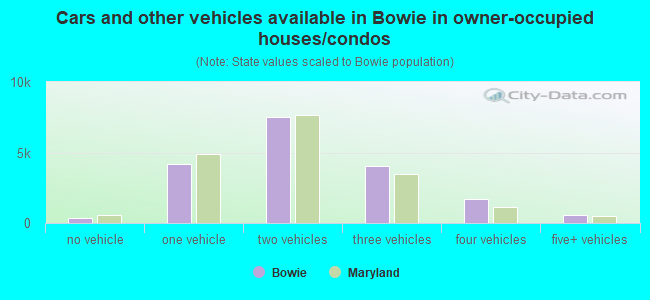
Median number of vehichles in owner occupied houses
Mean number of vehichles in owner occupied houses
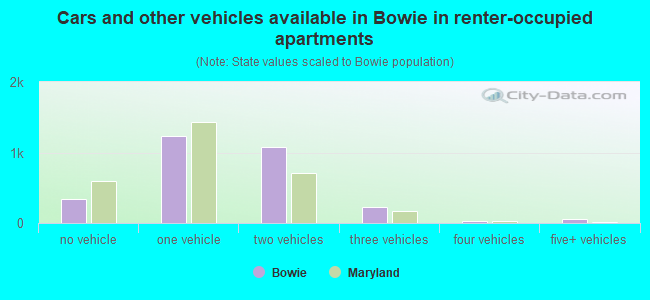
Median number of vehichles in renter occupied houses
Mean number of vehichles in renter occupied houses
Rooms in owner-occupied houses - 1 room (%)
Rooms in owner-occupied houses - 2 rooms (%)
Rooms in owner-occupied houses - 3 rooms (%)
Rooms in owner-occupied houses - 4 rooms (%)
Rooms in owner-occupied houses - 5 rooms (%)
Rooms in owner-occupied houses - 6 rooms (%)
Rooms in owner-occupied houses - 7 rooms (%)
Rooms in owner-occupied houses - 8 rooms (%)
Rooms in owner-occupied houses - 9+ rooms (%)
Rooms in renter-occupied houses - 1 room (%)
Rooms in renter-occupied houses - 2 rooms (%)
Rooms in renter-occupied houses - 3 rooms (%)
Rooms in renter-occupied houses - 4 rooms (%)
Rooms in renter-occupied houses - 5 rooms (%)
Rooms in renter-occupied houses - 6 rooms (%)
Rooms in renter-occupied houses - 7 rooms (%)
Rooms in renter-occupied houses - 8 rooms (%)
Rooms in renter-occupied houses - 9+ rooms (%)
Bedrooms in owner-occupied houses - no bedrooms (%)
Bedrooms in owner-occupied houses - 1 bedroom (%)
Bedrooms in owner-occupied houses - 2 bedrooms (%)
Bedrooms in owner-occupied houses - 3 bedrooms (%)
Bedrooms in owner-occupied houses - 4 bedrooms (%)
Bedrooms in owner-occupied houses - 5+ bedrooms (%)
Bedrooms in renter-occupied houses - no bedrooms (%)
Bedrooms in renter-occupied houses - 1 bedroom (%)
Bedrooms in renter-occupied houses - 2 bedrooms (%)
Bedrooms in renter-occupied houses - 3 bedrooms (%)
Bedrooms in renter-occupied houses - 4 bedrooms (%)
Bedrooms in renter-occupied houses - 5+ bedrooms (%)
Vehicles available in owner-occupied houses - no vehicle available (%)
Vehicles available in owner-occupied houses - 1 vehicle available(%)
Vehicles available in owner-occupied houses - 2 Vehicles available (%)
Vehicles available in owner-occupied houses - 3 Vehicles available (%)
Vehicles available in owner-occupied houses - 4 Vehicles available (%)
Vehicles available in owner-occupied houses - 5+ Vehicles available (%)
Vehicles available in renter-occupied houses - no vehicle available (%)
Vehicles available in renter-occupied houses - 1 vehicle available (%)
Vehicles available in renter-occupied houses - 2 Vehicles available (%)
Vehicles available in renter-occupied houses - 3 Vehicles available (%)
Vehicles available in renter-occupied houses - 4 Vehicles available (%)
Vehicles available in renter-occupied houses - 5+ Vehicles available (%)
Housing units in structures - 1, detached (%)
Housing units in structures - 1, attached (%)
Housing units in structures - 2 (%)
Housing units in structures - 3 or 4 (%)
Housing units in structures - 5 to 9 (%)
Housing units in structures - 10 to 19 (%)
Housing units in structures - 20 to 49 (%)
Housing units in structures - 50 or more (%)
Housing units in structures - Mobile home (%)
Housing units in structures - Boat, RV, van, etc. (%)
Housing units in structures - Owners - 1, detached (%)
Housing units in structures - Owners - 1, attached (%)
Housing units in structures - Owners - 2 (%)
Housing units in structures - Owners - 3 or 4 (%)
Housing units in structures - Owners - 5 to 9 (%)
Housing units in structures - Owners - 10 to 19 (%)
Housing units in structures - Owners - 20 to 49 (%)
Housing units in structures - Owners - 50 or more (%)
Housing units in structures - Owners - Mobile home (%)
Housing units in structures - Owners - Boat, RV, van, etc. (%)
Housing units in structures - Renters - 1, detached (%)
Housing units in structures - Renters - 1, attached (%)
Housing units in structures - Renters - 2 (%)
Housing units in structures - Renters - 3 or 4 (%)
Housing units in structures - Renters - 5 to 9 (%)
Housing units in structures - Renters - 10 to 19 (%)
Housing units in structures - Renters - 20 to 49 (%)
Housing units in structures - Renters - 50 or more (%)
Housing units in structures - Renters - Mobile home (%)
Housing units in structures - Renters - Boat, RV, van, etc. (%)
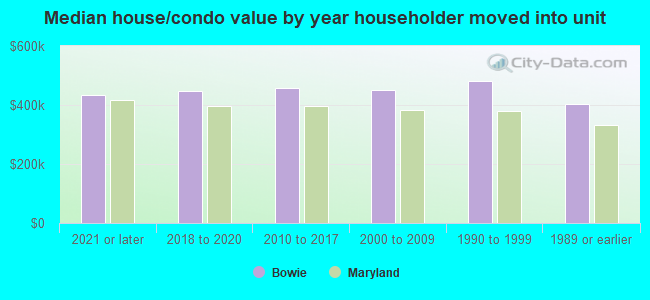
House/condo owner moved in on average (years ago)
Renter moved in on average (years ago)
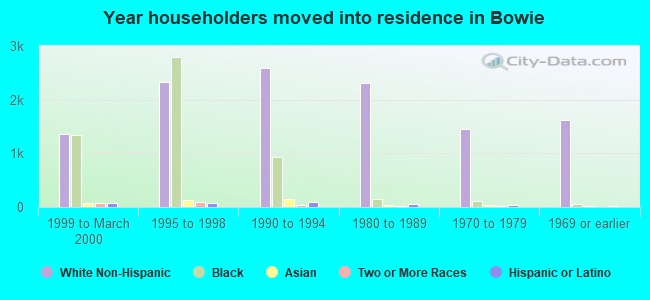
Year householder moved into unit - Moved in 1999 to March 2000 (%)
Year householder moved into unit - Moved in 1999 to March 2000 (%) - White
Year householder moved into unit - Moved in 1999 to March 2000 (%) - Black or African American
Year householder moved into unit - Moved in 1999 to March 2000 (%) - Asian
Year householder moved into unit - Moved in 1999 to March 2000 (%) - Hispanic or Latino
Year householder moved into unit - Moved in 1999 to March 2000 (%) - American Indian and Alaska Native
Year householder moved into unit - Moved in 1999 to March 2000 (%) - Multirace
Year householder moved into unit - Moved in 1999 to March 2000 (%) - Other Race
Year householder moved into unit - Moved in 1995 to 1998 (%)
Year householder moved into unit - Moved in 1995 to 1998 (%) - White
Year householder moved into unit - Moved in 1995 to 1998 (%) - Black or African American
Year householder moved into unit - Moved in 1995 to 1998 (%) - Asian
Year householder moved into unit - Moved in 1995 to 1998 (%) - Hispanic or Latino
Year householder moved into unit - Moved in 1995 to 1998 (%) - American Indian and Alaska Native
Year householder moved into unit - Moved in 1995 to 1998 (%) - Multirace
Year householder moved into unit - Moved in 1995 to 1998 (%) - Other Race
Year householder moved into unit - Moved in 1990 to 1994 (%)
Year householder moved into unit - Moved in 1990 to 1994 (%) - White
Year householder moved into unit - Moved in 1990 to 1994 (%) - Black or African American
Year householder moved into unit - Moved in 1990 to 1994 (%) - Asian
Year householder moved into unit - Moved in 1990 to 1994 (%) - Hispanic or Latino
Year householder moved into unit - Moved in 1990 to 1994 (%) - American Indian and Alaska Native
Year householder moved into unit - Moved in 1990 to 1994 (%) - Multirace
Year householder moved into unit - Moved in 1990 to 1994 (%) - Other Race
Year householder moved into unit - Moved in 1980 to 1989 (%)
Year householder moved into unit - Moved in 1980 to 1989 (%) - White
Year householder moved into unit - Moved in 1980 to 1989 (%) - Black or African American
Year householder moved into unit - Moved in 1980 to 1989 (%) - Asian
Year householder moved into unit - Moved in 1980 to 1989 (%) - Hispanic or Latino
Year householder moved into unit - Moved in 1980 to 1989 (%) - American Indian and Alaska Native
Year householder moved into unit - Moved in 1980 to 1989 (%) - Multirace
Year householder moved into unit - Moved in 1980 to 1989 (%) - Other Race
Year householder moved into unit - Moved in 1970 to 1979 (%)
Year householder moved into unit - Moved in 1970 to 1979 (%) - White
Year householder moved into unit - Moved in 1970 to 1979 (%) - Black or African American
Year householder moved into unit - Moved in 1970 to 1979 (%) - Asian
Year householder moved into unit - Moved in 1970 to 1979 (%) - Hispanic or Latino
Year householder moved into unit - Moved in 1970 to 1979 (%) - American Indian and Alaska Native
Year householder moved into unit - Moved in 1970 to 1979 (%) - Multirace
Year householder moved into unit - Moved in 1970 to 1979 (%) - Other Race
Year householder moved into unit - Moved in 1969 or earlier (%)
Year householder moved into unit - Moved in 1969 or earlier (%) - White
Year householder moved into unit - Moved in 1969 or earlier (%) - Black or African American
Year householder moved into unit - Moved in 1969 or earlier (%) - Asian
Year householder moved into unit - Moved in 1969 or earlier (%) - Hispanic or Latino
Year householder moved into unit - Moved in 1969 or earlier (%) - American Indian and Alaska Native
Year householder moved into unit - Moved in 1969 or earlier (%) - Multirace
Year householder moved into unit - Moved in 1969 or earlier (%) - Other Race
Housing units lacking complete plumbing facilities (%)
Housing units lacking complete kitchen facilities (%)
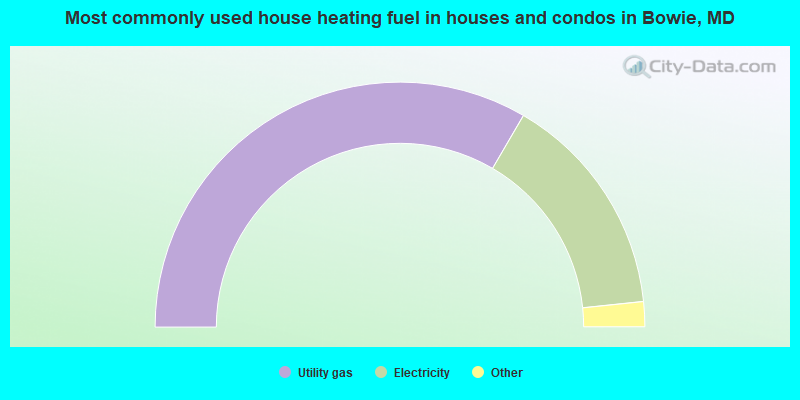
House heating fuel used in houses and condos - Utility gas (%)
House heating fuel used in houses and condos - Bottled, tank, or LP gas (%)
House heating fuel used in houses and condos - Electricity (%)
House heating fuel used in houses and condos - Fuel oil, kerosene, etc. (%)
House heating fuel used in houses and condos - Coal or coke (%)
House heating fuel used in houses and condos - Wood (%)
House heating fuel used in houses and condos - Solar energy (%)
House heating fuel used in houses and condos - Other fuel (%)
House heating fuel used in houses and condos - No fuel used (%)
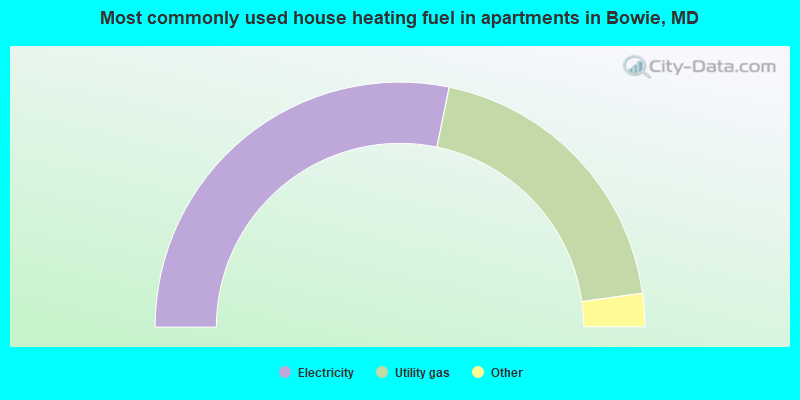
House heating fuel used in apartments - Utility gas (%)
House heating fuel used in apartments - Bottled, tank, or LP gas (%)
House heating fuel used in apartments - Electricity (%)
House heating fuel used in apartments - Fuel oil, kerosene, etc. (%)
House heating fuel used in apartments - Coal or coke (%)
House heating fuel used in apartments - Wood (%)
House heating fuel used in apartments - Solar energy (%)
House heating fuel used in apartments - Other fuel (%)
House heating fuel used in apartments - No fuel used (%)
Latest news about housing in Bowie, MD collected exclusively by city-data.com from local newspapers, TV, and radio stations
Median year house/condo built: 1980Median year apartment built: 1989Household type by relationship:
Households: 57,303
Male householders: 8,717 (1,497 living alone ), Female householders: 11,934 (3,443 living alone )10,776 spouses (10,641 opposite-sex spouses ), 1,026 unmarried partners , (1,020 opposite-sex unmarried partners ), 17,620 children (16,954 natural , 352 adopted , 314 stepchildren ), 1,310 grandchildren , 935 brothers or sisters , 1,571 parents , 0 foster children , 1,639 other relatives , 1,241 non-relatives In group quarters: 528
Size of family households: 6,204 2-persons , 3,939 3-persons , 3,272 4-persons , 1,513 5-persons , 391 6-persons , 346 7-or-more-persons .
Size of nonfamily households: 4,863 1-person , 683 2-persons , 150 3-persons , 23 4-persons .
7,441 married couples with children. single-parent households (561 men , 2,325 women ).
81.5% of residents of Bowie speak English at home. of residents speak Spanish at home (67% speak English very well , 24% speak English well , 9% speak English not well , 1% don't speak English at all ).of residents speak other Indo-European language at home (79% speak English very well , 13% speak English well , 6% speak English not well , 1% don't speak English at all ).of residents speak Asian or Pacific Island language at home (68% speak English very well , 19% speak English well , 12% speak English not well , 1% don't speak English at all ).of residents speak other language at home (89% speak English very well , 6% speak English well , 4% speak English not well ).
Foreign born population: 9,966 (17.4%)of them are naturalized citizens )
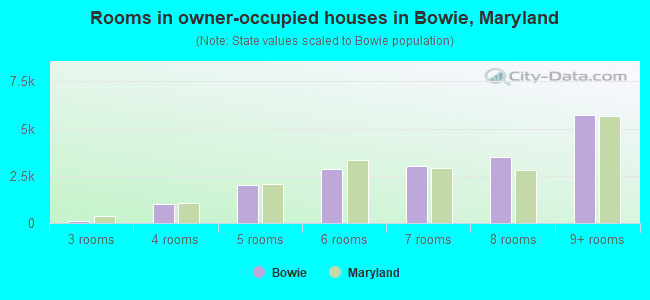
Median number of rooms in houses and condos:
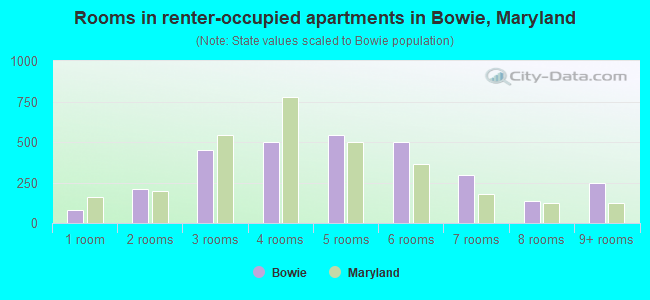
Median number of rooms in apartments
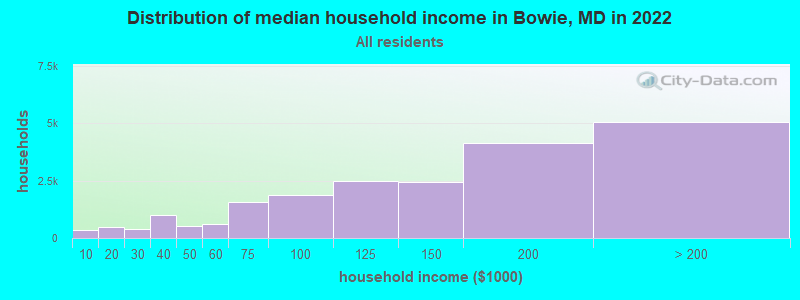
Bowie, MD household income distribution 338 Less than $10,000490 $10,000 to $19,999412 $20,000 to $29,999982 $30,000 to $39,999525 $40,000 to $49,999615 $50,000 to $59,9991,550 $60,000 to $74,9991,891 $75,000 to $99,9992,500 $100,000 to $124,9992,435 $125,000 to $149,9994,128 $150,000 to $199,9995,059 $200,000 or more
Home value of owner - occupied houses in 2022 in Bowie, MD 222 Less than $10,00015 $15,000 to $19,99913 $25,000 to $29,99943 $30,000 to $34,99917 $35,000 to $39,999100 $40,000 to $49,99917 $50,000 to $59,9995 $60,000 to $69,9994 $70,000 to $79,99919 $100,000 to $124,999167 $125,000 to $149,99946 $150,000 to $174,99975 $175,000 to $199,999351 $200,000 to $249,999879 $250,000 to $299,9994,939 $300,000 to $399,9996,887 $400,000 to $499,9994,493 $500,000 to $749,999664 $750,000 to $999,999124 $1,000,000 to $1,499,99932 $2,000,000 or moreRent paid by renters in 2022 in Bowie, MD 19 $100 to $14924 $600 to $6493 $750 to $79923 $800 to $89965 $900 to $999102 $1,000 to $1,249432 $1,250 to $1,499697 $1,500 to $1,9991,099 $2,000 to $2,49966 $2,500 to $2,99946 $3,000 to $3,49926 $3,500 or more393 No cash rent
Percentage of workers working in this county: 63.3%Number of people working at home: 9,010 (28.9% of all workers )
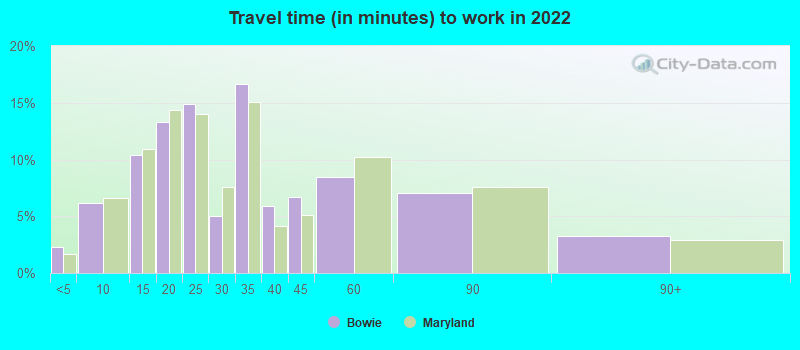
Travel time to work (commute)
Less than 5 minutes: 3045 to 9 minutes: 1,02410 to 14 minutes: 1,84815 to 19 minutes: 2,23320 to 24 minutes: 2,42525 to 29 minutes: 1,42030 to 34 minutes: 3,75035 to 39 minutes: 1,32740 to 44 minutes: 1,31945 to 59 minutes: 3,77860 to 89 minutes: 2,85290 or more minutes: 901
Means of transportation to work:
Drove a car alone: 11,596 (52.9%)Carpooled: 1,722 (7.9%)Bus : 122 (0.6%)Subway or elevated rail : 34 (0.2%)Long-distance train or commuter rail : 19 (0.1%)Taxi: 353 (1.6%)Bicycle: 43 (0.2%)Walked: 223 (1.0%)Worked at home: 9,010 (41.1%)
Unemployment by race in 2022
Unemployment rate for White non-Hispanic residents 2.6% Males3.7% FemalesUnemployment rate for Black residents 6.8% Males3.4% FemalesUnemployment rate for Asian residents 11.1% Males4.6% FemalesUnemployment rate for other race residents 1.9% Males0.9% FemalesUnemployment rate for two or more race residents 1.5% Males7.3% FemalesUnemployment rate for Hispanic or Latino residents 1.8% Males2.3% Females
Year of entry for the foreign-born population in Bowie, Maryland
2,193 2010 or later 2,641 2000 to 2009 1,690 1990 to 1999 1,123 1980 to 1989 686 1970 to 1979 698 Before 1970
First ancestries reported:
Nigerian: 2,102 (6.1%)
Irish: 1,434 (4.2%)
Jamaican: 1,059 (3.1%)
American: 1,056 (3.1%)
German: 943 (2.7%)
English: 714 (2.1%)
African: 711 (2.1%)
Italian: 439 (1.3%)
Sierra Leonean: 419 (1.2%)
Guyanese: 326 (0.9%)
Ghanaian: 307 (0.9%)
Ethiopian: 306 (0.9%)
European: 234 (0.7%)
Polish: 198 (0.6%)
West Indian: 196 (0.6%)
Liberian: 168 (0.5%)
Scotch-Irish: 157 (0.5%)
Trinidadian and Tobagonian: 149 (0.4%)
Iranian: 134 (0.4%)
Albanian: 97 (0.3%)
Eastern European: 97 (0.3%)
Scottish: 94 (0.3%)
Slovak: 94 (0.3%)
Haitian: 91 (0.3%)
Norwegian: 71 (0.2%)
French Canadian: 59 (0.2%)
British: 53 (0.2%)
French: 50 (0.1%)
Barbadian: 49 (0.1%)
South African: 47 (0.1%)
British West Indian: 47 (0.1%)
Russian: 47 (0.1%)
Bahamian: 41 (0.1%)
Hungarian: 40 (0.1%)
Lithuanian: 40 (0.1%)
Palestinian: 35 (0.1%)
Northern European: 33 (0.10%)
Cape Verdean: 32 (0.09%)
Egyptian: 30 (0.09%)
Welsh: 29 (0.08%)
Czech: 27 (0.08%)
Austrian: 26 (0.08%)
Armenian: 26 (0.08%)
Kenyan: 21 (0.06%)
Carpatho Rusyn: 20 (0.06%)
Danish: 20 (0.06%)
Senegalese: 20 (0.06%)
Arab: 19 (0.06%)
Bulgarian: 18 (0.05%)
Ukrainian: 18 (0.05%)
Finnish: 16 (0.05%)
Swedish: 16 (0.05%)
Scandinavian: 12 (0.03%)
Dutch: 12 (0.03%)
Lebanese: 10 (0.03%)
Belgian: 9 (0.03%)
Portuguese: 8 (0.02%)
Greek: 7 (0.02%)
Celtic: 6 (0.02%)
Most common places of birth for foreign-born residents (%): Nigeria Bowie:
14.9% (1,463)Maryland:
4.6% (44,825)
Jamaica Bowie:
9.5% (937)Maryland:
2.8% (27,444)
Cameroon Bowie:
7.0% (692)Maryland:
2.5% (23,969)
El Salvador Bowie:
6.6% (653)Maryland:
12.0% (115,412)
Philippines Bowie:
6.6% (644)Maryland:
3.8% (36,698)
Sierra Leone Bowie:
4.8% (467)Maryland:
1.1% (10,233)
Mexico Bowie:
3.8% (376)Maryland:
3.5% (34,065)
Guyana Bowie:
3.8% (373)Maryland:
0.8% (8,109)
India Bowie:
3.2% (317)Maryland:
6.4% (61,725)
Liberia Bowie:
2.9% (286)Maryland:
0.6% (5,959)
Pakistan Bowie:
2.4% (238)Maryland:
1.8% (17,037)
Ghana Bowie:
2.2% (217)Maryland:
1.8% (17,774)
Dominican Republic Bowie:
2.0% (199)Maryland:
1.4% (13,947)
Ivory Coast Bowie:
1.6% (158)Maryland:
0.3% (2,949)
Place of birth for U.S.-born residents:
This state: 19,797Other state: 25,846Northeast: 5,744Midwest: 2,763South: 16,135West: 1,622 92.0% of Bowie residents lived in the same house 1 years ago.
Out of people who lived in different houses, 39.8% lived in this county.
Out of people who lived in different counties, 59.5% lived in Maryland.
Bowie:
92.0%State average:
88.5%
Education attainment for males 25 years and older:
No schooling: 190Nursery to 4th grade: 565th and 6th grade: 187th and 8th grade: 769th grade: 15810th grade: 6211th grade: 13212th grade, no diploma: 334High school graduate (or equivalency): 3,662Less than 1 year of college: 1,260Some college more than 1 year, no degree: 2,143Associate degree: 1,518Bachelor's degree: 4,784Master's degree: 3,586Professional school degree: 579Doctorate degree: 512
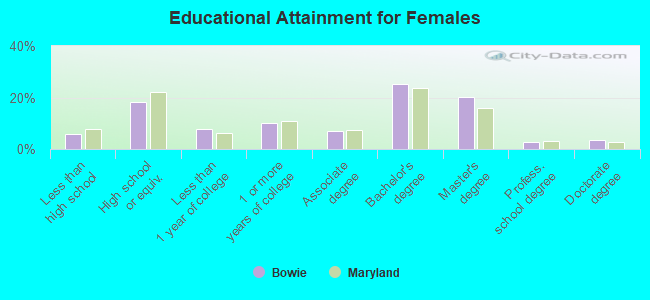
Education attainment for females 25 years and older:
No schooling: 384Nursery to 4th grade: 475th and 6th grade: 257th and 8th grade: 469th grade: 18710th grade: 12211th grade: 19112th grade, no diploma: 298High school graduate (or equivalency): 4,128Less than 1 year of college: 1,750Some college more than 1 year, no degree: 2,310Associate degree: 1,554Bachelor's degree: 5,802Master's degree: 4,644Professional school degree: 582Doctorate degree: 762
Housing units in structures:
One, detached: 15,915One, attached: 3,928Two: 153 or 4: 525 to 9: 15210 to 19: 54920 to 49: 26750 or more: 758Mobile homes: 6Housing units lacking complete plumbing facilities in 2022: 0.1%Housing units lacking complete kitchen facilities in 2022: 0.8%House/condo owner moved in on average 12 years ago
Renter moved in on average 5 years ago
Private vs. public school enrollment:
Students in private schools in grades 1 to 8 (elementary and middle school): 1,187 Students in private schools in grades 9 to 12 (high school): 767 Students in private undergraduate colleges: 472