Bozeman, MT (Montana) Houses and Residents
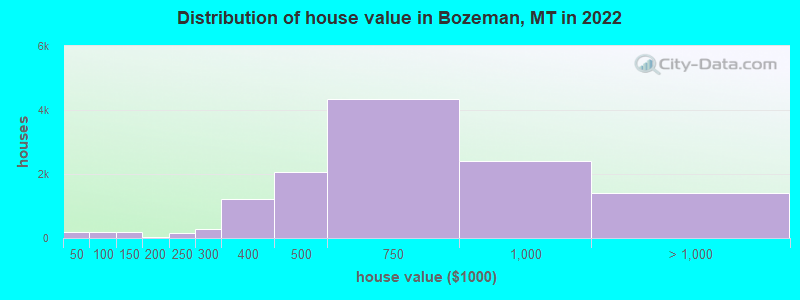
Estimated median house or condo value in 2022: $651,339 (it was $134,200 in 2000 )
Bozeman:
$651,339Montana:
$366,400
Lower value quartile - upper value quartile: $473,712 - $869,012Mean price in 2022: Detached houses: $758,431 Here:
$758,431State:
$518,333
Townhouses or other attached units: $515,174 Here:
$515,174State:
$468,033
In 2-unit structures: $517,670 Here:
$517,670State:
$254,784
In 3-to-4-unit structures: $268,581 Here:
$268,581State:
$383,074
In 5-or-more-unit structures: $624,394 Here:
$624,394State:
$373,935
Mobile homes: $81,177 Here:
$81,177State:
$139,111
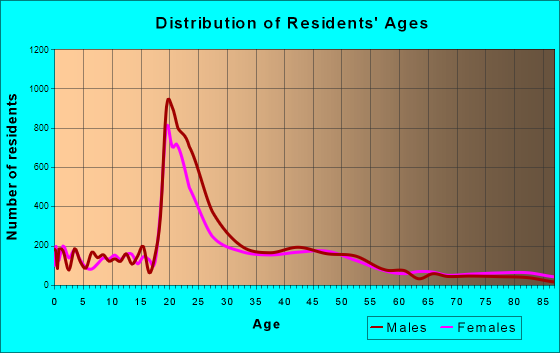
Total population: 41,660 (Urban population: 27,857 (all inside urban clusters), Rural population: 146 (all nonfarm) )
Houses: 25,528 (23,733 occupied: 10,595 owner occupied, 13,628 renter occupied )
% of renters here:
56%State:
31%
Housing density: 2,027 houses/condos per square mile
Median price asked for vacant for-sale houses and condos in 2022: $592,383.
Median contract rent in 2022: $1,533 (lower quartile is $1,074, upper quartile is $1,974)
Median rent asked for vacant for-rent units in 2022: $1,581
Median gross rent in Bozeman, MT in 2022: $1,629
Housing units in Bozeman with a mortgage: 6,912 (393 second mortgage, 103 home equity loan, 250 both second mortgage and home equity loan )Houses without a mortgage: 219
Median household income for houses/condos with a mortgage: $112,011
Median household income for apartments without a mortgage: $82,629
Median monthly housing costs: $1,584
Data:
Median house or condo value ($)
Median house or condo value ($ change since 2000)
Median house or condo value ($) - White
Median house or condo value ($) - Black or African American
Median house or condo value ($) - Asian
Median house or condo value ($) - Hispanic or Latino
Median house or condo value ($) - American Indian and Alaska Native
Median house or condo value ($) - Multirace
Median house or condo value ($) - Other Race
Median price asked for mobile homes ($)
Household density (households per square mile)
Mean house or condo value by units in structure - 1, detached ($)
Mean house or condo value by units in structure - 1, attached ($)
Mean house or condo value by units in structure - 2 ($)
Mean house or condo value by units in structure by units in structure - 3 or 4 ($)
Mean house or condo value by units in structure - 5 or more ($)
Mean house or condo value by units in structure - Boat, RV, van, etc. ($)
Mean house or condo value by units in structure - Mobile home ($)
Median contract rent ($)
Median contract rent - Lower quartile ($)
Median contract rent - Upper quartile ($)
Median gross rent ($)
Urban houses (%)
Rural houses (%)
Houses occupied (%)
Houses occupied (% change since 2000)
Houses owner occupied (%)
Houses owner occupied (% change since 2000)
Houses renter occupied (%)
Houses renter occupied (% change since 2000)
Vacant housing units - For rent (%)
Vacant housing units - For rent (% change since 2000)
Vacant housing units - For sale only (%)
Vacant housing units - For sale only (% change since 2000)
Vacant housing units - Rented or sold, not occupied (%)
Vacant housing units - Rented or sold, not occupied (% change since 2000)
Vacant housing units - For seasonal, recreational, or occasional use (%)
Vacant housing units - For seasonal, recreational, or occasional use (% change since 2000)
Vacant housing units - For migrant workers (%)
Vacant housing units - For migrant workers (% change since 2000)
Vacant housing units - Other vacant (%)
Vacant housing units - Other vacant (% change since 2000)
Median monthly housing costs ($)
Median household income for houses/condos with a mortgage ($)
Median household income for houses/condos without a mortgage ($)
Median household income ($)
Median household income ($) - White
Median household income ($) - Black or African American
Median household income ($) - Asian
Median household income ($) - Hispanic or Latino
Median household income ($) - American Indian and Alaska Native
Median household income ($) - Multirace
Median household income ($) - Other Race
Mortgage status - with mortgage (%)
Mortgage status - with second mortgage (%)
Mortgage status - with home equity loan (%)
Mortgage status - with both second mortgage and home equity loan (%)
Mortgage status - without a mortgage (%)
Median year house/condo built
Median year apartment built
Household type by relationship - Male householder living alone (%)
Household type by relationship - Male householder not living alone (%)
Household type by relationship - Female householder living alone (%)
Household type by relationship - Female householder not living alone (%)
Household type by relationship - Opposite-Sex spouse (%)
Household type by relationship - Same-Sex spouse (%)
Household type by relationship - Opposite-Sex unmarried partner (%)
Household type by relationship - Same-Sex unmarried partner (%)
Household type by relationship - In group quarters (%)
Size of family households - 2-person household (%)
Size of family households - 3-person household (%)
Size of family households - 4-person household (%)
Size of family households - 5-person household (%)
Size of family households - 6-person household (%)
Size of family households - 7-or-more-person household (%)
Size of nonfamily households - 1-person household (%)
Size of nonfamily households - 2-person household (%)
Size of nonfamily households - 3-person household (%)
Size of nonfamily households - 4-person household (%)
Size of nonfamily households - 5-person household (%)
Size of nonfamily households - 6-person household (%)
Size of nonfamily households - 7-or-moreperson household (%)
Year house built - Built 2010 or later (%)
Year house built - Built 2000 to 2009 (%)
Year house built - Built 1990 to 1999 (%)
Year house built - Built 1980 to 1989 (%)
Year house built - Built 1970 to 1979 (%)
Year house built - Built 1960 to 1969 (%)
Year house built - Built 1950 to 1959 (%)
Year house built - Built 1940 to 1949 (%)
Year house built - Built 1939 or earlier (%)
Median number of rooms in houses and condos
Median number of rooms in apartments
Median number of bedrooms in owner occupied houses
Mean number of bedrooms in owner occupied houses
Median number of bedrooms in renter occupied houses
Mean number of bedrooms in renter occupied houses
Median number of vehichles in owner occupied houses
Mean number of vehichles in owner occupied houses
Median number of vehichles in renter occupied houses
Mean number of vehichles in renter occupied houses
Rooms in owner-occupied houses - 1 room (%)
Rooms in owner-occupied houses - 2 rooms (%)
Rooms in owner-occupied houses - 3 rooms (%)
Rooms in owner-occupied houses - 4 rooms (%)
Rooms in owner-occupied houses - 5 rooms (%)
Rooms in owner-occupied houses - 6 rooms (%)
Rooms in owner-occupied houses - 7 rooms (%)
Rooms in owner-occupied houses - 8 rooms (%)
Rooms in owner-occupied houses - 9+ rooms (%)
Rooms in renter-occupied houses - 1 room (%)
Rooms in renter-occupied houses - 2 rooms (%)
Rooms in renter-occupied houses - 3 rooms (%)
Rooms in renter-occupied houses - 4 rooms (%)
Rooms in renter-occupied houses - 5 rooms (%)
Rooms in renter-occupied houses - 6 rooms (%)
Rooms in renter-occupied houses - 7 rooms (%)
Rooms in renter-occupied houses - 8 rooms (%)
Rooms in renter-occupied houses - 9+ rooms (%)
Bedrooms in owner-occupied houses - no bedrooms (%)
Bedrooms in owner-occupied houses - 1 bedroom (%)
Bedrooms in owner-occupied houses - 2 bedrooms (%)
Bedrooms in owner-occupied houses - 3 bedrooms (%)
Bedrooms in owner-occupied houses - 4 bedrooms (%)
Bedrooms in owner-occupied houses - 5+ bedrooms (%)
Bedrooms in renter-occupied houses - no bedrooms (%)
Bedrooms in renter-occupied houses - 1 bedroom (%)
Bedrooms in renter-occupied houses - 2 bedrooms (%)
Bedrooms in renter-occupied houses - 3 bedrooms (%)
Bedrooms in renter-occupied houses - 4 bedrooms (%)
Bedrooms in renter-occupied houses - 5+ bedrooms (%)
Vehicles available in owner-occupied houses - no vehicle available (%)
Vehicles available in owner-occupied houses - 1 vehicle available(%)
Vehicles available in owner-occupied houses - 2 Vehicles available (%)
Vehicles available in owner-occupied houses - 3 Vehicles available (%)
Vehicles available in owner-occupied houses - 4 Vehicles available (%)
Vehicles available in owner-occupied houses - 5+ Vehicles available (%)
Vehicles available in renter-occupied houses - no vehicle available (%)
Vehicles available in renter-occupied houses - 1 vehicle available (%)
Vehicles available in renter-occupied houses - 2 Vehicles available (%)
Vehicles available in renter-occupied houses - 3 Vehicles available (%)
Vehicles available in renter-occupied houses - 4 Vehicles available (%)
Vehicles available in renter-occupied houses - 5+ Vehicles available (%)
Housing units in structures - 1, detached (%)
Housing units in structures - 1, attached (%)
Housing units in structures - 2 (%)
Housing units in structures - 3 or 4 (%)
Housing units in structures - 5 to 9 (%)
Housing units in structures - 10 to 19 (%)
Housing units in structures - 20 to 49 (%)
Housing units in structures - 50 or more (%)
Housing units in structures - Mobile home (%)
Housing units in structures - Boat, RV, van, etc. (%)
Housing units in structures - Owners - 1, detached (%)
Housing units in structures - Owners - 1, attached (%)
Housing units in structures - Owners - 2 (%)
Housing units in structures - Owners - 3 or 4 (%)
Housing units in structures - Owners - 5 to 9 (%)
Housing units in structures - Owners - 10 to 19 (%)
Housing units in structures - Owners - 20 to 49 (%)
Housing units in structures - Owners - 50 or more (%)
Housing units in structures - Owners - Mobile home (%)
Housing units in structures - Owners - Boat, RV, van, etc. (%)
Housing units in structures - Renters - 1, detached (%)
Housing units in structures - Renters - 1, attached (%)
Housing units in structures - Renters - 2 (%)
Housing units in structures - Renters - 3 or 4 (%)
Housing units in structures - Renters - 5 to 9 (%)
Housing units in structures - Renters - 10 to 19 (%)
Housing units in structures - Renters - 20 to 49 (%)
Housing units in structures - Renters - 50 or more (%)
Housing units in structures - Renters - Mobile home (%)
Housing units in structures - Renters - Boat, RV, van, etc. (%)
House/condo owner moved in on average (years ago)
Renter moved in on average (years ago)
Year householder moved into unit - Moved in 1999 to March 2000 (%)
Year householder moved into unit - Moved in 1999 to March 2000 (%) - White
Year householder moved into unit - Moved in 1999 to March 2000 (%) - Black or African American
Year householder moved into unit - Moved in 1999 to March 2000 (%) - Asian
Year householder moved into unit - Moved in 1999 to March 2000 (%) - Hispanic or Latino
Year householder moved into unit - Moved in 1999 to March 2000 (%) - American Indian and Alaska Native
Year householder moved into unit - Moved in 1999 to March 2000 (%) - Multirace
Year householder moved into unit - Moved in 1999 to March 2000 (%) - Other Race
Year householder moved into unit - Moved in 1995 to 1998 (%)
Year householder moved into unit - Moved in 1995 to 1998 (%) - White
Year householder moved into unit - Moved in 1995 to 1998 (%) - Black or African American
Year householder moved into unit - Moved in 1995 to 1998 (%) - Asian
Year householder moved into unit - Moved in 1995 to 1998 (%) - Hispanic or Latino
Year householder moved into unit - Moved in 1995 to 1998 (%) - American Indian and Alaska Native
Year householder moved into unit - Moved in 1995 to 1998 (%) - Multirace
Year householder moved into unit - Moved in 1995 to 1998 (%) - Other Race
Year householder moved into unit - Moved in 1990 to 1994 (%)
Year householder moved into unit - Moved in 1990 to 1994 (%) - White
Year householder moved into unit - Moved in 1990 to 1994 (%) - Black or African American
Year householder moved into unit - Moved in 1990 to 1994 (%) - Asian
Year householder moved into unit - Moved in 1990 to 1994 (%) - Hispanic or Latino
Year householder moved into unit - Moved in 1990 to 1994 (%) - American Indian and Alaska Native
Year householder moved into unit - Moved in 1990 to 1994 (%) - Multirace
Year householder moved into unit - Moved in 1990 to 1994 (%) - Other Race
Year householder moved into unit - Moved in 1980 to 1989 (%)
Year householder moved into unit - Moved in 1980 to 1989 (%) - White
Year householder moved into unit - Moved in 1980 to 1989 (%) - Black or African American
Year householder moved into unit - Moved in 1980 to 1989 (%) - Asian
Year householder moved into unit - Moved in 1980 to 1989 (%) - Hispanic or Latino
Year householder moved into unit - Moved in 1980 to 1989 (%) - American Indian and Alaska Native
Year householder moved into unit - Moved in 1980 to 1989 (%) - Multirace
Year householder moved into unit - Moved in 1980 to 1989 (%) - Other Race
Year householder moved into unit - Moved in 1970 to 1979 (%)
Year householder moved into unit - Moved in 1970 to 1979 (%) - White
Year householder moved into unit - Moved in 1970 to 1979 (%) - Black or African American
Year householder moved into unit - Moved in 1970 to 1979 (%) - Asian
Year householder moved into unit - Moved in 1970 to 1979 (%) - Hispanic or Latino
Year householder moved into unit - Moved in 1970 to 1979 (%) - American Indian and Alaska Native
Year householder moved into unit - Moved in 1970 to 1979 (%) - Multirace
Year householder moved into unit - Moved in 1970 to 1979 (%) - Other Race
Year householder moved into unit - Moved in 1969 or earlier (%)
Year householder moved into unit - Moved in 1969 or earlier (%) - White
Year householder moved into unit - Moved in 1969 or earlier (%) - Black or African American
Year householder moved into unit - Moved in 1969 or earlier (%) - Asian
Year householder moved into unit - Moved in 1969 or earlier (%) - Hispanic or Latino
Year householder moved into unit - Moved in 1969 or earlier (%) - American Indian and Alaska Native
Year householder moved into unit - Moved in 1969 or earlier (%) - Multirace
Year householder moved into unit - Moved in 1969 or earlier (%) - Other Race
Housing units lacking complete plumbing facilities (%)
Housing units lacking complete kitchen facilities (%)
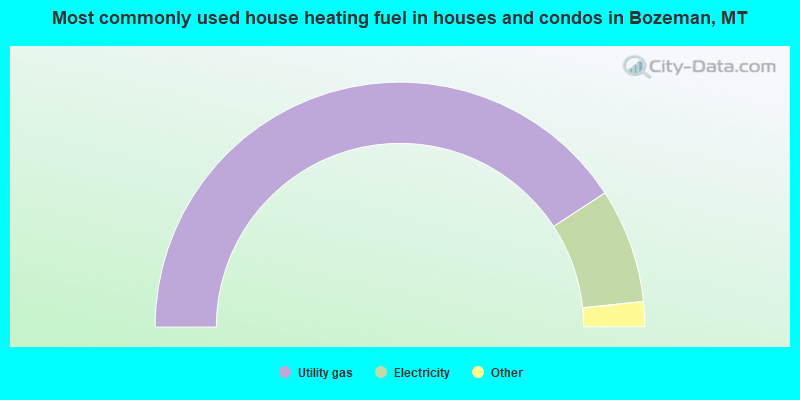
House heating fuel used in houses and condos - Utility gas (%)
House heating fuel used in houses and condos - Bottled, tank, or LP gas (%)
House heating fuel used in houses and condos - Electricity (%)
House heating fuel used in houses and condos - Fuel oil, kerosene, etc. (%)
House heating fuel used in houses and condos - Coal or coke (%)
House heating fuel used in houses and condos - Wood (%)
House heating fuel used in houses and condos - Solar energy (%)
House heating fuel used in houses and condos - Other fuel (%)
House heating fuel used in houses and condos - No fuel used (%)
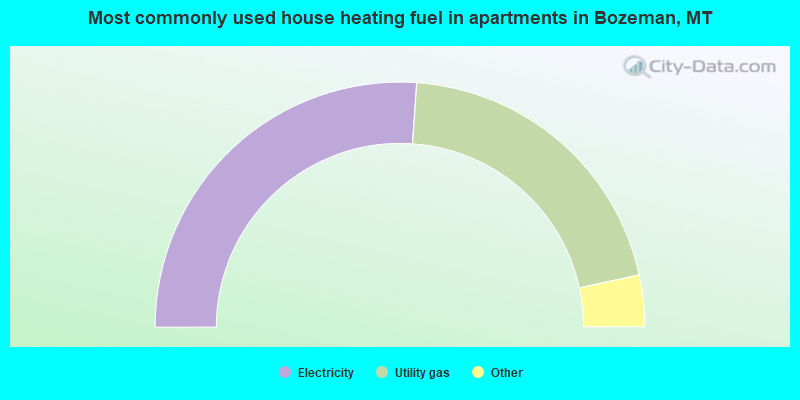
House heating fuel used in apartments - Utility gas (%)
House heating fuel used in apartments - Bottled, tank, or LP gas (%)
House heating fuel used in apartments - Electricity (%)
House heating fuel used in apartments - Fuel oil, kerosene, etc. (%)
House heating fuel used in apartments - Coal or coke (%)
House heating fuel used in apartments - Wood (%)
House heating fuel used in apartments - Solar energy (%)
House heating fuel used in apartments - Other fuel (%)
House heating fuel used in apartments - No fuel used (%)
Latest news about housing in Bozeman, MT collected exclusively by city-data.com from local newspapers, TV, and radio stations
Median year house/condo built: 2001Median year apartment built: 1995Household type by relationship:
Households: 55,811
Male householders: 12,680 (3,310 living alone ), Female householders: 10,313 (3,287 living alone )8,070 spouses (8,043 opposite-sex spouses ), 2,590 unmarried partners , (2,490 opposite-sex unmarried partners ), 8,991 children (8,685 natural , 211 adopted , 93 stepchildren ), 215 grandchildren , 515 brothers or sisters , 95 parents , 0 foster children , 184 other relatives , 7,768 non-relatives In group quarters: 4,385
Size of family households: 5,404 2-persons , 3,210 3-persons , 1,468 4-persons , 643 5-persons , 132 6-persons , 19 7-or-more-persons .
Size of nonfamily households: 6,623 1-person , 4,938 2-persons , 1,039 3-persons , 510 4-persons , 304 5-persons , 47 6-persons .
5,021 married couples with children. single-parent households (522 men , 1,890 women ).
93.9% of residents of Bozeman speak English at home. of residents speak Spanish at home (83% speak English very well , 14% speak English well , 2% speak English not well ).of residents speak other Indo-European language at home (82% speak English very well , 17% speak English well ).of residents speak Asian or Pacific Island language at home (72% speak English very well , 21% speak English well , 8% speak English not well ).of residents speak other language at home (63% speak English very well , 37% speak English well ).
Foreign born population: 2,555 (4.6%)of them are naturalized citizens )
Median number of rooms in houses and condos:
Median number of rooms in apartments
Owner-occupied Renter-occupied
Rooms in owner-occupied houses in Bozeman, Montana
69 1 room 12 2 rooms 487 3 rooms 1,418 4 rooms 1,887 5 rooms 2,288 6 rooms 909 7 rooms 1,552 8 rooms 1,974 9+ rooms
Rooms in renter-occupied apartments in Bozeman, Montana
517 1 room 968 2 rooms 2,995 3 rooms 4,088 4 rooms 2,284 5 rooms 1,233 6 rooms 813 7 rooms 461 8 rooms 269 9+ rooms
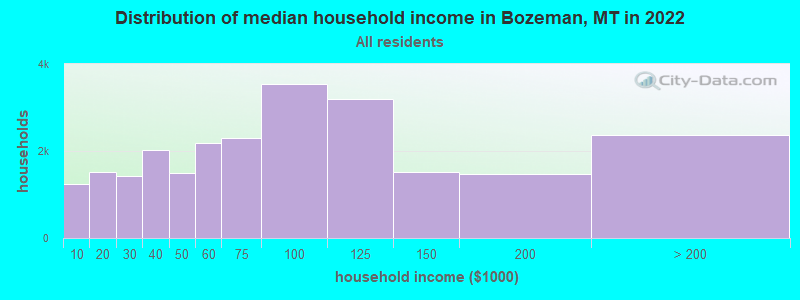
Bozeman, MT household income distribution 1,237 Less than $10,0001,516 $10,000 to $19,9991,420 $20,000 to $29,9992,031 $30,000 to $39,9991,490 $40,000 to $49,9992,185 $50,000 to $59,9992,304 $60,000 to $74,9993,532 $75,000 to $99,9993,198 $100,000 to $124,9991,523 $125,000 to $149,9991,471 $150,000 to $199,9992,364 $200,000 or more
Home value of owner - occupied houses in 2022 in Bozeman, MT 110 Less than $10,0006 $10,000 to $14,99911 $20,000 to $24,99924 $35,000 to $39,99928 $40,000 to $49,99956 $50,000 to $59,99966 $60,000 to $69,9995 $70,000 to $79,99922 $80,000 to $89,9994 $90,000 to $99,999119 $100,000 to $124,99979 $125,000 to $149,99916 $175,000 to $199,999159 $200,000 to $249,999270 $250,000 to $299,9991,229 $300,000 to $399,9992,075 $400,000 to $499,9994,346 $500,000 to $749,9992,418 $750,000 to $999,999942 $1,000,000 to $1,499,999269 $1,500,000 to $1,999,999184 $2,000,000 or moreRent paid by renters in 2022 in Bozeman, MT 49 Less than $10038 $100 to $14961 $200 to $24911 $250 to $29973 $300 to $34930 $350 to $39947 $400 to $44917 $450 to $499153 $500 to $54956 $550 to $599124 $600 to $649338 $650 to $699316 $700 to $749321 $750 to $799933 $800 to $899573 $900 to $9992,139 $1,000 to $1,2492,123 $1,250 to $1,4993,966 $1,500 to $1,9991,716 $2,000 to $2,499256 $2,500 to $2,999182 $3,000 to $3,499337 $3,500 or more482 No cash rent
Percentage of workers working in this county: 97.9%Number of people working at home: 6,187 (18.5% of all workers )
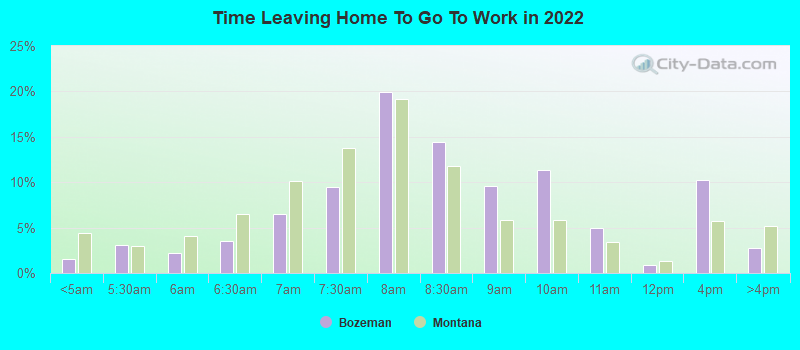
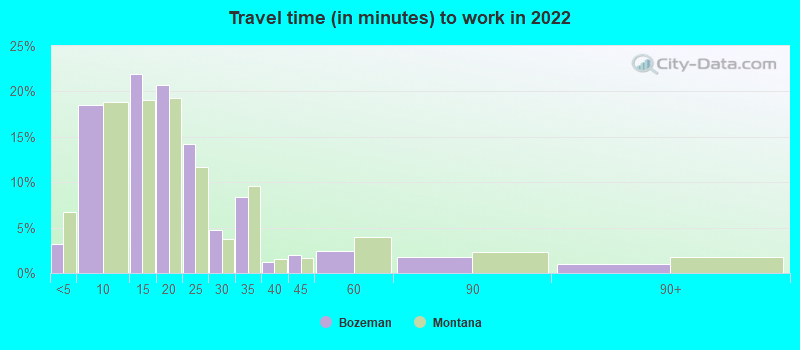
Travel time to work (commute)
Less than 5 minutes: 1,2175 to 9 minutes: 5,99410 to 14 minutes: 6,88815 to 19 minutes: 6,27220 to 24 minutes: 3,00225 to 29 minutes: 79430 to 34 minutes: 1,23935 to 39 minutes: 5340 to 44 minutes: 21845 to 59 minutes: 63460 to 89 minutes: 34690 or more minutes: 125
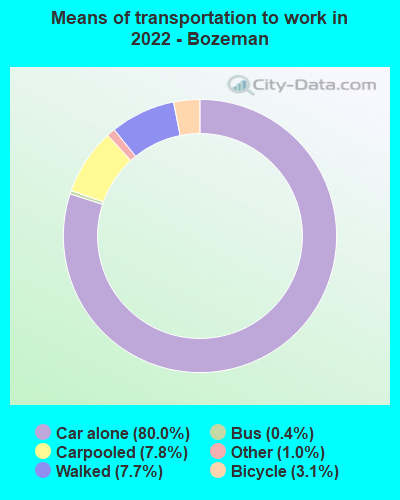
Means of transportation to work:
Drove a car alone: 28,330 (68.0%)Carpooled: 2,489 (6.0%)Bus : 84 (0.2%)Taxi: 349 (0.8%)Bicycle: 1,125 (2.7%)Walked: 2,860 (6.9%)Worked at home: 6,187 (14.9%)
Unemployment by race in 2022
Unemployment rate for White non-Hispanic residents 2.8% Males4.7% FemalesUnemployment rate for American Indian and Alaska Native residents 30.9% FemalesUnemployment rate for Asian residents 2.6% FemalesUnemployment rate for other race residents 1.6% Males3.3% FemalesUnemployment rate for two or more race residents 1.8% Males0.2% FemalesUnemployment rate for Hispanic or Latino residents 4.0% Males5.2% Females
Year of entry for the foreign-born population in Bozeman, Montana
1,200 2010 or later 672 2000 to 2009 353 1990 to 1999 250 1980 to 1989 85 1970 to 1979 158 Before 1970
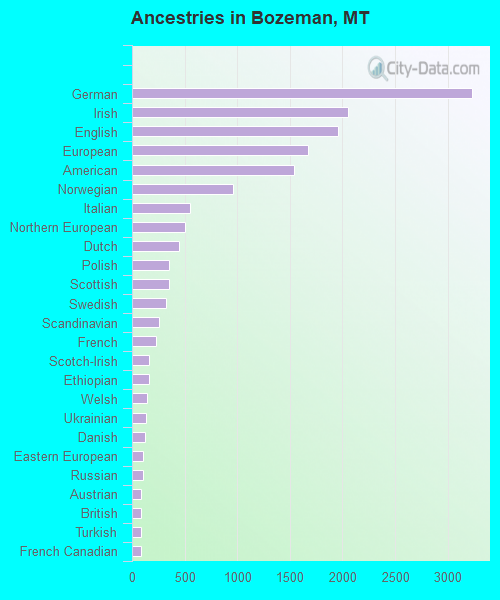
First ancestries reported:
German: 3,231 (16.1%)
Irish: 2,048 (10.2%)
English: 1,956 (9.7%)
European: 1,672 (8.3%)
American: 1,544 (7.7%)
Norwegian: 962 (4.8%)
Italian: 555 (2.8%)
Northern European: 505 (2.5%)
Dutch: 447 (2.2%)
Polish: 350 (1.7%)
Scottish: 348 (1.7%)
Swedish: 325 (1.6%)
Scandinavian: 253 (1.3%)
French: 232 (1.2%)
Scotch-Irish: 165 (0.8%)
Ethiopian: 163 (0.8%)
Welsh: 143 (0.7%)
Ukrainian: 131 (0.7%)
Danish: 128 (0.6%)
Eastern European: 109 (0.5%)
Russian: 102 (0.5%)
Austrian: 90 (0.4%)
British: 90 (0.4%)
Turkish: 90 (0.4%)
French Canadian: 84 (0.4%)
Canadian: 59 (0.3%)
Greek: 59 (0.3%)
Swiss: 57 (0.3%)
Romanian: 56 (0.3%)
Lithuanian: 56 (0.3%)
Croatian: 55 (0.3%)
Czech: 53 (0.3%)
Finnish: 51 (0.3%)
Czechoslovakian: 43 (0.2%)
Cypriot: 36 (0.2%)
Israeli: 32 (0.2%)
Basque: 31 (0.2%)
Hungarian: 27 (0.1%)
Portuguese: 24 (0.1%)
Slovene: 22 (0.1%)
African: 22 (0.1%)
Zimbabwean: 21 (0.1%)
Iranian: 15 (0.07%)
Arab: 15 (0.07%)
Latvian: 14 (0.07%)
Brazilian: 13 (0.06%)
Serbian: 10 (0.05%)
Armenian: 8 (0.04%)
Slovak: 8 (0.04%)
Australian: 3 (0.01%)
Most common places of birth for foreign-born residents (%): China, excluding Hong Kong and Taiwan Bozeman:
12.0% (302)Montana:
4.8% (1,184)
Canada Bozeman:
5.9% (148)Montana:
14.2% (3,503)
Turkey Bozeman:
5.2% (130)Montana:
0.7% (170)
Mexico Bozeman:
5.1% (129)Montana:
10.6% (2,608)
Nepal Bozeman:
4.6% (116)Montana:
0.4% (101)
Poland Bozeman:
4.0% (102)Montana:
0.8% (196)
India Bozeman:
3.7% (93)Montana:
1.7% (415)
Russia Bozeman:
3.6% (92)Montana:
1.7% (425)
Ukraine Bozeman:
3.6% (91)Montana:
2.3% (567)
Ethiopia Bozeman:
3.4% (87)Montana:
0.7% (162)
Sri Lanka Bozeman:
3.2% (80)Montana:
0.7% (182)
United Kingdom, excluding England and Scotland Bozeman:
3.1% (77)Montana:
3.0% (738)
Guyana Bozeman:
3.0% (76)Montana:
0.4% (91)
Germany Bozeman:
2.7% (67)Montana:
9.3% (2,310)
Other Eastern Europe Bozeman:
2.4% (60)Montana:
0.4% (92)
Taiwan Bozeman:
2.3% (57)Montana:
0.8% (204)
Dominican Republic Bozeman:
2.2% (55)Montana:
0.4% (107)
Saudi Arabia Bozeman:
2.2% (55)Montana:
0.9% (231)
United Arab Emirates Bozeman:
2.0% (51)Montana:
0.3% (63)
Israel Bozeman:
1.9% (47)Montana:
0.2% (46)
Philippines Bozeman:
1.9% (47)Montana:
7.0% (1,735)
Italy Bozeman:
1.7% (42)Montana:
0.6% (147)
Tanzania Bozeman:
1.6% (40)Montana:
0.6% (153)
Colombia Bozeman:
1.6% (40)Montana:
1.0% (255)
Place of birth for U.S.-born residents:
This state: 16,796Other state: 35,870Northeast: 4,462Midwest: 9,804South: 5,983West: 15,688 75.3% of Bozeman residents lived in the same house 1 years ago.
Out of people who lived in different houses, 31.4% lived in this county.
Out of people who lived in different counties, 21.0% lived in Montana.
Bozeman:
75.3%State average:
86.7%
Education attainment for males 25 years and older:
No schooling: 2Nursery to 4th grade: 05th and 6th grade: 27th and 8th grade: 269th grade: 15310th grade: 20511th grade: 10012th grade, no diploma: 79High school graduate (or equivalency): 1,735Less than 1 year of college: 706Some college more than 1 year, no degree: 1,873Associate degree: 956Bachelor's degree: 7,162Master's degree: 2,438Professional school degree: 429Doctorate degree: 1,436
Education attainment for females 25 years and older:
No schooling: 3Nursery to 4th grade: 25th and 6th grade: 157th and 8th grade: 1269th grade: 1910th grade: 7111th grade: 19812th grade, no diploma: 84High school graduate (or equivalency): 1,785Less than 1 year of college: 876Some college more than 1 year, no degree: 1,500Associate degree: 1,055Bachelor's degree: 6,264Master's degree: 2,601Professional school degree: 503Doctorate degree: 608
Housing units in structures:
One, detached: 10,849One, attached: 3,658Two: 1,1703 or 4: 2,6585 to 9: 1,97110 to 19: 2,39220 to 49: 1,14250 or more: 1,322Mobile homes: 358Boats, RVs, vans, etc.: 3Housing units lacking complete plumbing facilities in 2022: 0.1%Housing units lacking complete kitchen facilities in 2022: 0.7%House/condo owner moved in on average 8 years ago
Renter moved in on average 2 years ago
Private vs. public school enrollment:
Students in private schools in grades 1 to 8 (elementary and middle school): 742 Students in private schools in grades 9 to 12 (high school): 125 Students in private undergraduate colleges: 685