Bradford, PA (Pennsylvania) Houses and Residents
| Bradford: | $75,647 |
| Pennsylvania: | $245,500 |
Total population: 8,552 (All urban)
Houses: 3,650 (3,228 occupied: 1,865 owner occupied, 1,390 renter occupied)
| % of renters here: | 43% |
| State: | 31% |
Housing density: 1,058 houses/condos per square mile
Median price asked for vacant for-sale houses and condos in 2022: $101,657.
Median contract rent in 2022: $599 (lower quartile is $384, upper quartile is $762)
Median rent asked for vacant for-rent units in 2022: $2,702
Median gross rent in Bradford, PA in 2022: $738
Housing units in Bradford with a mortgage: 906 (117 second mortgage, 0 home equity loan, 86 both second mortgage and home equity loan)
Houses without a mortgage: 21
Median household income for houses/condos with a mortgage: $76,034
Median household income for apartments without a mortgage: $53,832
Median monthly housing costs: $696
Compare current foreclosures near Bradford, PA:
| Photo | Address | Area | Beds / Baths | Price | Details |
|---|---|---|---|---|---|

|
#1
Jackson Ave
Bradford, PA 16701
|
1,754 sq. feet
|
2 baths 4 beds |
show details | |

|
#2
N Nookside Ln
Bradford, PA 16701
|
2,029 sq. feet
|
2 baths 4 beds |
show details | |

|
#3
Pleasant St
Bradford, PA 16701
|
1,664 sq. feet
|
- baths - beds |
show details | |

|
#4
Interstate Pkwy
Bradford, PA 16701
|
1,759 sq. feet
|
- baths - beds |
show details | |

|
#5
Burnside Ave
Bradford, PA 16701
|
1,841 sq. feet
|
- baths - beds |
show details | |

|
#6
S Kendall Ave
Bradford, PA 16701
|
- sq. feet
|
- baths - beds |
show details | |

|
#7
W Green St
Olean, NY 14760
|
1,798 sq. feet
|
1 baths 3 beds |
show details | |

|
#8
Ellicott St
Salamanca, NY 14779
|
1,264 sq. feet
|
2 baths 6 beds |
show details | |

|
#9
N 4th St
Olean, NY 14760
|
1,345 sq. feet
|
1 baths 3 beds |
show details | |

|
#10
Spruce St
Olean, NY 14760
|
1,769 sq. feet
|
2 baths 4 beds |
show details |
| Photo | Address | Area | Beds / Baths | Price | Details |
|---|---|---|---|---|---|

|
#11
E Elm St
Olean, NY 14760
|
1,929 sq. feet
|
2 baths 3 beds |
show details | |

|
#12
Front St
Olean, NY 14760
|
1,169 sq. feet
|
1 baths 2 beds |
show details | |

|
#13
E Water St
Olean, NY 14760
|
1,152 sq. feet
|
1 baths 3 beds |
show details | |

|
#14
S Clinton St
Olean, NY 14760
|
1,650 sq. feet
|
1 baths 3 beds |
show details | |

|
#15
E State St
Olean, NY 14760
|
2,194 sq. feet
|
1 baths 3 beds |
show details | |

|
#16
Orchard Ave
Olean, NY 14760
|
1,908 sq. feet
|
1 baths 3 beds |
show details | |

|
#17
N 4th St
Olean, NY 14760
|
2,016 sq. feet
|
1 baths 3 beds |
show details | |

|
#18
N 6th St
Olean, NY 14760
|
1,084 sq. feet
|
1 baths 3 beds |
show details | |

|
#19
Adams St
Olean, NY 14760
|
1,166 sq. feet
|
1 baths 3 beds |
show details | |

|
#20
S Clinton St
Olean, NY 14760
|
1,374 sq. feet
|
2 baths 3 beds |
show details |
| Photo | Address | Area | Beds / Baths | Price | Details |
|---|---|---|---|---|---|

|
#21
N 8th St
Olean, NY 14760
|
1,116 sq. feet
|
1 baths 2 beds |
show details | |

|
#22
Bishop St
Olean, NY 14760
|
1,232 sq. feet
|
1 baths 3 beds |
show details | |

|
#23
Bradley Dr
Olean, NY 14760
|
2,552 sq. feet
|
2 baths 4 beds |
show details | |

|
#24
Washington St
Olean, NY 14760
|
3,124 sq. feet
|
2 baths 4 beds |
show details | |

|
#25
N 6th St
Olean, NY 14760
|
1,794 sq. feet
|
2 baths 3 beds |
show details | |

|
#26
W Green St
Olean, NY 14760
|
1,568 sq. feet
|
2 baths 3 beds |
show details | |

|
#27
Scenic Dr
Salamanca, NY 14779
|
5,200 sq. feet
|
6 baths 8 beds |
show details | |

|
#28
N 11th St
Olean, NY 14760
|
1,600 sq. feet
|
1 baths 3 beds |
show details | |

|
#29
Irving St
Olean, NY 14760
|
1,332 sq. feet
|
1 baths 3 beds |
show details | |

|
#30
Garden Ave
Olean, NY 14760
|
1,378 sq. feet
|
1 baths 3 beds |
show details |
| Photo | Address | Area | Beds / Baths | Price | Details |
|---|---|---|---|---|---|

|
#31
E Highland Ave
Olean, NY 14760
|
866 sq. feet
|
1 baths 2 beds |
show details | |

|
#32
Garden Ave
Olean, NY 14760
|
1,020 sq. feet
|
1 baths 2 beds |
show details | |

|
#33
Gleason Hollow Rd
Portville, NY 14770
|
576 sq. feet
|
1 baths 1 beds |
show details | |

|
#34
W Bucktooth Run Rd
Little Valley, NY 14755
|
750 sq. feet
|
1 baths 2 beds |
show details | |

|
#35
Union Valley Rd
Olean, NY 14760
|
864 sq. feet
|
1 baths 2 beds |
show details | |

|
#36
N Main St
Portville, NY 14770
|
2,656 sq. feet
|
1 baths 5 beds |
show details | |

|
#37
Back Hinsdale Rd
Olean, NY 14760
|
1,300 sq. feet
|
2 baths 2 beds |
show details | |

|
#38
Woodland Dr
Great Valley, NY 14741
|
1,778 sq. feet
|
2 baths 3 beds |
show details | |

|
#39
Olean Portville Rd
Olean, NY 14760
|
1,680 sq. feet
|
2 baths 3 beds |
show details | |

|
#40
Route 16 N
Olean, NY 14760
|
1,176 sq. feet
|
1 baths 3 beds |
show details |
| Photo | Address | Area | Beds / Baths | Price | Details |
|---|---|---|---|---|---|

|
#41
Bucktooth Run Rd
Little Valley, NY 14755
|
1,680 sq. feet
|
1 baths 3 beds |
show details | |

|
#42
Route 219
Great Valley, NY 14741
|
2,508 sq. feet
|
3 baths 4 beds |
show details | |

|
#43
Hayes Rd
Olean, NY 14760
|
1,188 sq. feet
|
1 baths 2 beds |
show details | |

|
#44
Olean Portville Rd
Olean, NY 14760
|
1,161 sq. feet
|
1 baths 3 beds |
show details | |

|
#45
Seneca Ave
Olean, NY 14760
|
1,707 sq. feet
|
1 baths 2 beds |
show details | |

|
#46
E Highland Ave
Olean, NY 14760
|
880 sq. feet
|
1 baths 3 beds |
show details | |

|
#47
Brook St
Olean, NY 14760
|
1,104 sq. feet
|
1 baths 3 beds |
show details | |

|
#48
Hamilton Ave
Olean, NY 14760
|
1,468 sq. feet
|
1 baths 3 beds |
show details | |

|
#49
Front Ave
Salamanca, NY 14779
|
2,088 sq. feet
|
3 baths 3 beds |
show details | |

|
Check over 1 million property listings on Foreclosure.com!
|
browse all offers | |||

Latest news about housing in Bradford, PA collected exclusively by city-data.com from local newspapers, TV, and radio stations

 | PA Location: Rental Houses, Woods, Many Jobs? (3 replies) |
| Affordable "small" towns with beautiful houses and downtowns? (58 replies) |
| Unicorn house? (10 replies) |
| Replace Bradford White Natural Gas Heater (3 replies) |
| 13,002,700 (47 replies) |
| House Rental - Cranberry/Wexford? (4 replies) |

Median year apartment built: 1947
Household type by relationship:
Households: 7,836- Male householders: 1,468 (425 living alone), Female householders: 1,721 (702 living alone)
1,070 spouses (1,021 opposite-sex spouses), 376 unmarried partners, (350 opposite-sex unmarried partners), 2,024 children (1,638 natural, 116 adopted, 268 stepchildren), 100 grandchildren, 50 brothers or sisters, 51 parents, 20 foster children, 46 other relatives, 571 non-relatives
- In group quarters: 332
Size of family households: 758 2-persons, 418 3-persons, 174 4-persons, 308 5-persons, 38 6-persons, 51 7-or-more-persons.
Size of nonfamily households: 1,164 1-person, 336 2-persons, 1 3-persons, 9 4-persons, 9 7-or-more-persons.
926 married couples with children.
586 single-parent households (346 men, 240 women).
97.1% of residents of Bradford speak English at home.
1.2% of residents speak Spanish at home (20% speak English very well, 13% speak English well, 68% speak English not well).
0.6% of residents speak other Indo-European language at home (84% speak English very well, 16% speak English not well).
0.3% of residents speak Asian or Pacific Island language at home (8% speak English very well, 92% speak English not well).
0.1% of residents speak other language at home (100% speak English very well).
Foreign born population: 185 (2.4%)
(28.6% of them are naturalized citizens)
| Here: | 7.2 |
| State: | 6.8 |
| Here: | 4.8 |
| State: | 4.3 |
- Bedrooms in owner-occupied houses and condos in Bradford, Pennsylvania
- 0no bedroom
- 111 bedroom
- 4372 bedrooms
- 7483 bedrooms
- 4944 bedrooms
- 1745+ bedrooms
- Bedrooms in renter-occupied apartments in Bradford, Pennsylvania
- 121no bedroom
- 3901 bedroom
- 4382 bedrooms
- 3403 bedrooms
- 504 bedrooms
- 505+ bedrooms
- Cars and other vehicles available in Bradford in owner-occupied houses/condos
- 96no vehicle
- 7661 vehicle
- 8062 vehicles
- 1903 vehicles
- 84 vehicles
- 05+ vehicles
- Cars and other vehicles available in Bradford in renter-occupied apartments
- 562no vehicle
- 6741 vehicle
- 1262 vehicles
- 293 vehicles
- 04 vehicles
- 05+ vehicles
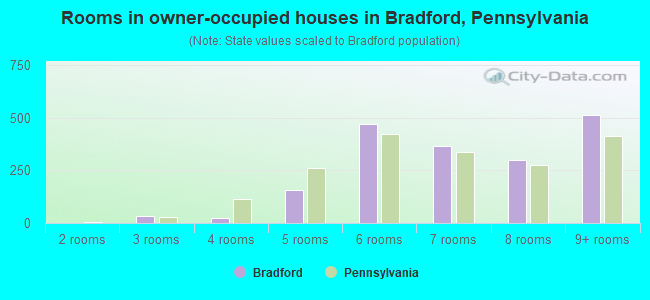
- Rooms in owner-occupied houses in Bradford, Pennsylvania
- 01 room
- 02 rooms
- 353 rooms
- 254 rooms
- 1555 rooms
- 4726 rooms
- 3667 rooms
- 2998 rooms
- 5149+ rooms
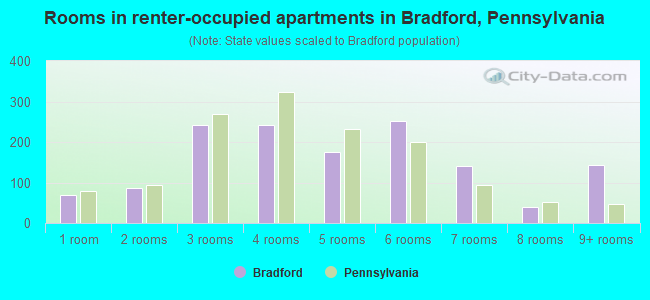
- Rooms in renter-occupied apartments in Bradford, Pennsylvania
- 681 room
- 872 rooms
- 2433 rooms
- 2414 rooms
- 1765 rooms
- 2526 rooms
- 1417 rooms
- 408 rooms
- 1449+ rooms
Bradford, PA household income distribution

- 343Less than $10,000
- 480$10,000 to $19,999
- 369$20,000 to $29,999
- 309$30,000 to $39,999
- 170$40,000 to $49,999
- 356$50,000 to $59,999
- 379$60,000 to $74,999
- 293$75,000 to $99,999
- 277$100,000 to $124,999
- 110$125,000 to $149,999
- 111$150,000 to $199,999
- 96$200,000 or more
Home value of owner - occupied houses in 2022 in Bradford, PA
-
- 40Less than $10,000
- 39$10,000 to $14,999
- 75$20,000 to $24,999
- 16$25,000 to $29,999
- 110$30,000 to $34,999
- 39$35,000 to $39,999
- 91$40,000 to $49,999
- 216$50,000 to $59,999
- 266$60,000 to $69,999
- 131$70,000 to $79,999
- 119$80,000 to $89,999
- 80$90,000 to $99,999
- 113$100,000 to $124,999
- 75$125,000 to $149,999
- 56$150,000 to $174,999
- 44$175,000 to $199,999
- 141$200,000 to $249,999
- 29$250,000 to $299,999
- 17$300,000 to $399,999
- 23$750,000 to $999,999
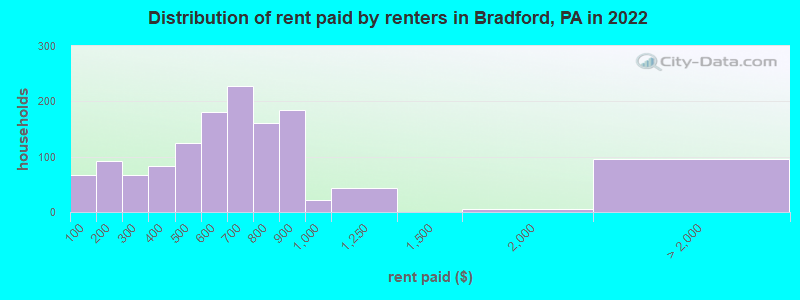
Rent paid by renters in 2022 in Bradford, PA
-
- 66Less than $100
- 83$100 to $149
- 9$150 to $199
- 67$250 to $299
- 29$300 to $349
- 55$350 to $399
- 36$400 to $449
- 87$450 to $499
- 112$500 to $549
- 66$550 to $599
- 54$600 to $649
- 172$650 to $699
- 127$700 to $749
- 33$750 to $799
- 185$800 to $899
- 22$900 to $999
- 42$1,000 to $1,249
- 5$1,500 to $1,999
- 94No cash rent
Percentage of workers working in this county: 88.5%
Number of people working at home: 136 (4.3% of all workers)
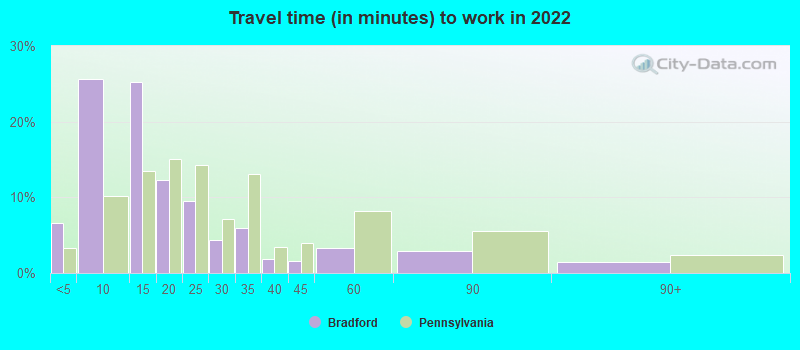
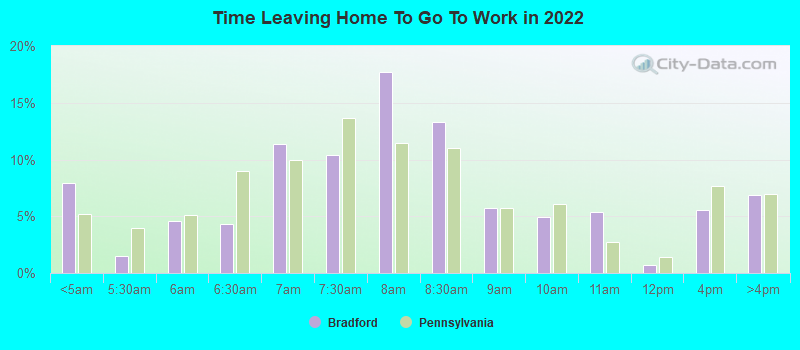
Travel time to work (commute)
- Less than 5 minutes: 248
- 5 to 9 minutes: 1,100
- 10 to 14 minutes: 733
- 15 to 19 minutes: 345
- 20 to 24 minutes: 158
- 25 to 29 minutes: 157
- 30 to 34 minutes: 88
- 35 to 39 minutes: 61
- 40 to 44 minutes: 0
- 45 to 59 minutes: 39
- 60 to 89 minutes: 31
- 90 or more minutes: 44
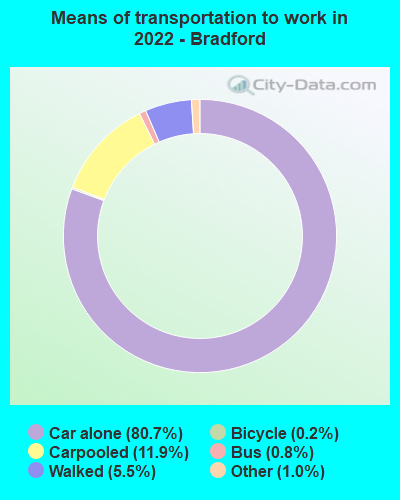
Means of transportation to work:
- Drove a car alone: 4,003 (76.5%)
- Carpooled: 587 (11.2%)
- Bus: 29 (0.6%)
- Taxi: 56 (1.1%)
- Bicycle: 13 (0.2%)
- Walked: 273 (5.2%)
- Worked at home: 136 (2.6%)
- Unemployment by race in 2022
- Unemployment rate for White non-Hispanic residents
- 7.4%Males
- 0.9%Females
- Unemployment rate for two or more race residents
- 10.8%Males
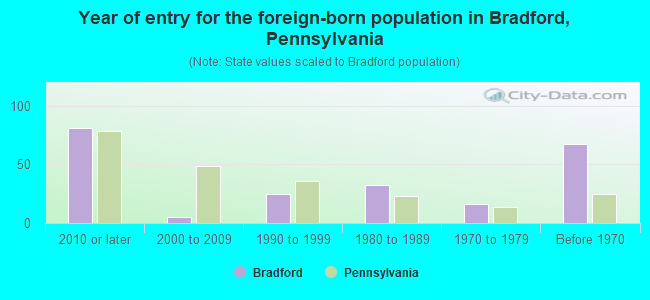
- Year of entry for the foreign-born population in Bradford, Pennsylvania
- 812010 or later
- 52000 to 2009
- 241990 to 1999
- 321980 to 1989
- 161970 to 1979
- 67Before 1970
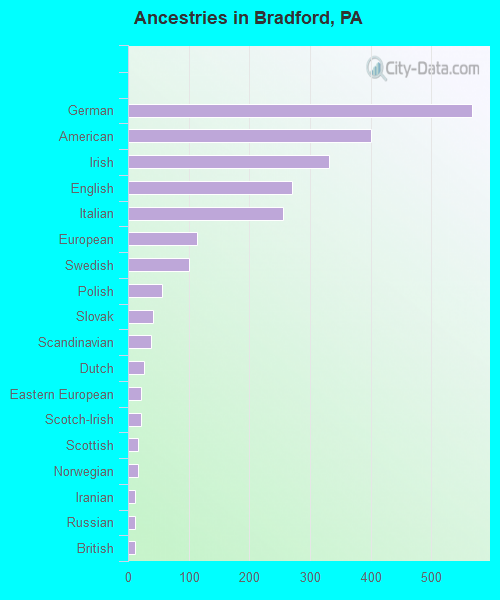
First ancestries reported:
- German: 567 (19.4%)
- American: 401 (13.7%)
- Irish: 332 (11.4%)
- English: 271 (9.3%)
- Italian: 256 (8.8%)
- European: 113 (3.9%)
- Swedish: 101 (3.5%)
- Polish: 56 (1.9%)
- Slovak: 42 (1.4%)
- Scandinavian: 38 (1.3%)
- Dutch: 27 (0.9%)
- Eastern European: 22 (0.8%)
- Scotch-Irish: 22 (0.8%)
- Scottish: 17 (0.6%)
- Norwegian: 16 (0.5%)
- Iranian: 12 (0.4%)
- Russian: 12 (0.4%)
- British: 11 (0.4%)
- Pennsylvania German: 5 (0.2%)
- African: 3 (0.1%)
- Yugoslavian: 2 (0.07%)
Most common places of birth for foreign-born residents (%):
| Bradford: | 29.7% (55) |
| Pennsylvania: | 0.8% (7,727) |
| Bradford: | 28.6% (53) |
| Pennsylvania: | 5.8% (54,190) |
| Bradford: | 21.1% (39) |
| Pennsylvania: | 7.2% (67,704) |
| Bradford: | 7.6% (14) |
| Pennsylvania: | 0.4% (4,204) |
| Bradford: | 5.4% (10) |
| Pennsylvania: | 0.6% (6,036) |
| Bradford: | 4.9% (9) |
| Pennsylvania: | 0.5% (4,658) |
| Bradford: | 4.3% (8) |
| Pennsylvania: | 1.8% (17,032) |
| Bradford: | 2.2% (4) |
| Pennsylvania: | 1.9% (18,065) |
Place of birth for U.S.-born residents:
- This state: 5,412
- Other state: 2,242
- Northeast: 1,452
- Midwest: 225
- South: 379
- West: 185
84.5% of Bradford residents lived in the same house 1 years ago.
Out of people who lived in different houses, 43.9% lived in this county.
Out of people who lived in different counties, 45.0% lived in Pennsylvania.
| Bradford: | 84.5% |
| State average: | 89.3% |
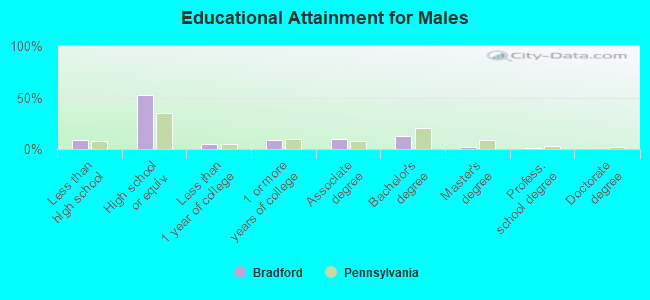
Education attainment for males 25 years and older:
- No schooling: 37
- Nursery to 4th grade: 32
- 5th and 6th grade: 60
- 7th and 8th grade: 42
- 9th grade: 19
- 10th grade: 0
- 11th grade: 28
- 12th grade, no diploma: 11
- High school graduate (or equivalency): 1,386
- Less than 1 year of college: 123
- Some college more than 1 year, no degree: 237
- Associate degree: 262
- Bachelor's degree: 328
- Master's degree: 54
- Professional school degree: 24
- Doctorate degree: 12
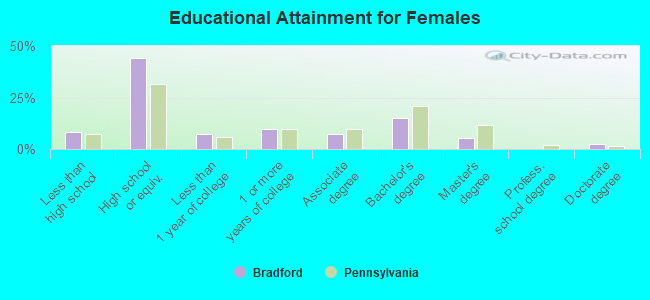
Education attainment for females 25 years and older:
- No schooling: 67
- Nursery to 4th grade: 0
- 5th and 6th grade: 0
- 7th and 8th grade: 23
- 9th grade: 23
- 10th grade: 74
- 11th grade: 44
- 12th grade, no diploma: 10
- High school graduate (or equivalency): 1,267
- Less than 1 year of college: 205
- Some college more than 1 year, no degree: 275
- Associate degree: 207
- Bachelor's degree: 430
- Master's degree: 156
- Professional school degree: 0
- Doctorate degree: 75


Housing units in structures:
- One, detached: 2,670
- One, attached: 26
- Two: 373
- 3 or 4: 234
- 5 to 9: 80
- 10 to 19: 27
- 20 to 49: 67
- 50 or more: 169
Housing units lacking complete kitchen facilities in 2022: 2.5%
House/condo owner moved in on average 17 years ago
Renter moved in on average 3 years ago
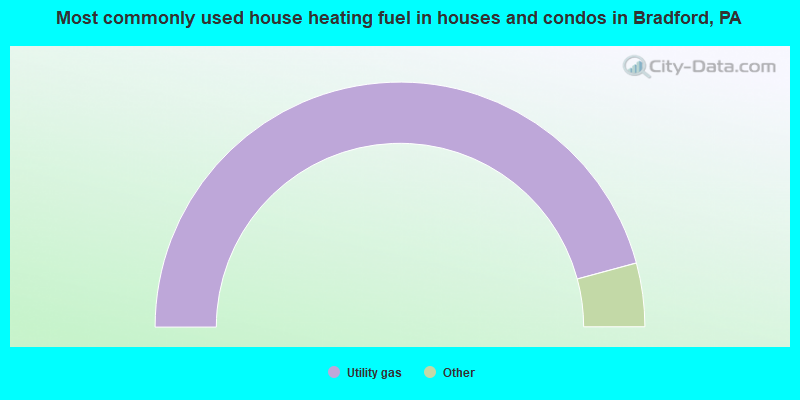
- 91.6%Utility gas
- 3.9%Electricity
- 1.6%Fuel oil, kerosene, etc.
- 1.3%Bottled, tank, or LP gas
- 1.1%Other fuel
- 0.5%Coal or coke
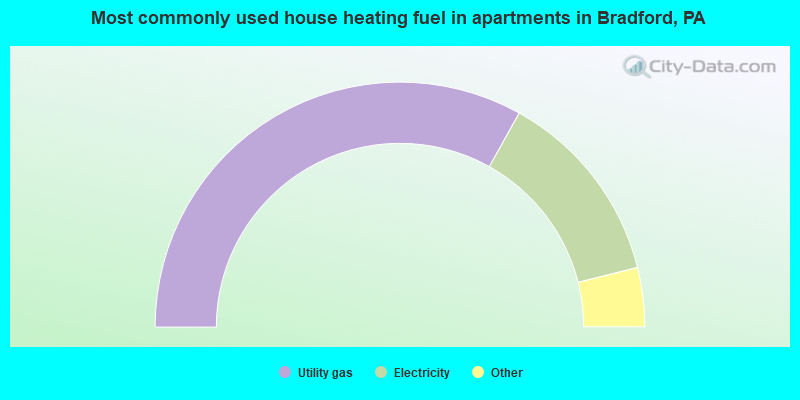
- 66.2%Utility gas
- 26.0%Electricity
- 3.9%Bottled, tank, or LP gas
- 2.0%Other fuel
- 1.9%No fuel used
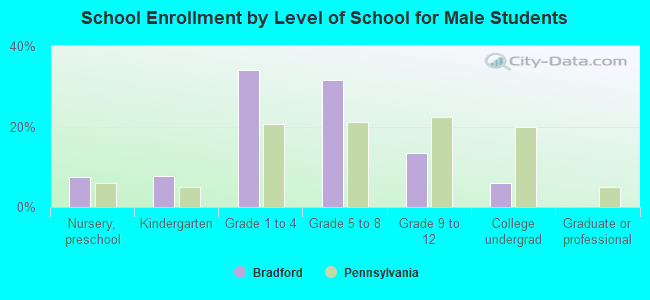
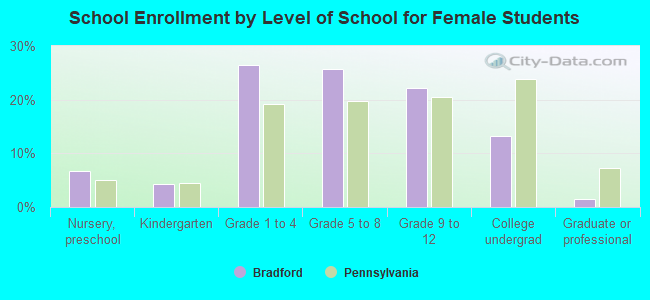
Private vs. public school enrollment:
| Here: | 12.7% |
| Pennsylvania: | 15.7% |
| Here: | 4.2% |
| Pennsylvania: | 13.4% |
| Here: | 58.2% |
| Pennsylvania: | 39.8% |