Brentwood, CA (California) Houses and Residents
| Brentwood: | $874,500 |
| California: | $715,900 |
Total population: 57,019 (Urban population: 23,238, Rural population: 46 (all nonfarm))
Houses: 22,034 (21,698 occupied: 16,970 owner occupied, 4,728 renter occupied)
| % of renters here: | 22% |
| State: | 44% |
Housing density: 1,892 houses/condos per square mile
Median price asked for vacant for-sale houses and condos in 2022: $322,155.
Median contract rent in 2022: over $2,000 (lower quartile is $1,820, upper quartile is over $2,000)
Median rent asked for vacant for-rent units in 2022: $2,243
Median gross rent in Brentwood, CA in 2022: over $2,000
Housing units in Brentwood with a mortgage: 12,206 (1,662 second mortgage, 0 home equity loan, 1,662 both second mortgage and home equity loan)
Houses without a mortgage: 139
Median household income for houses/condos with a mortgage: $196,911
Median household income for apartments without a mortgage: $76,669
Median monthly housing costs: $2,709
Compare current foreclosures in Brentwood, CA:
| Photo | Address | Area | Beds / Baths | Price | Details |
|---|---|---|---|---|---|

|
#1
Mendota St
Brentwood, CA 94513
|
2,485 sq. feet
|
3 baths 4 beds |
show details | |

|
#2
Fitzgerald Way
Brentwood, CA 94513
|
4,631 sq. feet
|
3 baths 6 beds |
show details | |

|
#3
Sycamore Ave
Brentwood, CA 94513
|
1,667 sq. feet
|
2 baths 3 beds |
show details | |

|
#4
Emory Oak Ct
Brentwood, CA 94513
|
2,936 sq. feet
|
3 baths 4 beds |
show details | |

|
#5
Moreau Way
Brentwood, CA 94513
|
3,302 sq. feet
|
3 baths 5 beds |
show details | |

|
#6
Fitzgerald Way
Brentwood, CA 94513
|
4,631 sq. feet
|
3 baths 6 beds |
show details | |

|
#7
Maggiore Ct
Brentwood, CA 94513
|
2,748 sq. feet
|
3 baths 4 beds |
show details | |

|
#8
Maggiore Ct
Brentwood, CA 94513
|
2,748 sq. feet
|
3 baths 4 beds |
show details | |

|
#9
Madrone Pl
Brentwood, CA 94513
|
2,811 sq. feet
|
3 baths 5 beds |
show details | |

|
#10
Emerald Bay Dr
Brentwood, CA 94513
|
3,542 sq. feet
|
3 baths 5 beds |
show details |
| Photo | Address | Area | Beds / Baths | Price | Details |
|---|---|---|---|---|---|

|
#11
Apple Hill Dr
Brentwood, CA 94513
|
1,328 sq. feet
|
2 baths 3 beds |
show details | |

|
#12
San Marino Ln
Brentwood, CA 94513
|
2,651 sq. feet
|
2 baths 4 beds |
show details | |

|
#13
Cinnabar Hills Ct
Brentwood, CA 94513
|
3,375 sq. feet
|
3 baths 4 beds |
show details | |

|
#14
Dawnview Dr
Brentwood, CA 94513
|
3,161 sq. feet
|
3 baths 4 beds |
show details | |

|
#15
Knights Bridge Ct
Brentwood, CA 94513
|
2,023 sq. feet
|
3 baths 4 beds |
show details | |

|
#16
Sunflower Ln
Brentwood, CA 94513
|
2,504 sq. feet
|
3 baths 5 beds |
show details | |

|
#17
Alder Creek Way
Brentwood, CA 94513
|
2,138 sq. feet
|
3 baths 3 beds |
show details | |

|
#18
Amberleaf Way
Brentwood, CA 94513
|
1,648 sq. feet
|
2 baths 3 beds |
show details | |

|
#19
Twilight Ct
Brentwood, CA 94513
|
1,943 sq. feet
|
2 baths 4 beds |
show details | |

|
#20
Spruce St
Brentwood, CA 94513
|
2,651 sq. feet
|
2 baths 5 beds |
show details |
| Photo | Address | Area | Beds / Baths | Price | Details |
|---|---|---|---|---|---|

|
#21
Antelope Ter
Brentwood, CA 94513
|
1,534 sq. feet
|
4 baths 4 beds |
show details | |

|
#22
Wright Ct
Brentwood, CA 94513
|
1,420 sq. feet
|
2 baths 3 beds |
show details | |

|
#23
Caribou Ter
Brentwood, CA 94513
|
1,531 sq. feet
|
2 baths 3 beds |
show details | |

|
#24
Crescent Dr
Brentwood, CA 94513
|
2,213 sq. feet
|
3 baths 4 beds |
show details | |

|
#25
Valley Green Dr
Brentwood, CA 94513
|
1,795 sq. feet
|
2 baths 3 beds |
show details | |

|
#26
Cloverleaf Cir
Brentwood, CA 94513
|
1,680 sq. feet
|
2 baths 4 beds |
show details | |

|
#27
Sawyer Way
Brentwood, CA 94513
|
2,133 sq. feet
|
2 baths 3 beds |
show details | |

|
#28
Tricia St
Brentwood, CA 94513
|
1,209 sq. feet
|
1 baths 4 beds |
show details | |

|
#29
Jubilee Dr
Brentwood, CA 94513
|
2,310 sq. feet
|
2 baths 4 beds |
show details | |

|
#30
Europena Dr
Brentwood, CA 94513
|
3,125 sq. feet
|
3 baths 5 beds |
show details |
| Photo | Address | Area | Beds / Baths | Price | Details |
|---|---|---|---|---|---|

|
#31
Elberta Pkwy
Brentwood, CA 94513
|
2,178 sq. feet
|
3 baths 3 beds |
show details | |

|
#32
Margaret Ln
Brentwood, CA 94513
|
2,615 sq. feet
|
2 baths 4 beds |
show details | |

|
#33
Pimento Dr
Brentwood, CA 94513
|
2,689 sq. feet
|
2 baths 4 beds |
show details | |

|
#34
Dawnview Dr
Brentwood, CA 94513
|
2,540 sq. feet
|
3 baths 4 beds |
show details | |

|
#35
Mandarin Ct
Brentwood, CA 94513
|
1,506 sq. feet
|
2 baths 4 beds |
show details | |

|
#36
Finn Way
Brentwood, CA 94513
|
2,456 sq. feet
|
2 baths 4 beds |
show details | |

|
#37
Jasmine Pl
Brentwood, CA 94513
|
2,810 sq. feet
|
3 baths 5 beds |
show details | |

|
#38
Cashew Pl
Brentwood, CA 94513
|
2,660 sq. feet
|
2 baths 4 beds |
show details | |

|
#39
Concord Ave
Brentwood, CA 94513
|
2,021 sq. feet
|
2 baths 3 beds |
show details | |

|
#40
Christenson St
Brentwood, CA 94513
|
- sq. feet
|
- baths - beds |
show details |
| Photo | Address | Area | Beds / Baths | Price | Details |
|---|---|---|---|---|---|

|
#41
Rice St
Brentwood, CA 94513
|
- sq. feet
|
- baths - beds |
show details | |

|
#42
Tulare St
Brentwood, CA 94513
|
- sq. feet
|
- baths - beds |
show details | |

|
#43
Cakebread Pl
Brentwood, CA 94513
|
- sq. feet
|
- baths - beds |
show details | |

|
#44
Acero Ct
Brentwood, CA 94513
|
- sq. feet
|
- baths - beds |
show details | |

|
#45
Arbor Ct
Brentwood, CA 94513
|
- sq. feet
|
- baths - beds |
show details | |

|
#46
Snapdragon Ct
Brentwood, CA 94513
|
- sq. feet
|
- baths - beds |
show details | |

|
#47
Balfour Rd Ste D
Brentwood, CA 94513
|
- sq. feet
|
- baths - beds |
show details | |

|
#48
Volpaia Ct
Brentwood, CA 94513
|
- sq. feet
|
- baths - beds |
show details | |

|
#49
Diamond Springs Ln
Brentwood, CA 94513
|
- sq. feet
|
- baths - beds |
show details | |

|
Check over 1 million property listings on Foreclosure.com!
|
browse all offers | |||

Latest news about housing in Brentwood, CA collected exclusively by city-data.com from local newspapers, TV, and radio stations

 | LeBron James' $21-million Brentwood estate vandalized with racial slur (108 replies) |
| LeBron James snags another Brentwood home for $23M (16 replies) |
| Los Feliz vs Brentwood (18 replies) |
| Pleasant Hill or Brentwood (25 replies) |
| moving to LA..... question(s) about Brentwood (11 replies) |
| Brentwood -- what's that ditch south of Montana Ave? (9 replies) |

Median year apartment built: 1997
Household type by relationship:
Households: 66,120- Male householders: 10,970 (1,332 living alone), Female householders: 10,728 (1,960 living alone)
14,150 spouses (13,874 opposite-sex spouses), 1,433 unmarried partners, (1,433 opposite-sex unmarried partners), 24,940 children (23,342 natural, 723 adopted, 875 stepchildren), 224 grandchildren, 391 brothers or sisters, 1,727 parents, 0 foster children, 480 other relatives, 878 non-relatives
- In group quarters: 199
Size of family households: 5,639 2-persons, 4,079 3-persons, 4,725 4-persons, 2,186 5-persons, 878 6-persons, 413 7-or-more-persons.
Size of nonfamily households: 3,292 1-person, 486 2-persons.
13,242 married couples with children.
4,710 single-parent households (1,030 men, 3,680 women).
70.5% of residents of Brentwood speak English at home.
13.7% of residents speak Spanish at home (68% speak English very well, 19% speak English well, 11% speak English not well, 2% don't speak English at all).
4.3% of residents speak other Indo-European language at home (73% speak English very well, 18% speak English well, 9% speak English not well, 1% don't speak English at all).
9.2% of residents speak Asian or Pacific Island language at home (60% speak English very well, 28% speak English well, 9% speak English not well, 2% don't speak English at all).
1.6% of residents speak other language at home (95% speak English very well, 5% speak English well).
Foreign born population: 12,539 (19.0%)
(55.3% of them are naturalized citizens)
| Here: | 7.4 |
| State: | 6.0 |
| Here: | 5.2 |
| State: | 3.9 |

- Bedrooms in owner-occupied houses and condos in Brentwood, California
- 0no bedroom
- 1931 bedroom
- 1,6582 bedrooms
- 4,3853 bedrooms
- 6,9564 bedrooms
- 3,7785+ bedrooms

- Bedrooms in renter-occupied apartments in Brentwood, California
- 269no bedroom
- 3921 bedroom
- 9592 bedrooms
- 1,2423 bedrooms
- 1,3584 bedrooms
- 5085+ bedrooms

- Cars and other vehicles available in Brentwood in owner-occupied houses/condos
- 306no vehicle
- 3,8041 vehicle
- 6,8782 vehicles
- 3,2793 vehicles
- 2,2024 vehicles
- 5015+ vehicles

- Cars and other vehicles available in Brentwood in renter-occupied apartments
- 550no vehicle
- 1,2741 vehicle
- 1,2032 vehicles
- 1,3293 vehicles
- 924 vehicles
- 2805+ vehicles

- Rooms in owner-occupied houses in Brentwood, California
- 01 room
- 02 rooms
- 1403 rooms
- 6384 rooms
- 1,7275 rooms
- 3,3546 rooms
- 3,0227 rooms
- 3,6878 rooms
- 4,4029+ rooms

- Rooms in renter-occupied apartments in Brentwood, California
- 2691 room
- 2732 rooms
- 4393 rooms
- 5634 rooms
- 1,1605 rooms
- 2886 rooms
- 7817 rooms
- 4498 rooms
- 5069+ rooms


Brentwood, CA household income distribution

- 963Less than $10,000
- 735$10,000 to $19,999
- 794$20,000 to $29,999
- 271$30,000 to $39,999
- 635$40,000 to $49,999
- 437$50,000 to $59,999
- 2,014$60,000 to $74,999
- 2,935$75,000 to $99,999
- 1,679$100,000 to $124,999
- 1,221$125,000 to $149,999
- 2,945$150,000 to $199,999
- 7,069$200,000 or more

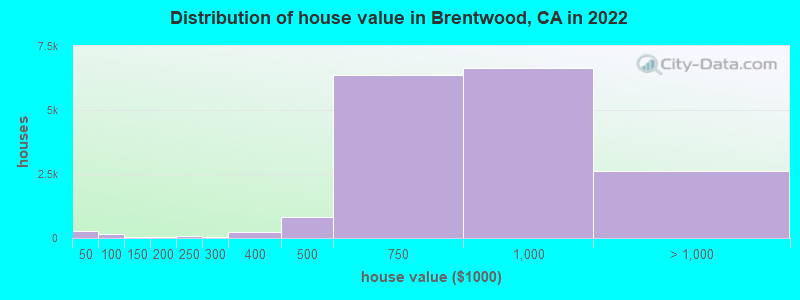
Home value of owner - occupied houses in 2022 in Brentwood, CA
-
- 171Less than $10,000
- 10$10,000 to $14,999
- 7$15,000 to $19,999
- 46$25,000 to $29,999
- 10$30,000 to $34,999
- 16$40,000 to $49,999
- 76$50,000 to $59,999
- 6$60,000 to $69,999
- 30$70,000 to $79,999
- 13$80,000 to $89,999
- 11$100,000 to $124,999
- 17$125,000 to $149,999
- 42$150,000 to $174,999
- 12$175,000 to $199,999
- 66$200,000 to $249,999
- 49$250,000 to $299,999
- 248$300,000 to $399,999
- 804$400,000 to $499,999
- 6,370$500,000 to $749,999
- 6,653$750,000 to $999,999
- 2,162$1,000,000 to $1,499,999
- 208$1,500,000 to $1,999,999
- 250$2,000,000 or more
Rent paid by renters in 2022 in Brentwood, CA
-
- 37Less than $100
- 70$200 to $249
- 82$250 to $299
- 17$400 to $449
- 26$450 to $499
- 42$650 to $699
- 9$800 to $899
- 77$900 to $999
- 199$1,000 to $1,249
- 125$1,250 to $1,499
- 890$1,500 to $1,999
- 483$2,000 to $2,499
- 792$2,500 to $2,999
- 380$3,000 to $3,499
- 233$3,500 or more
- 293No cash rent

Percentage of workers working in this county: 75.1%
Number of people working at home: 4,663 (16.0% of all workers)
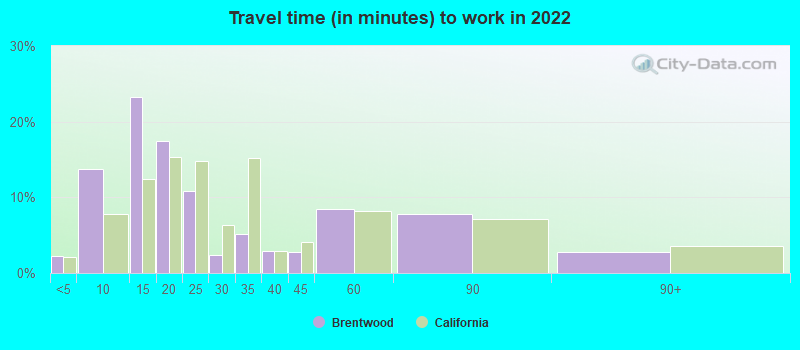
Travel time to work (commute)
- Less than 5 minutes: 784
- 5 to 9 minutes: 2,494
- 10 to 14 minutes: 3,479
- 15 to 19 minutes: 3,162
- 20 to 24 minutes: 1,235
- 25 to 29 minutes: 362
- 30 to 34 minutes: 1,248
- 35 to 39 minutes: 454
- 40 to 44 minutes: 831
- 45 to 59 minutes: 4,398
- 60 to 89 minutes: 3,759
- 90 or more minutes: 1,497
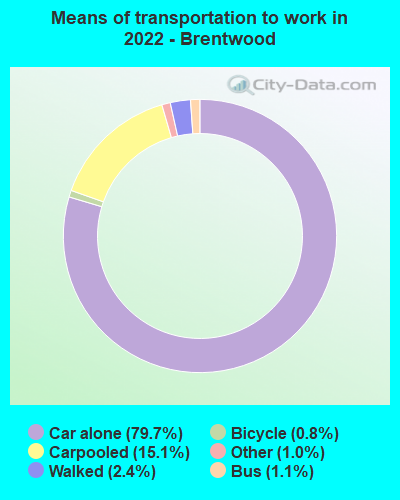
Means of transportation to work:
- Drove a car alone: 12,077 (59.8%)
- Carpooled: 2,565 (12.7%)
- Bus: 127 (0.6%)
- Taxi: 158 (0.8%)
- Bicycle: 86 (0.4%)
- Walked: 509 (2.5%)
- Worked at home: 4,663 (23.1%)
- Unemployment by race in 2022
- Unemployment rate for White non-Hispanic residents
- 1.7%Males
- 2.0%Females
- Unemployment rate for Black residents
- 6.6%Males
- 0.4%Females
- Unemployment rate for Asian residents
- 3.4%Males
- 6.6%Females
- Unemployment rate for other race residents
- 4.8%Males
- 12.0%Females
- Unemployment rate for two or more race residents
- 6.0%Males
- 1.6%Females
- Unemployment rate for Hispanic or Latino residents
- 4.7%Males
- 4.5%Females

- Year of entry for the foreign-born population in Brentwood, California
- 2,3752010 or later
- 2,9562000 to 2009
- 2,4291990 to 1999
- 9601980 to 1989
- 5991970 to 1979
- 602Before 1970

First ancestries reported:
- European: 1,406 (4.3%)
- English: 1,343 (4.1%)
- Irish: 1,323 (4.0%)
- German: 1,313 (4.0%)
- African: 732 (2.2%)
- American: 653 (2.0%)
- Italian: 608 (1.9%)
- Portuguese: 549 (1.7%)
- Scottish: 342 (1.0%)
- Scotch-Irish: 324 (1.0%)
- Norwegian: 279 (0.9%)
- Welsh: 251 (0.8%)
- British: 248 (0.8%)
- Polish: 221 (0.7%)
- Afghan: 194 (0.6%)
- Iranian: 180 (0.5%)
- Brazilian: 164 (0.5%)
- Haitian: 163 (0.5%)
- Nigerian: 141 (0.4%)
- Ghanaian: 137 (0.4%)
- Turkish: 134 (0.4%)
- French: 124 (0.4%)
- Russian: 106 (0.3%)
- Eastern European: 89 (0.3%)
- Yugoslavian: 88 (0.3%)
- Ethiopian: 87 (0.3%)
- Greek: 80 (0.2%)
- Dutch: 76 (0.2%)
- Armenian: 57 (0.2%)
- Finnish: 56 (0.2%)
- French Canadian: 50 (0.2%)
- Swedish: 48 (0.1%)
- Scandinavian: 45 (0.1%)
- Romanian: 32 (0.10%)
- Hungarian: 29 (0.09%)
- Cajun: 29 (0.09%)
- Palestinian: 28 (0.09%)
- Slovak: 28 (0.09%)
- Canadian: 26 (0.08%)
- Swiss: 26 (0.08%)
- Moroccan: 25 (0.08%)
- Jamaican: 21 (0.06%)
- Danish: 19 (0.06%)
- Ukrainian: 18 (0.05%)
- Israeli: 17 (0.05%)
- Basque: 16 (0.05%)
- Croatian: 15 (0.05%)
- Egyptian: 10 (0.03%)
- Lithuanian: 10 (0.03%)
- Northern European: 10 (0.03%)
- Austrian: 9 (0.03%)
- Czechoslovakian: 8 (0.02%)
- Trinidadian and Tobagonian: 6 (0.02%)
- Icelander: 5 (0.02%)
Most common places of birth for foreign-born residents (%):
| Brentwood: | 20.1% (2,178) |
| California: | 37.2% (3,881,193) |
| Brentwood: | 20.1% (2,176) |
| California: | 7.8% (818,297) |
| Brentwood: | 10.1% (1,093) |
| California: | 6.6% (684,672) |
| Brentwood: | 5.7% (615) |
| California: | 5.2% (539,184) |
| Brentwood: | 3.9% (423) |
| California: | 0.5% (53,260) |
| Brentwood: | 2.9% (309) |
| California: | 0.7% (74,025) |
| Brentwood: | 2.8% (305) |
| California: | 0.1% (8,814) |
| Brentwood: | 2.2% (237) |
| California: | 0.6% (58,161) |
| Brentwood: | 2.2% (236) |
| California: | 2.0% (206,004) |
| Brentwood: | 2.1% (232) |
| California: | 4.2% (440,287) |
| Brentwood: | 2.0% (216) |
| California: | 1.7% (176,274) |
| Brentwood: | 2.0% (215) |
| California: | 0.5% (53,222) |
| Brentwood: | 2.0% (213) |
| California: | 3.0% (315,248) |
| Brentwood: | 1.8% (200) |
| California: | 1.2% (127,477) |
| Brentwood: | 1.7% (179) |
| California: | 4.9% (512,335) |
| Brentwood: | 1.6% (170) |
| California: | 0.1% (5,330) |
Place of birth for U.S.-born residents:
- This state: 44,029
- Other state: 8,753
- Northeast: 1,934
- Midwest: 2,292
- South: 2,726
- West: 1,801
89.6% of Brentwood residents lived in the same house 1 years ago.
Out of people who lived in different houses, 39.4% lived in this county.
Out of people who lived in different counties, 84.0% lived in California.
| Brentwood: | 89.6% |
| State average: | 88.9% |
Education attainment for males 25 years and older:
- No schooling: 451
- Nursery to 4th grade: 213
- 5th and 6th grade: 187
- 7th and 8th grade: 335
- 9th grade: 332
- 10th grade: 177
- 11th grade: 136
- 12th grade, no diploma: 204
- High school graduate (or equivalency): 4,729
- Less than 1 year of college: 1,933
- Some college more than 1 year, no degree: 2,954
- Associate degree: 1,166
- Bachelor's degree: 5,651
- Master's degree: 1,093
- Professional school degree: 717
- Doctorate degree: 167

Education attainment for females 25 years and older:
- No schooling: 507
- Nursery to 4th grade: 200
- 5th and 6th grade: 0
- 7th and 8th grade: 0
- 9th grade: 0
- 10th grade: 296
- 11th grade: 61
- 12th grade, no diploma: 409
- High school graduate (or equivalency): 3,881
- Less than 1 year of college: 1,690
- Some college more than 1 year, no degree: 3,121
- Associate degree: 2,823
- Bachelor's degree: 6,044
- Master's degree: 2,002
- Professional school degree: 315
- Doctorate degree: 196


Housing units in structures:
- One, detached: 19,565
- One, attached: 614
- Two: 117
- 3 or 4: 221
- 5 to 9: 183
- 10 to 19: 157
- 20 to 49: 144
- 50 or more: 524
- Mobile homes: 214
Median worth of mobile homes: $165,942
Housing units lacking complete kitchen facilities in 2022: 2.2%
House/condo owner moved in on average 8 years ago
Renter moved in on average 3 years ago

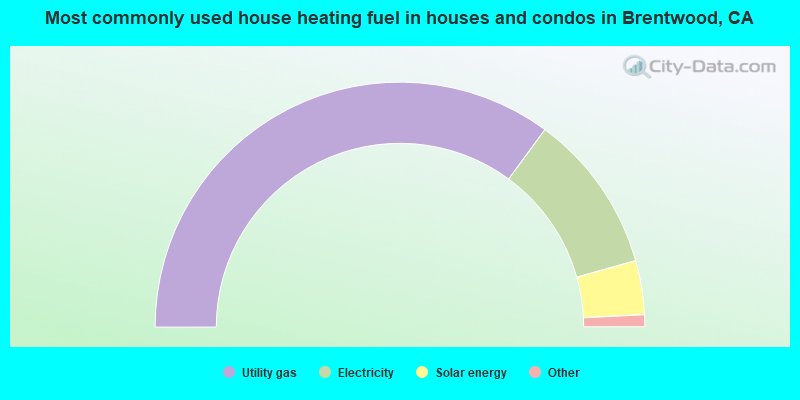
- 70.1%Utility gas
- 21.1%Electricity
- 7.1%Solar energy
- 0.8%No fuel used
- 0.5%Wood
- 0.3%Bottled, tank, or LP gas
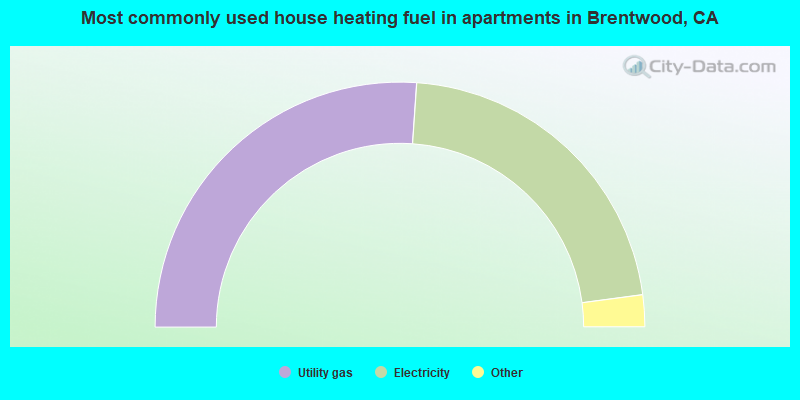
- 52.2%Utility gas
- 43.6%Electricity
- 1.6%Solar energy
- 1.1%No fuel used
- 1.0%Bottled, tank, or LP gas
- 0.4%Other fuel
Private vs. public school enrollment:
| Here: | 6.7% |
| California: | 10.5% |
| Here: | 8.3% |
| California: | 8.5% |
| Here: | 18.1% |
| California: | 15.9% |


