Bridgeport, CT (Connecticut) Houses and Residents
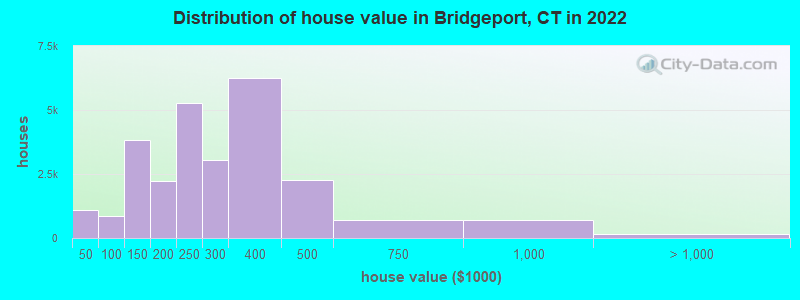
Estimated median house or condo value in 2022: $249,200 (it was $107,700 in 2000 )
Bridgeport:
$249,200Connecticut:
$347,200
Lower value quartile - upper value quartile: $161,200 - $355,800Mean price in 2022: Detached houses: $249,412 Here:
$249,412State:
$503,946
Townhouses or other attached units: $164,488 Here:
$164,488State:
$304,959
In 2-unit structures: $240,586 Here:
$240,586State:
$304,133
In 3-to-4-unit structures: $264,198 Here:
$264,198State:
$272,970
In 5-or-more-unit structures: $114,271 Here:
$114,271State:
$249,308
Total population: 147,612 (Urban population: 139,529, Rural population: 0)
Houses: 60,711 (56,960 occupied: 26,447 owner occupied, 30,513 renter occupied )
% of renters here:
54%State:
34%
Housing density: 3,795 houses/condos per square mile
Median price asked for vacant for-sale houses and condos in 2022: $411,931.
Median contract rent in 2022: $1,162 (lower quartile is $786, upper quartile is $1,559)
Median rent asked for vacant for-rent units in 2022: $546
Median gross rent in Bridgeport, CT in 2022: $1,457
Housing units in Bridgeport with a mortgage: 14,698 (590 second mortgage, 0 home equity loan, 409 both second mortgage and home equity loan )Houses without a mortgage: 343
Median household income for houses/condos with a mortgage: $80,540
Median household income for apartments without a mortgage: $47,865
Median monthly housing costs: $1,415
Data:
Median house or condo value ($)
Median house or condo value ($ change since 2000)
Median house or condo value ($) - White
Median house or condo value ($) - Black or African American
Median house or condo value ($) - Asian
Median house or condo value ($) - Hispanic or Latino
Median house or condo value ($) - American Indian and Alaska Native
Median house or condo value ($) - Multirace
Median house or condo value ($) - Other Race
Median price asked for mobile homes ($)
Household density (households per square mile)
Mean house or condo value by units in structure - 1, detached ($)
Mean house or condo value by units in structure - 1, attached ($)
Mean house or condo value by units in structure - 2 ($)
Mean house or condo value by units in structure by units in structure - 3 or 4 ($)
Mean house or condo value by units in structure - 5 or more ($)
Mean house or condo value by units in structure - Boat, RV, van, etc. ($)
Mean house or condo value by units in structure - Mobile home ($)
Median contract rent ($)
Median contract rent - Lower quartile ($)
Median contract rent - Upper quartile ($)
Median gross rent ($)
Urban houses (%)
Rural houses (%)
Houses occupied (%)
Houses occupied (% change since 2000)
Houses owner occupied (%)
Houses owner occupied (% change since 2000)
Houses renter occupied (%)
Houses renter occupied (% change since 2000)
Vacant housing units - For rent (%)
Vacant housing units - For rent (% change since 2000)
Vacant housing units - For sale only (%)
Vacant housing units - For sale only (% change since 2000)
Vacant housing units - Rented or sold, not occupied (%)
Vacant housing units - Rented or sold, not occupied (% change since 2000)
Vacant housing units - For seasonal, recreational, or occasional use (%)
Vacant housing units - For seasonal, recreational, or occasional use (% change since 2000)
Vacant housing units - For migrant workers (%)
Vacant housing units - For migrant workers (% change since 2000)
Vacant housing units - Other vacant (%)
Vacant housing units - Other vacant (% change since 2000)
Median monthly housing costs ($)
Median household income for houses/condos with a mortgage ($)
Median household income for houses/condos without a mortgage ($)
Median household income ($)
Median household income ($) - White
Median household income ($) - Black or African American
Median household income ($) - Asian
Median household income ($) - Hispanic or Latino
Median household income ($) - American Indian and Alaska Native
Median household income ($) - Multirace
Median household income ($) - Other Race
Mortgage status - with mortgage (%)
Mortgage status - with second mortgage (%)
Mortgage status - with home equity loan (%)
Mortgage status - with both second mortgage and home equity loan (%)
Mortgage status - without a mortgage (%)
Median year house/condo built
Median year apartment built
Household type by relationship - Male householder living alone (%)
Household type by relationship - Male householder not living alone (%)
Household type by relationship - Female householder living alone (%)
Household type by relationship - Female householder not living alone (%)
Household type by relationship - Opposite-Sex spouse (%)
Household type by relationship - Same-Sex spouse (%)
Household type by relationship - Opposite-Sex unmarried partner (%)
Household type by relationship - Same-Sex unmarried partner (%)
Household type by relationship - In group quarters (%)
Size of family households - 2-person household (%)
Size of family households - 3-person household (%)
Size of family households - 4-person household (%)
Size of family households - 5-person household (%)
Size of family households - 6-person household (%)
Size of family households - 7-or-more-person household (%)
Size of nonfamily households - 1-person household (%)
Size of nonfamily households - 2-person household (%)
Size of nonfamily households - 3-person household (%)
Size of nonfamily households - 4-person household (%)
Size of nonfamily households - 5-person household (%)
Size of nonfamily households - 6-person household (%)
Size of nonfamily households - 7-or-moreperson household (%)
Year house built - Built 2010 or later (%)
Year house built - Built 2000 to 2009 (%)
Year house built - Built 1990 to 1999 (%)
Year house built - Built 1980 to 1989 (%)
Year house built - Built 1970 to 1979 (%)
Year house built - Built 1960 to 1969 (%)
Year house built - Built 1950 to 1959 (%)
Year house built - Built 1940 to 1949 (%)
Year house built - Built 1939 or earlier (%)
Median number of rooms in houses and condos
Median number of rooms in apartments
Median number of bedrooms in owner occupied houses
Mean number of bedrooms in owner occupied houses
Median number of bedrooms in renter occupied houses
Mean number of bedrooms in renter occupied houses
Median number of vehichles in owner occupied houses
Mean number of vehichles in owner occupied houses
Median number of vehichles in renter occupied houses
Mean number of vehichles in renter occupied houses
Rooms in owner-occupied houses - 1 room (%)
Rooms in owner-occupied houses - 2 rooms (%)
Rooms in owner-occupied houses - 3 rooms (%)
Rooms in owner-occupied houses - 4 rooms (%)
Rooms in owner-occupied houses - 5 rooms (%)
Rooms in owner-occupied houses - 6 rooms (%)
Rooms in owner-occupied houses - 7 rooms (%)
Rooms in owner-occupied houses - 8 rooms (%)
Rooms in owner-occupied houses - 9+ rooms (%)
Rooms in renter-occupied houses - 1 room (%)
Rooms in renter-occupied houses - 2 rooms (%)
Rooms in renter-occupied houses - 3 rooms (%)
Rooms in renter-occupied houses - 4 rooms (%)
Rooms in renter-occupied houses - 5 rooms (%)
Rooms in renter-occupied houses - 6 rooms (%)
Rooms in renter-occupied houses - 7 rooms (%)
Rooms in renter-occupied houses - 8 rooms (%)
Rooms in renter-occupied houses - 9+ rooms (%)
Bedrooms in owner-occupied houses - no bedrooms (%)
Bedrooms in owner-occupied houses - 1 bedroom (%)
Bedrooms in owner-occupied houses - 2 bedrooms (%)
Bedrooms in owner-occupied houses - 3 bedrooms (%)
Bedrooms in owner-occupied houses - 4 bedrooms (%)
Bedrooms in owner-occupied houses - 5+ bedrooms (%)
Bedrooms in renter-occupied houses - no bedrooms (%)
Bedrooms in renter-occupied houses - 1 bedroom (%)
Bedrooms in renter-occupied houses - 2 bedrooms (%)
Bedrooms in renter-occupied houses - 3 bedrooms (%)
Bedrooms in renter-occupied houses - 4 bedrooms (%)
Bedrooms in renter-occupied houses - 5+ bedrooms (%)
Vehicles available in owner-occupied houses - no vehicle available (%)
Vehicles available in owner-occupied houses - 1 vehicle available(%)
Vehicles available in owner-occupied houses - 2 Vehicles available (%)
Vehicles available in owner-occupied houses - 3 Vehicles available (%)
Vehicles available in owner-occupied houses - 4 Vehicles available (%)
Vehicles available in owner-occupied houses - 5+ Vehicles available (%)
Vehicles available in renter-occupied houses - no vehicle available (%)
Vehicles available in renter-occupied houses - 1 vehicle available (%)
Vehicles available in renter-occupied houses - 2 Vehicles available (%)
Vehicles available in renter-occupied houses - 3 Vehicles available (%)
Vehicles available in renter-occupied houses - 4 Vehicles available (%)
Vehicles available in renter-occupied houses - 5+ Vehicles available (%)
Housing units in structures - 1, detached (%)
Housing units in structures - 1, attached (%)
Housing units in structures - 2 (%)
Housing units in structures - 3 or 4 (%)
Housing units in structures - 5 to 9 (%)
Housing units in structures - 10 to 19 (%)
Housing units in structures - 20 to 49 (%)
Housing units in structures - 50 or more (%)
Housing units in structures - Mobile home (%)
Housing units in structures - Boat, RV, van, etc. (%)
Housing units in structures - Owners - 1, detached (%)
Housing units in structures - Owners - 1, attached (%)
Housing units in structures - Owners - 2 (%)
Housing units in structures - Owners - 3 or 4 (%)
Housing units in structures - Owners - 5 to 9 (%)
Housing units in structures - Owners - 10 to 19 (%)
Housing units in structures - Owners - 20 to 49 (%)
Housing units in structures - Owners - 50 or more (%)
Housing units in structures - Owners - Mobile home (%)
Housing units in structures - Owners - Boat, RV, van, etc. (%)
Housing units in structures - Renters - 1, detached (%)
Housing units in structures - Renters - 1, attached (%)
Housing units in structures - Renters - 2 (%)
Housing units in structures - Renters - 3 or 4 (%)
Housing units in structures - Renters - 5 to 9 (%)
Housing units in structures - Renters - 10 to 19 (%)
Housing units in structures - Renters - 20 to 49 (%)
Housing units in structures - Renters - 50 or more (%)
Housing units in structures - Renters - Mobile home (%)
Housing units in structures - Renters - Boat, RV, van, etc. (%)
House/condo owner moved in on average (years ago)
Renter moved in on average (years ago)
Year householder moved into unit - Moved in 1999 to March 2000 (%)
Year householder moved into unit - Moved in 1999 to March 2000 (%) - White
Year householder moved into unit - Moved in 1999 to March 2000 (%) - Black or African American
Year householder moved into unit - Moved in 1999 to March 2000 (%) - Asian
Year householder moved into unit - Moved in 1999 to March 2000 (%) - Hispanic or Latino
Year householder moved into unit - Moved in 1999 to March 2000 (%) - American Indian and Alaska Native
Year householder moved into unit - Moved in 1999 to March 2000 (%) - Multirace
Year householder moved into unit - Moved in 1999 to March 2000 (%) - Other Race
Year householder moved into unit - Moved in 1995 to 1998 (%)
Year householder moved into unit - Moved in 1995 to 1998 (%) - White
Year householder moved into unit - Moved in 1995 to 1998 (%) - Black or African American
Year householder moved into unit - Moved in 1995 to 1998 (%) - Asian
Year householder moved into unit - Moved in 1995 to 1998 (%) - Hispanic or Latino
Year householder moved into unit - Moved in 1995 to 1998 (%) - American Indian and Alaska Native
Year householder moved into unit - Moved in 1995 to 1998 (%) - Multirace
Year householder moved into unit - Moved in 1995 to 1998 (%) - Other Race
Year householder moved into unit - Moved in 1990 to 1994 (%)
Year householder moved into unit - Moved in 1990 to 1994 (%) - White
Year householder moved into unit - Moved in 1990 to 1994 (%) - Black or African American
Year householder moved into unit - Moved in 1990 to 1994 (%) - Asian
Year householder moved into unit - Moved in 1990 to 1994 (%) - Hispanic or Latino
Year householder moved into unit - Moved in 1990 to 1994 (%) - American Indian and Alaska Native
Year householder moved into unit - Moved in 1990 to 1994 (%) - Multirace
Year householder moved into unit - Moved in 1990 to 1994 (%) - Other Race
Year householder moved into unit - Moved in 1980 to 1989 (%)
Year householder moved into unit - Moved in 1980 to 1989 (%) - White
Year householder moved into unit - Moved in 1980 to 1989 (%) - Black or African American
Year householder moved into unit - Moved in 1980 to 1989 (%) - Asian
Year householder moved into unit - Moved in 1980 to 1989 (%) - Hispanic or Latino
Year householder moved into unit - Moved in 1980 to 1989 (%) - American Indian and Alaska Native
Year householder moved into unit - Moved in 1980 to 1989 (%) - Multirace
Year householder moved into unit - Moved in 1980 to 1989 (%) - Other Race
Year householder moved into unit - Moved in 1970 to 1979 (%)
Year householder moved into unit - Moved in 1970 to 1979 (%) - White
Year householder moved into unit - Moved in 1970 to 1979 (%) - Black or African American
Year householder moved into unit - Moved in 1970 to 1979 (%) - Asian
Year householder moved into unit - Moved in 1970 to 1979 (%) - Hispanic or Latino
Year householder moved into unit - Moved in 1970 to 1979 (%) - American Indian and Alaska Native
Year householder moved into unit - Moved in 1970 to 1979 (%) - Multirace
Year householder moved into unit - Moved in 1970 to 1979 (%) - Other Race
Year householder moved into unit - Moved in 1969 or earlier (%)
Year householder moved into unit - Moved in 1969 or earlier (%) - White
Year householder moved into unit - Moved in 1969 or earlier (%) - Black or African American
Year householder moved into unit - Moved in 1969 or earlier (%) - Asian
Year householder moved into unit - Moved in 1969 or earlier (%) - Hispanic or Latino
Year householder moved into unit - Moved in 1969 or earlier (%) - American Indian and Alaska Native
Year householder moved into unit - Moved in 1969 or earlier (%) - Multirace
Year householder moved into unit - Moved in 1969 or earlier (%) - Other Race
Housing units lacking complete plumbing facilities (%)
Housing units lacking complete kitchen facilities (%)
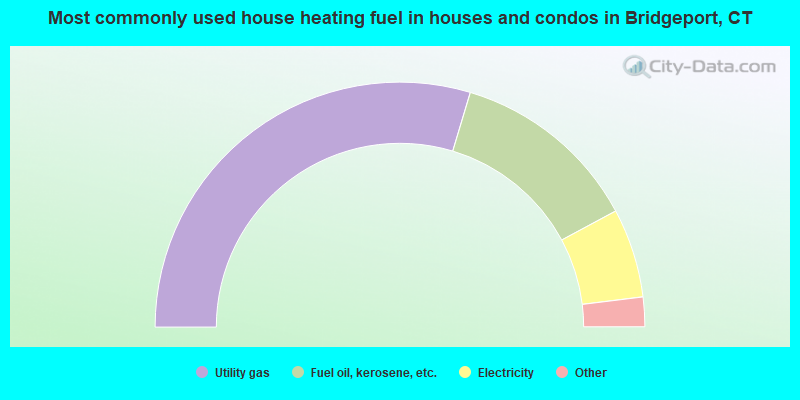
House heating fuel used in houses and condos - Utility gas (%)
House heating fuel used in houses and condos - Bottled, tank, or LP gas (%)
House heating fuel used in houses and condos - Electricity (%)
House heating fuel used in houses and condos - Fuel oil, kerosene, etc. (%)
House heating fuel used in houses and condos - Coal or coke (%)
House heating fuel used in houses and condos - Wood (%)
House heating fuel used in houses and condos - Solar energy (%)
House heating fuel used in houses and condos - Other fuel (%)
House heating fuel used in houses and condos - No fuel used (%)
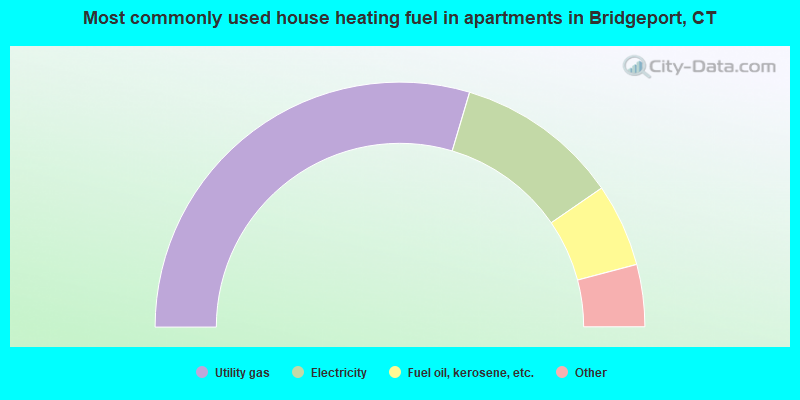
House heating fuel used in apartments - Utility gas (%)
House heating fuel used in apartments - Bottled, tank, or LP gas (%)
House heating fuel used in apartments - Electricity (%)
House heating fuel used in apartments - Fuel oil, kerosene, etc. (%)
House heating fuel used in apartments - Coal or coke (%)
House heating fuel used in apartments - Wood (%)
House heating fuel used in apartments - Solar energy (%)
House heating fuel used in apartments - Other fuel (%)
House heating fuel used in apartments - No fuel used (%)
Latest news about housing in Bridgeport, CT collected exclusively by city-data.com from local newspapers, TV, and radio stations
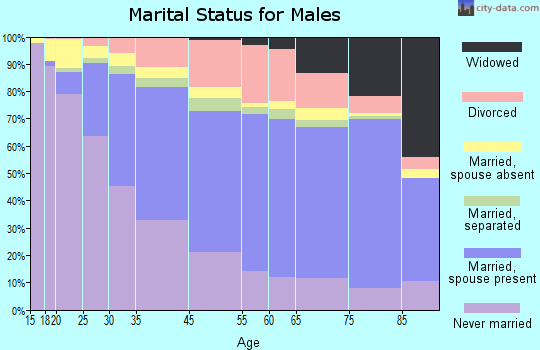
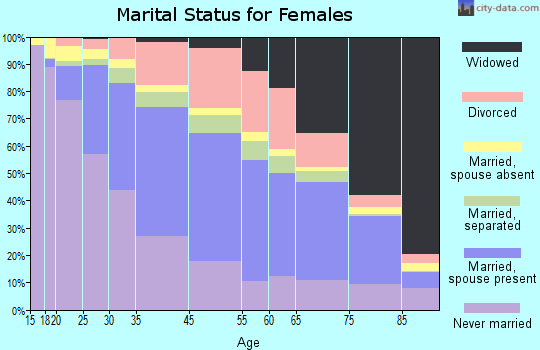
Median year house/condo built: 1954Median year apartment built: 1958Household type by relationship:
Households: 148,365
Male householders: 27,806 (12,761 living alone ), Female householders: 29,154 (10,901 living alone )18,137 spouses (17,847 opposite-sex spouses ), 4,844 unmarried partners , (4,844 opposite-sex unmarried partners ), 48,124 children (45,306 natural , 59 adopted , 2,759 stepchildren ), 2,525 grandchildren , 1,844 brothers or sisters , 3,784 parents , 0 foster children , 3,975 other relatives , 3,883 non-relatives In group quarters: 4,289
Size of family households: 11,093 2-persons , 7,350 3-persons , 6,061 4-persons , 4,077 5-persons , 1,705 6-persons , 398 7-or-more-persons .
Size of nonfamily households: 23,662 1-person , 2,353 2-persons , 116 3-persons , 85 4-persons , 60 7-or-more-persons .
12,689 married couples with children. single-parent households (4,996 men , 9,682 women ).
52.9% of residents of Bridgeport speak English at home. of residents speak Spanish at home (60% speak English very well , 19% speak English well , 16% speak English not well , 5% don't speak English at all ).of residents speak other Indo-European language at home (54% speak English very well , 26% speak English well , 15% speak English not well , 6% don't speak English at all ).of residents speak Asian or Pacific Island language at home (42% speak English very well , 28% speak English well , 30% speak English not well ).of residents speak other language at home (48% speak English very well , 31% speak English well , 20% speak English not well ).
Foreign born population: 45,202 (30.5%)of them are naturalized citizens )
Median number of rooms in houses and condos:
Median number of rooms in apartments
Owner-occupied Renter-occupied
Bedrooms in owner-occupied houses and condos in Bridgeport, Connecticut
213 no bedroom 1,651 1 bedroom 11,119 2 bedrooms 9,486 3 bedrooms 3,024 4 bedrooms 954 5+ bedrooms
Bedrooms in renter-occupied apartments in Bridgeport, Connecticut
2,307 no bedroom 7,777 1 bedroom 11,743 2 bedrooms 6,944 3 bedrooms 1,005 4 bedrooms 737 5+ bedrooms
Owner-occupied Renter-occupied
Rooms in owner-occupied houses in Bridgeport, Connecticut
213 1 room 186 2 rooms 518 3 rooms 6,689 4 rooms 8,039 5 rooms 4,223 6 rooms 3,052 7 rooms 1,693 8 rooms 1,834 9+ rooms
Rooms in renter-occupied apartments in Bridgeport, Connecticut
2,052 1 room 2,847 2 rooms 6,697 3 rooms 6,544 4 rooms 6,484 5 rooms 3,174 6 rooms 1,715 7 rooms 589 8 rooms 411 9+ rooms
Bridgeport, CT household income distribution 7,278 Less than $10,0006,897 $10,000 to $19,9995,401 $20,000 to $29,9995,538 $30,000 to $39,9993,144 $40,000 to $49,9995,731 $50,000 to $59,9993,754 $60,000 to $74,9996,883 $75,000 to $99,9995,049 $100,000 to $124,9991,803 $125,000 to $149,9993,233 $150,000 to $199,9992,249 $200,000 or more
Home value of owner - occupied houses in 2022 in Bridgeport, CT 388 Less than $10,00024 $15,000 to $19,999103 $20,000 to $24,999547 $30,000 to $34,99938 $35,000 to $39,999234 $60,000 to $69,999227 $70,000 to $79,999185 $80,000 to $89,999214 $90,000 to $99,9993,035 $100,000 to $124,999790 $125,000 to $149,9991,840 $150,000 to $174,999400 $175,000 to $199,9995,284 $200,000 to $249,9993,036 $250,000 to $299,9996,255 $300,000 to $399,9992,279 $400,000 to $499,999702 $500,000 to $749,999717 $750,000 to $999,999104 $1,000,000 to $1,499,99945 $2,000,000 or moreRent paid by renters in 2022 in Bridgeport, CT 193 Less than $100738 $100 to $149818 $150 to $199628 $200 to $2491,031 $250 to $299481 $300 to $349257 $350 to $399214 $400 to $449140 $450 to $499674 $500 to $549352 $550 to $599556 $600 to $649536 $650 to $699275 $700 to $749484 $750 to $7992,036 $800 to $8991,372 $900 to $9995,718 $1,000 to $1,2494,418 $1,250 to $1,4996,889 $1,500 to $1,999928 $2,000 to $2,499221 $2,500 to $2,99925 $3,500 or more1,529 No cash rent
Percentage of workers working in this county: 59.2%Number of people working at home: 5,100 (7.7% of all workers )
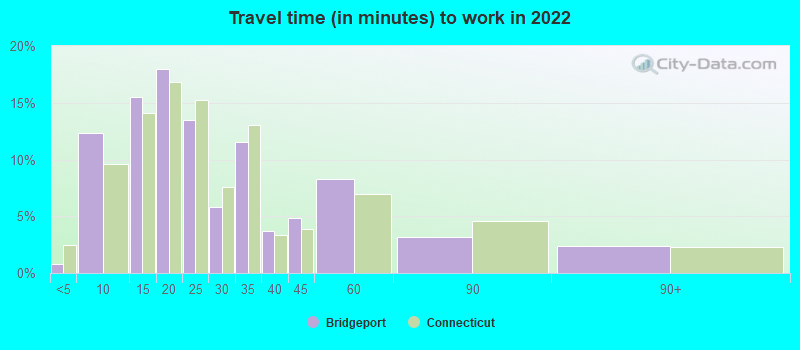
Travel time to work (commute)
Less than 5 minutes: 8575 to 9 minutes: 5,52810 to 14 minutes: 9,32515 to 19 minutes: 8,63320 to 24 minutes: 9,59125 to 29 minutes: 2,27130 to 34 minutes: 9,02135 to 39 minutes: 96640 to 44 minutes: 2,87145 to 59 minutes: 5,91060 to 89 minutes: 3,44090 or more minutes: 2,604
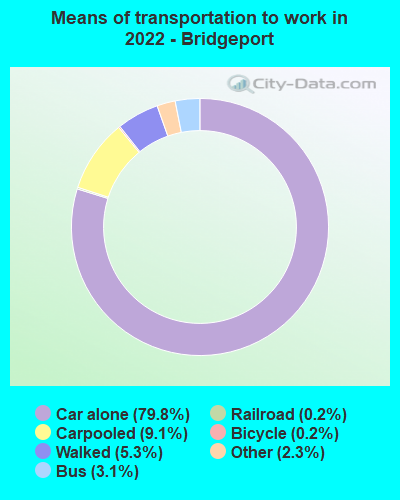
Means of transportation to work:
Drove a car alone: 31,725 (70.7%)Carpooled: 3,612 (8.0%)Bus : 1,246 (2.8%)Long-distance train or commuter rail : 24 (0.1%)Light rail, streetcar or trolley : 64 (0.1%)Taxi: 899 (2.0%)Bicycle: 91 (0.2%)Walked: 2,114 (4.7%)Worked at home: 5,100 (11.4%)
Unemployment by race in 2022
Unemployment rate for White non-Hispanic residents 6.2% Males1.9% FemalesUnemployment rate for Black residents 16.5% Males12.6% FemalesUnemployment rate for American Indian and Alaska Native residents 17.4% FemalesUnemployment rate for Asian residents 9.6% Males8.6% FemalesUnemployment rate for other race residents 15.4% Males4.0% FemalesUnemployment rate for two or more race residents 7.6% Males3.6% FemalesUnemployment rate for Hispanic or Latino residents 12.9% Males5.0% Females
Year of entry for the foreign-born population in Bridgeport, Connecticut
16,158 2010 or later 11,801 2000 to 2009 7,584 1990 to 1999 7,954 1980 to 1989 3,806 1970 to 1979 3,602 Before 1970
First ancestries reported:
Jamaican: 5,743 (6.2%)
Brazilian: 5,505 (6.0%)
Italian: 5,272 (5.7%)
American: 2,997 (3.2%)
Haitian: 2,459 (2.7%)
Irish: 2,418 (2.6%)
Portuguese: 2,322 (2.5%)
Polish: 1,446 (1.6%)
English: 989 (1.1%)
Greek: 951 (1.0%)
German: 831 (0.9%)
Hungarian: 615 (0.7%)
Cape Verdean: 577 (0.6%)
Russian: 491 (0.5%)
Ghanaian: 422 (0.5%)
French: 405 (0.4%)
Slovak: 404 (0.4%)
Ukrainian: 394 (0.4%)
European: 371 (0.4%)
Arab: 358 (0.4%)
Afghan: 320 (0.3%)
African: 317 (0.3%)
Nigerian: 254 (0.3%)
Lebanese: 249 (0.3%)
Swedish: 239 (0.3%)
Lithuanian: 220 (0.2%)
Eastern European: 198 (0.2%)
Bahamian: 195 (0.2%)
Romanian: 177 (0.2%)
Guyanese: 168 (0.2%)
Scottish: 167 (0.2%)
French Canadian: 164 (0.2%)
British West Indian: 157 (0.2%)
Croatian: 121 (0.1%)
Trinidadian and Tobagonian: 105 (0.1%)
Syrian: 100 (0.1%)
West Indian: 96 (0.1%)
Albanian: 82 (0.09%)
Canadian: 78 (0.08%)
Austrian: 74 (0.08%)
Danish: 73 (0.08%)
Czechoslovakian: 73 (0.08%)
Barbadian: 66 (0.07%)
Czech: 63 (0.07%)
Ethiopian: 62 (0.07%)
Belizean: 60 (0.06%)
Dutch: 56 (0.06%)
Turkish: 53 (0.06%)
Northern European: 50 (0.05%)
Zimbabwean: 48 (0.05%)
Egyptian: 39 (0.04%)
Scotch-Irish: 32 (0.03%)
British: 29 (0.03%)
Jordanian: 29 (0.03%)
Welsh: 27 (0.03%)
Latvian: 26 (0.03%)
Liberian: 23 (0.02%)
Moroccan: 22 (0.02%)
Kenyan: 16 (0.02%)
Slavic: 15 (0.02%)
Armenian: 11 (0.01%)
Norwegian: 10 (0.01%)
Sierra Leonean: 9 (0.01%)
Most common places of birth for foreign-born residents (%): Jamaica Bridgeport:
12.8% (6,253)Connecticut:
7.5% (40,568)
Brazil Bridgeport:
12.4% (6,078)Connecticut:
4.7% (25,461)
Dominican Republic Bridgeport:
9.2% (4,506)Connecticut:
5.0% (27,361)
Mexico Bridgeport:
6.3% (3,073)Connecticut:
4.8% (25,802)
Ecuador Bridgeport:
4.7% (2,294)Connecticut:
4.4% (24,026)
Haiti Bridgeport:
3.6% (1,775)Connecticut:
2.4% (12,881)
Colombia Bridgeport:
3.3% (1,628)Connecticut:
3.3% (18,124)
Portugal Bridgeport:
3.2% (1,555)Connecticut:
1.7% (9,214)
Honduras Bridgeport:
3.1% (1,510)Connecticut:
1.3% (7,220)
El Salvador Bridgeport:
3.0% (1,473)Connecticut:
1.1% (6,024)
Guatemala Bridgeport:
2.8% (1,369)Connecticut:
3.2% (17,617)
Vietnam Bridgeport:
2.5% (1,229)Connecticut:
1.2% (6,448)
Pakistan Bridgeport:
2.5% (1,198)Connecticut:
1.3% (7,003)
China, excluding Hong Kong and Taiwan Bridgeport:
2.0% (1,001)Connecticut:
4.4% (24,001)
Bangladesh Bridgeport:
1.9% (937)Connecticut:
0.6% (3,362)
India Bridgeport:
1.8% (856)Connecticut:
7.3% (39,879)
Cabo Verde Bridgeport:
1.6% (786)Connecticut:
0.2% (1,253)
Peru Bridgeport:
1.6% (771)Connecticut:
2.5% (13,591)
Place of birth for U.S.-born residents:
This state: 58,056Other state: 33,206Northeast: 24,461Midwest: 2,316South: 5,380West: 1,049 86.9% of Bridgeport residents lived in the same house 1 years ago.
Out of people who lived in different houses, 35.0% lived in this county.
Out of people who lived in different counties, 32.4% lived in Connecticut.
Bridgeport:
86.9%State average:
88.4%
Education attainment for males 25 years and older:
No schooling: 3,526Nursery to 4th grade: 4075th and 6th grade: 6497th and 8th grade: 1,6359th grade: 1,39710th grade: 75211th grade: 1,06212th grade, no diploma: 2,178High school graduate (or equivalency): 18,100Less than 1 year of college: 2,500Some college more than 1 year, no degree: 4,301Associate degree: 3,316Bachelor's degree: 5,903Master's degree: 3,337Professional school degree: 647Doctorate degree: 467
Education attainment for females 25 years and older:
No schooling: 1,254Nursery to 4th grade: 9445th and 6th grade: 4357th and 8th grade: 1,0879th grade: 1,09910th grade: 61411th grade: 48512th grade, no diploma: 2,316High school graduate (or equivalency): 16,669Less than 1 year of college: 3,919Some college more than 1 year, no degree: 6,140Associate degree: 4,428Bachelor's degree: 7,213Master's degree: 3,590Professional school degree: 736Doctorate degree: 262
Housing units in structures:
One, detached: 17,848One, attached: 6,920Two: 8,2213 or 4: 10,3135 to 9: 3,20910 to 19: 3,35720 to 49: 3,41150 or more: 7,083Mobile homes: 226Boats, RVs, vans, etc.: 123Median worth of mobile homes: $331,900
Housing units lacking complete plumbing facilities in 2022: 1.1%Housing units lacking complete kitchen facilities in 2022: 1.9%House/condo owner moved in on average 15 years ago
Renter moved in on average 4 years ago
Private vs. public school enrollment:
Students in private schools in grades 1 to 8 (elementary and middle school): 1,201 Here:
8.5%Connecticut:
9.5%
Students in private schools in grades 9 to 12 (high school): 1,271 Here:
16.6%Connecticut:
12.9%
Students in private undergraduate colleges: 5,625 Here:
52.1%Connecticut:
35.5%