Burlington, IA (Iowa) Houses and Residents
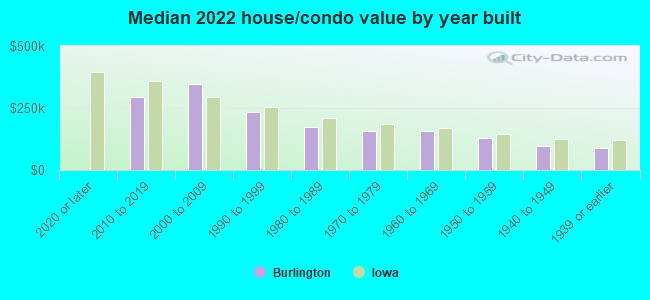
| Burlington: | $119,589 |
| Iowa: | $194,600 |
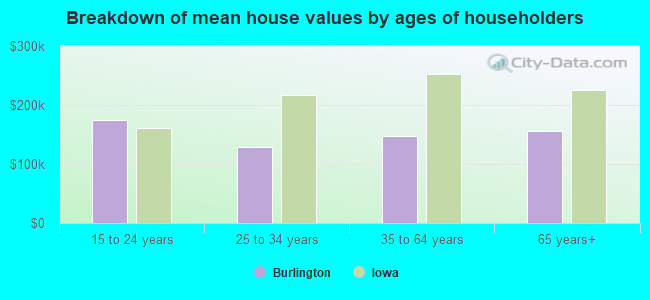
Mean price in 2022:
Detached houses: $145,594
Here: $145,594 State: $245,224 Townhouses or other attached units: $225,304
Here: $225,304 State: $238,767 In 2-unit structures: $245,139
Here: $245,139 State: $243,070 In 3-to-4-unit structures: $144,974
Here: $144,974 State: $162,139 In 5-or-more-unit structures: $181,013
Here: $181,013 State: $190,519 Mobile homes: $181,553
Here: $181,553 State: $51,271
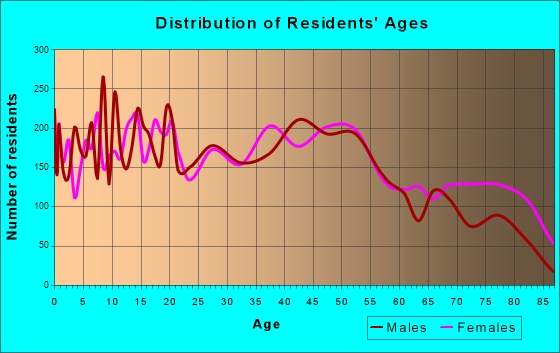
Total population: 25,539 (All urban)
Houses: 12,594 (11,376 occupied: 7,726 owner occupied, 3,835 renter occupied)
| % of renters here: | 33% |
| State: | 28% |
Housing density: 896 houses/condos per square mile
Median price asked for vacant for-sale houses and condos in 2022: $145,368.
Median contract rent in 2022: $640 (lower quartile is $458, upper quartile is $773)
Median rent asked for vacant for-rent units in 2022: $630
Median gross rent in Burlington, IA in 2022: $879
Housing units in Burlington with a mortgage: 4,111 (265 second mortgage, 33 home equity loan, 190 both second mortgage and home equity loan)
Houses without a mortgage: 35
Median household income for houses/condos with a mortgage: $77,231
Median household income for apartments without a mortgage: $48,436
Median monthly housing costs: $871
Compare current foreclosures near Burlington, IA:
| Photo | Address | Area | Beds / Baths | Price | Details |
|---|---|---|---|---|---|

|
#1
Sycamore St
Burlington, IA 52601
|
1,475 sq. feet
|
1 baths 3 beds |
$24,900
|
show details |

|
#2
S 10th St
Burlington, IA 52601
|
- sq. feet
|
- baths - beds |
$19,900
|
show details |

|
#3
S 10th St
Burlington, IA 52601
|
1,987 sq. feet
|
2 baths 5 beds |
show details | |

|
#4
Summer St
Burlington, IA 52601
|
1,432 sq. feet
|
1 baths 3 beds |
show details | |

|
#5
Angular St
Burlington, IA 52601
|
1,593 sq. feet
|
1 baths 3 beds |
show details | |

|
#6
S 4th St
Burlington, IA 52601
|
1,402 sq. feet
|
2 baths 3 beds |
show details | |

|
#7
Parkway Dr
Burlington, IA 52601
|
864 sq. feet
|
1 baths 2 beds |
show details | |

|
#8
Monarch Dr
Burlington, IA 52601
|
2,062 sq. feet
|
2 baths 3 beds |
show details | |

|
#9
N 6th St
Burlington, IA 52601
|
2,092 sq. feet
|
1 baths 4 beds |
show details | |

|
#10
Spring St
Burlington, IA 52601
|
1,480 sq. feet
|
1 baths 3 beds |
show details |
| Photo | Address | Area | Beds / Baths | Price | Details |
|---|---|---|---|---|---|

|
#11
Remey Ave
Burlington, IA 52601
|
1,281 sq. feet
|
1 baths 2 beds |
show details | |

|
#12
S 12th St
Burlington, IA 52601
|
816 sq. feet
|
1 baths 3 beds |
show details | |

|
#13
N Gertrude St
Burlington, IA 52601
|
960 sq. feet
|
1 baths 3 beds |
show details | |

|
#14
Sunnyside Ave
Burlington, IA 52601
|
1,455 sq. feet
|
1 baths 3 beds |
show details | |

|
#15
Clay St
Burlington, IA 52601
|
1,848 sq. feet
|
1 baths 3 beds |
show details | |

|
#16
Evergreen Dr
Burlington, IA 52601
|
1,412 sq. feet
|
1 baths 3 beds |
show details | |

|
#17
S 9th St
Burlington, IA 52601
|
1,963 sq. feet
|
2 baths 2 beds |
show details | |

|
#18
West Ave
Burlington, IA 52601
|
1,705 sq. feet
|
1 baths 3 beds |
show details | |

|
#19
N 3rd St Apt 3
Burlington, IA 52601
|
- sq. feet
|
- baths - beds |
show details | |

|
#20
Valley St
Burlington, IA 52601
|
- sq. feet
|
- baths - beds |
show details |
| Photo | Address | Area | Beds / Baths | Price | Details |
|---|---|---|---|---|---|

|
#21
S Garfield Ave
Burlington, IA 52601
|
- sq. feet
|
- baths - beds |
show details | |

|
#22
Agency St Apt 32
Burlington, IA 52601
|
- sq. feet
|
- baths - beds |
show details | |

|
#23
S 8th St
Burlington, IA 52601
|
- sq. feet
|
- baths - beds |
show details | |

|
#24
S 6th St
Burlington, IA 52601
|
- sq. feet
|
- baths - beds |
show details | |

|
#25
Avenue B
Fort Madison, IA 52627
|
1,469 sq. feet
|
1 baths 3 beds |
$149,500
|
show details |

|
#26
N Chestnut St
New London, IA 52645
|
1,100 sq. feet
|
1 baths 2 beds |
$119,900
|
show details |

|
#27
Madison Ave
Burlington, IA 52601
|
- sq. feet
|
- baths - beds |
show details | |

|
#28
Avenue D
Fort Madison, IA 52627
|
1,868 sq. feet
|
2 baths 3 beds |
show details | |

|
#29
Avenue D
Fort Madison, IA 52627
|
1,033 sq. feet
|
1 baths 1 beds |
show details | |

|
#30
146th Ave
West Burlington, IA 52655
|
2,088 sq. feet
|
1 baths 4 beds |
show details |
| Photo | Address | Area | Beds / Baths | Price | Details |
|---|---|---|---|---|---|

|
#31
150th St
Danville, IA 52623
|
1,512 sq. feet
|
2 baths 3 beds |
show details | |

|
#32
173rd Ave
Middletown, IA 52638
|
2,689 sq. feet
|
1 baths 4 beds |
show details | |

|
#33
S State Highway 164
Oquawka, IL 61469
|
- sq. feet
|
- baths - beds |
show details | |

|
#34
E County Road 3000
Dallas City, IL 62330
|
- sq. feet
|
- baths - beds |
show details | |

|
#35
116th St
West Burlington, IA 52655
|
- sq. feet
|
- baths - beds |
show details | |

|
#36
Avenue F Apt 4
Fort Madison, IA 52627
|
- sq. feet
|
- baths - beds |
show details | |

|
#37
Washington Rd, Trlr 166
West Burlington, IA 52655
|
- sq. feet
|
- baths - beds |
show details | |

|
#38
S State Route 94
Stronghurst, IL 61480
|
- sq. feet
|
- baths - beds |
show details | |

|
#39
Country Club Ln
Fort Madison, IA 52627
|
- sq. feet
|
- baths - beds |
show details | |

|
#40
Avenue G
Fort Madison, IA 52627
|
- sq. feet
|
- baths - beds |
show details |
| Photo | Address | Area | Beds / Baths | Price | Details |
|---|---|---|---|---|---|

|
#41
Avenue G
Fort Madison, IA 52627
|
- sq. feet
|
- baths - beds |
show details | |

|
#42
Storms Ct
Fort Madison, IA 52627
|
- sq. feet
|
- baths - beds |
show details | |

|
#43
Avenue E
Fort Madison, IA 52627
|
- sq. feet
|
- baths - beds |
show details | |

|
Check over 1 million property listings on Foreclosure.com!
|
browse all offers | |||

Latest news about housing in Burlington, IA collected exclusively by city-data.com from local newspapers, TV, and radio stations

 | best place to rent apartment near Des Moines Ave in Burlington (0 replies) |
| New Bury Apartments Burlington IA (5 replies) |
| in need of rental house (1 reply) |
| Burlington, Davenport, Waterloo a different image (7 replies) |
| Is Burlington Iowa that safe? (9 replies) |
| Dubuque, Burlington or other? (2 replies) |
Median year apartment built: 1958
Household type by relationship:
Households: 24,063- Male householders: 5,596 (2,000 living alone), Female householders: 5,651 (2,188 living alone)
3,998 spouses (3,981 opposite-sex spouses), 884 unmarried partners, (834 opposite-sex unmarried partners), 5,902 children (5,453 natural, 127 adopted, 321 stepchildren), 738 grandchildren, 135 brothers or sisters, 162 parents, 0 foster children, 184 other relatives, 512 non-relatives
- In group quarters: 296
Size of family households: 3,407 2-persons, 1,397 3-persons, 1,010 4-persons, 490 5-persons, 121 6-persons, 75 7-or-more-persons.
Size of nonfamily households: 4,356 1-person, 684 2-persons, 13 3-persons, 28 4-persons.
2,022 married couples with children.
2,347 single-parent households (440 men, 1,907 women).
95.8% of residents of Burlington speak English at home.
2.0% of residents speak Spanish at home (84% speak English very well, 16% speak English not well).
0.8% of residents speak other Indo-European language at home (68% speak English very well, 20% speak English well, 12% speak English not well).
1.0% of residents speak Asian or Pacific Island language at home (35% speak English very well, 65% speak English well).
0.2% of residents speak other language at home (49% speak English very well, 51% speak English well).
Foreign born population: 697 (2.9%)
(36.2% of them are naturalized citizens)
| Here: | 6.5 |
| State: | 6.8 |
| Here: | 4.4 |
| State: | 4.2 |
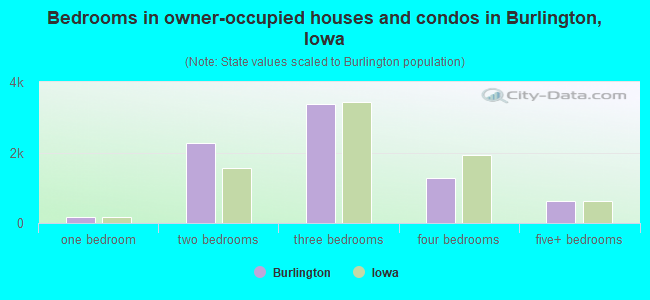
- Bedrooms in owner-occupied houses and condos in Burlington, Iowa
- 12no bedroom
- 1721 bedroom
- 2,2712 bedrooms
- 3,3753 bedrooms
- 1,2784 bedrooms
- 6185+ bedrooms
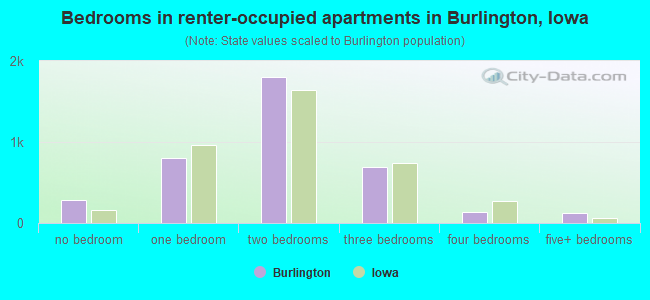
- Bedrooms in renter-occupied apartments in Burlington, Iowa
- 281no bedroom
- 8021 bedroom
- 1,7992 bedrooms
- 6963 bedrooms
- 1304 bedrooms
- 1285+ bedrooms
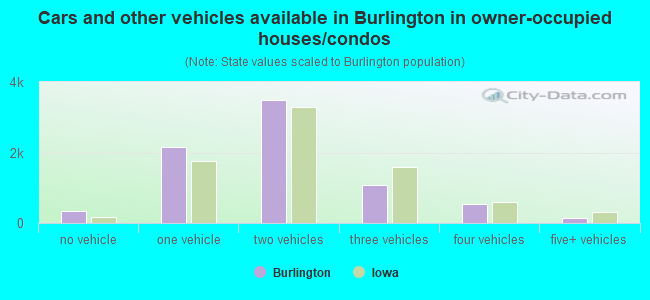
- Cars and other vehicles available in Burlington in owner-occupied houses/condos
- 337no vehicle
- 2,1491 vehicle
- 3,4762 vehicles
- 1,0693 vehicles
- 5504 vehicles
- 1455+ vehicles
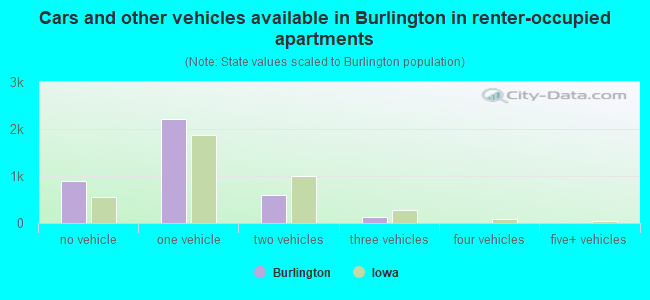
- Cars and other vehicles available in Burlington in renter-occupied apartments
- 898no vehicle
- 2,2161 vehicle
- 5882 vehicles
- 1343 vehicles
- 04 vehicles
- 05+ vehicles
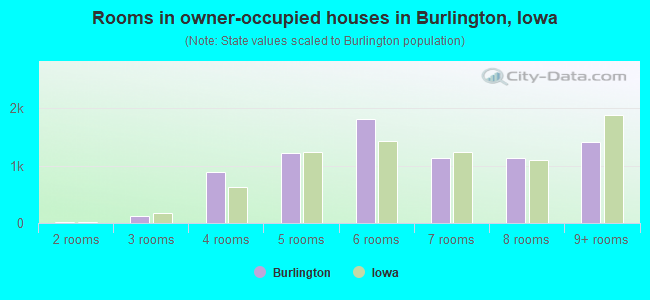
- Rooms in owner-occupied houses in Burlington, Iowa
- 01 room
- 122 rooms
- 1223 rooms
- 8864 rooms
- 1,2105 rooms
- 1,8066 rooms
- 1,1377 rooms
- 1,1408 rooms
- 1,4129+ rooms
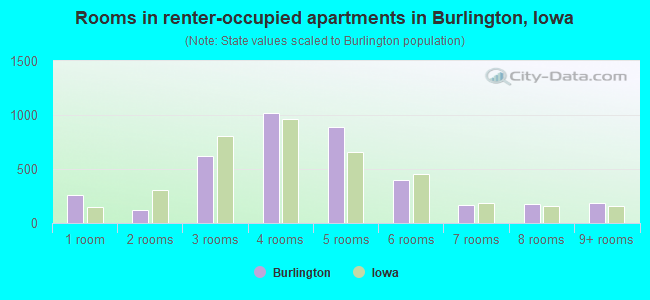
- Rooms in renter-occupied apartments in Burlington, Iowa
- 2571 room
- 1252 rooms
- 6193 rooms
- 1,0194 rooms
- 8935 rooms
- 3956 rooms
- 1677 rooms
- 1808 rooms
- 1819+ rooms
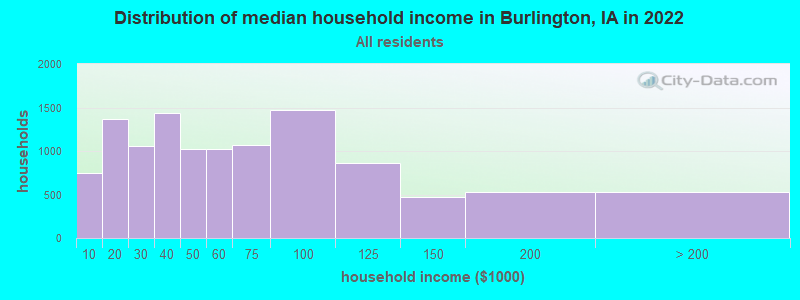
Burlington, IA household income distribution

- 750Less than $10,000
- 1,366$10,000 to $19,999
- 1,062$20,000 to $29,999
- 1,435$30,000 to $39,999
- 1,027$40,000 to $49,999
- 1,027$50,000 to $59,999
- 1,066$60,000 to $74,999
- 1,472$75,000 to $99,999
- 859$100,000 to $124,999
- 469$125,000 to $149,999
- 526$150,000 to $199,999
- 525$200,000 or more
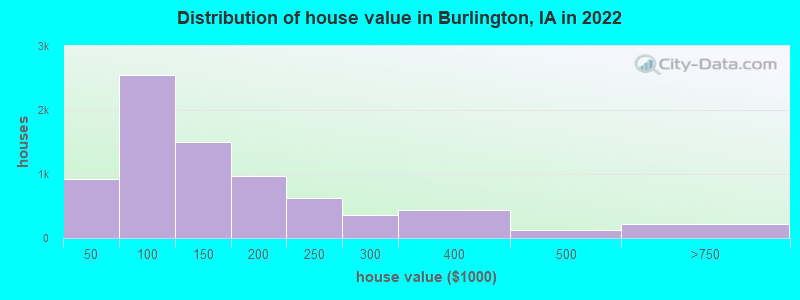
Home value of owner - occupied houses in 2022 in Burlington, IA
-
- 70Less than $10,000
- 140$10,000 to $14,999
- 11$15,000 to $19,999
- 44$20,000 to $24,999
- 177$25,000 to $29,999
- 56$30,000 to $34,999
- 87$35,000 to $39,999
- 331$40,000 to $49,999
- 324$50,000 to $59,999
- 300$60,000 to $69,999
- 602$70,000 to $79,999
- 538$80,000 to $89,999
- 452$90,000 to $99,999
- 844$100,000 to $124,999
- 654$125,000 to $149,999
- 580$150,000 to $174,999
- 386$175,000 to $199,999
- 618$200,000 to $249,999
- 359$250,000 to $299,999
- 437$300,000 to $399,999
- 119$400,000 to $499,999
- 219$500,000 to $749,999
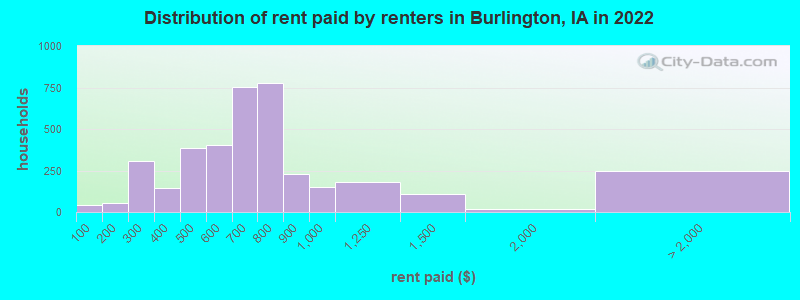
Rent paid by renters in 2022 in Burlington, IA
-
- 40Less than $100
- 22$100 to $149
- 30$150 to $199
- 75$200 to $249
- 234$250 to $299
- 74$300 to $349
- 69$350 to $399
- 298$400 to $449
- 86$450 to $499
- 164$500 to $549
- 236$550 to $599
- 435$600 to $649
- 316$650 to $699
- 346$700 to $749
- 428$750 to $799
- 227$800 to $899
- 150$900 to $999
- 180$1,000 to $1,249
- 106$1,250 to $1,499
- 19$1,500 to $1,999
- 10$2,000 to $2,499
- 237No cash rent
Percentage of workers working in this county: 89.9%
Number of people working at home: 528 (4.7% of all workers)
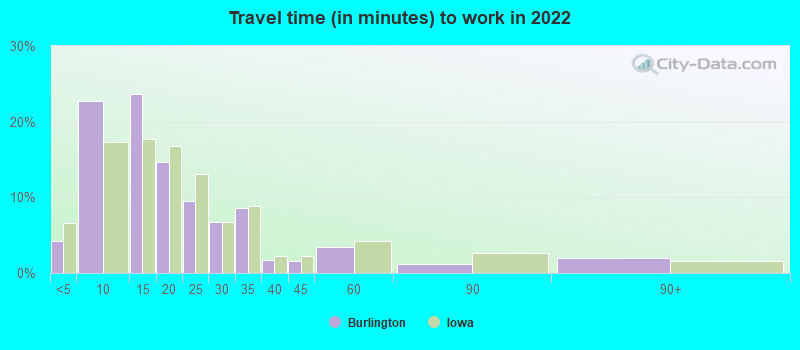
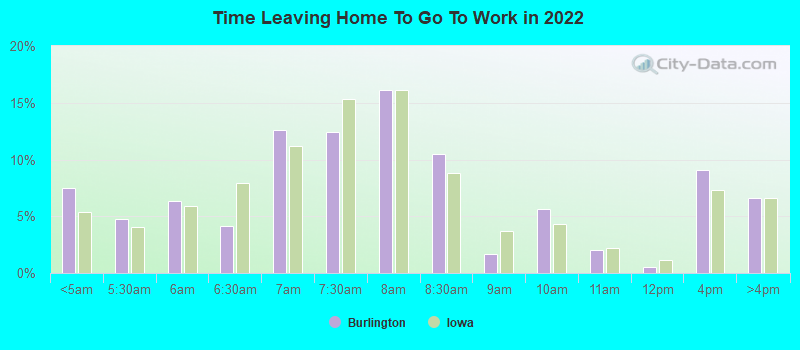
Travel time to work (commute)
- Less than 5 minutes: 464
- 5 to 9 minutes: 2,862
- 10 to 14 minutes: 3,451
- 15 to 19 minutes: 1,781
- 20 to 24 minutes: 642
- 25 to 29 minutes: 134
- 30 to 34 minutes: 421
- 35 to 39 minutes: 140
- 40 to 44 minutes: 67
- 45 to 59 minutes: 275
- 60 to 89 minutes: 103
- 90 or more minutes: 130
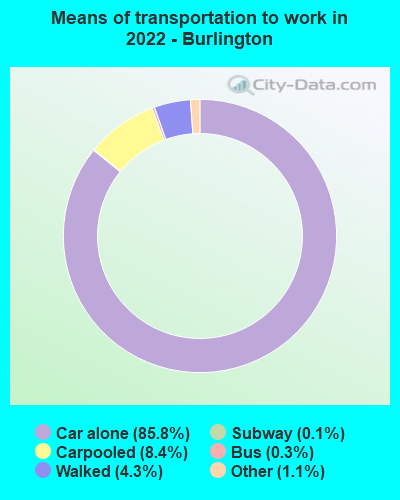
Means of transportation to work:
- Drove a car alone: 9,169 (80.4%)
- Carpooled: 949 (8.3%)
- Bus: 34 (0.3%)
- Long-distance train or commuter rail: 13 (0.1%)
- Ferryboat: 3 (0.0%)
- Taxi: 112 (1.0%)
- Walked: 458 (4.0%)
- Worked at home: 528 (4.6%)
- Unemployment by race in 2022
- Unemployment rate for White non-Hispanic residents
- 3.4%Males
- 2.1%Females
- Unemployment rate for Black residents
- 6.8%Males
- 13.3%Females
- Unemployment rate for two or more race residents
- 3.0%Males
- Unemployment rate for Hispanic or Latino residents
- 5.8%Females
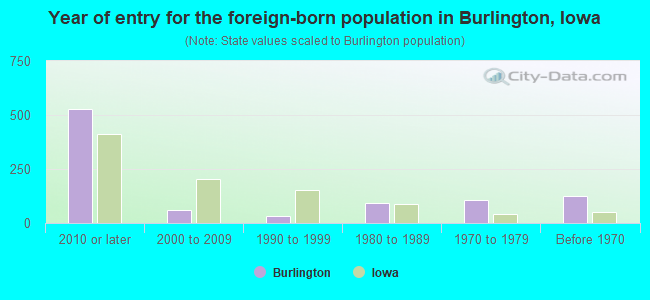
- Year of entry for the foreign-born population in Burlington, Iowa
- 5292010 or later
- 582000 to 2009
- 341990 to 1999
- 941980 to 1989
- 1051970 to 1979
- 126Before 1970
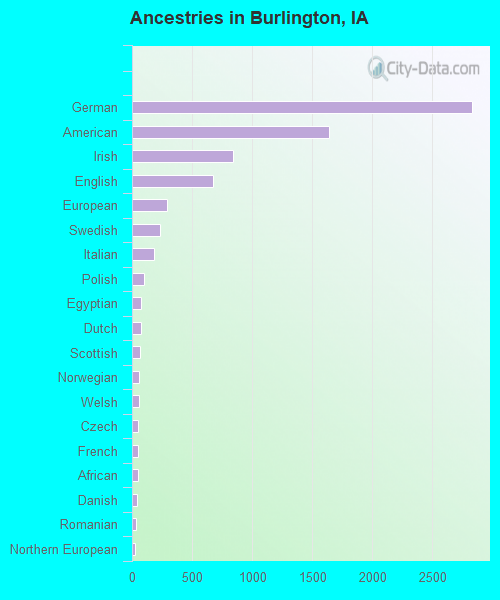
First ancestries reported:
- German: 2,829 (28.4%)
- American: 1,636 (16.4%)
- Irish: 843 (8.5%)
- English: 670 (6.7%)
- European: 295 (3.0%)
- Swedish: 230 (2.3%)
- Italian: 184 (1.8%)
- Polish: 98 (1.0%)
- Egyptian: 79 (0.8%)
- Dutch: 73 (0.7%)
- Scottish: 64 (0.6%)
- Norwegian: 56 (0.6%)
- Welsh: 56 (0.6%)
- Czech: 51 (0.5%)
- French: 48 (0.5%)
- African: 47 (0.5%)
- Danish: 39 (0.4%)
- Romanian: 37 (0.4%)
- Northern European: 29 (0.3%)
- Scandinavian: 22 (0.2%)
- Greek: 20 (0.2%)
- Portuguese: 15 (0.2%)
- Scotch-Irish: 15 (0.2%)
- Ukrainian: 11 (0.1%)
- Croatian: 10 (0.1%)
- Czechoslovakian: 9 (0.09%)
- Swiss: 9 (0.09%)
- Eastern European: 7 (0.07%)
- French Canadian: 7 (0.07%)
- British: 6 (0.06%)
- Serbian: 4 (0.04%)
- Slovak: 4 (0.04%)
- Slovene: 3 (0.03%)
Most common places of birth for foreign-born residents (%):
| Burlington: | 38.8% (258) |
| Iowa: | 6.2% (11,148) |
| Burlington: | 7.7% (51) |
| Iowa: | 3.2% (5,672) |
| Burlington: | 7.5% (50) |
| Iowa: | 4.6% (8,194) |
| Burlington: | 6.5% (43) |
| Iowa: | 1.6% (2,873) |
| Burlington: | 6.3% (42) |
| Iowa: | 23.3% (41,625) |
| Burlington: | 5.7% (38) |
| Iowa: | 0.5% (980) |
| Burlington: | 4.4% (29) |
| Iowa: | 2.6% (4,675) |
| Burlington: | 4.1% (27) |
| Iowa: | 1.4% (2,525) |
| Burlington: | 3.0% (20) |
| Iowa: | 0.2% (381) |
| Burlington: | 2.7% (18) |
| Iowa: | 0.5% (827) |
| Burlington: | 2.7% (18) |
| Iowa: | 0.2% (397) |
| Burlington: | 2.0% (13) |
| Iowa: | 0.2% (366) |
| Burlington: | 1.8% (12) |
| Iowa: | 2.9% (5,155) |
| Burlington: | 1.7% (11) |
| Iowa: | 0.1% (227) |
| Burlington: | 1.5% (10) |
| Iowa: | 0.8% (1,425) |
| Burlington: | 1.5% (10) |
| Iowa: | 0.1% (205) |
Place of birth for U.S.-born residents:
- This state: 17,952
- Other state: 5,262
- Northeast: 413
- Midwest: 3,009
- South: 1,119
- West: 722
86.2% of Burlington residents lived in the same house 1 years ago.
Out of people who lived in different houses, 38.4% lived in this county.
Out of people who lived in different counties, 57.9% lived in Iowa.
| Burlington: | 86.2% |
| State average: | 87.2% |
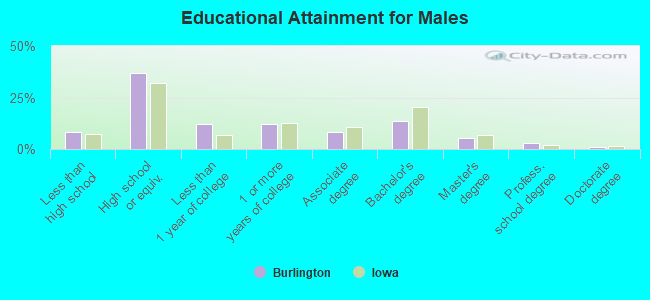
Education attainment for males 25 years and older:
- No schooling: 98
- Nursery to 4th grade: 0
- 5th and 6th grade: 0
- 7th and 8th grade: 66
- 9th grade: 116
- 10th grade: 75
- 11th grade: 126
- 12th grade, no diploma: 185
- High school graduate (or equivalency): 3,033
- Less than 1 year of college: 1,012
- Some college more than 1 year, no degree: 986
- Associate degree: 672
- Bachelor's degree: 1,118
- Master's degree: 450
- Professional school degree: 249
- Doctorate degree: 64
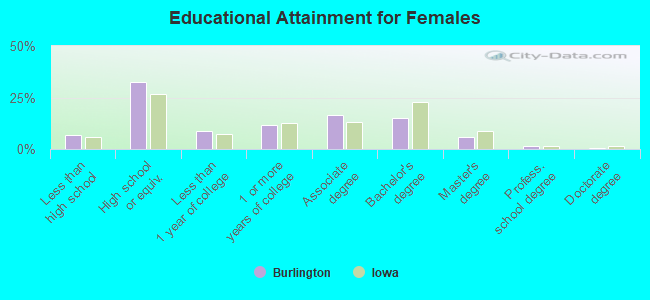
Education attainment for females 25 years and older:
- No schooling: 80
- Nursery to 4th grade: 6
- 5th and 6th grade: 0
- 7th and 8th grade: 57
- 9th grade: 43
- 10th grade: 198
- 11th grade: 135
- 12th grade, no diploma: 84
- High school graduate (or equivalency): 2,835
- Less than 1 year of college: 782
- Some college more than 1 year, no degree: 1,006
- Associate degree: 1,456
- Bachelor's degree: 1,326
- Master's degree: 525
- Professional school degree: 136
- Doctorate degree: 48
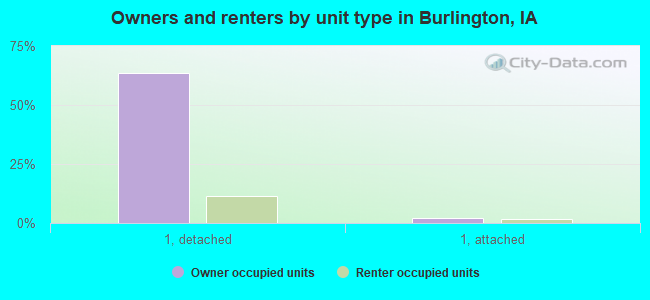
Housing units in structures:
- One, detached: 9,408
- One, attached: 540
- Two: 344
- 3 or 4: 683
- 5 to 9: 530
- 10 to 19: 500
- 20 to 49: 112
- 50 or more: 353
- Mobile homes: 83
- Boats, RVs, vans, etc.: 37
Housing units lacking complete kitchen facilities in 2022: 3.3%
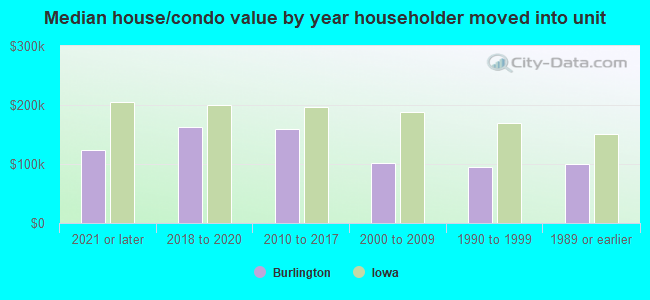
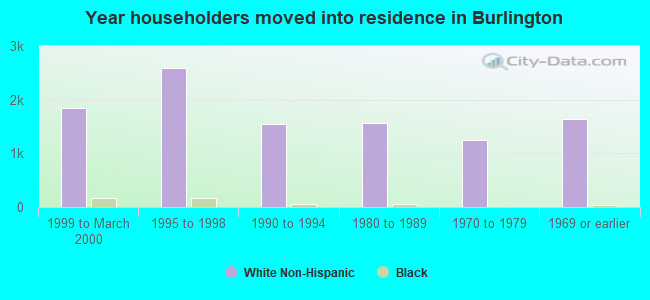
House/condo owner moved in on average 14 years ago
Renter moved in on average 6 years ago
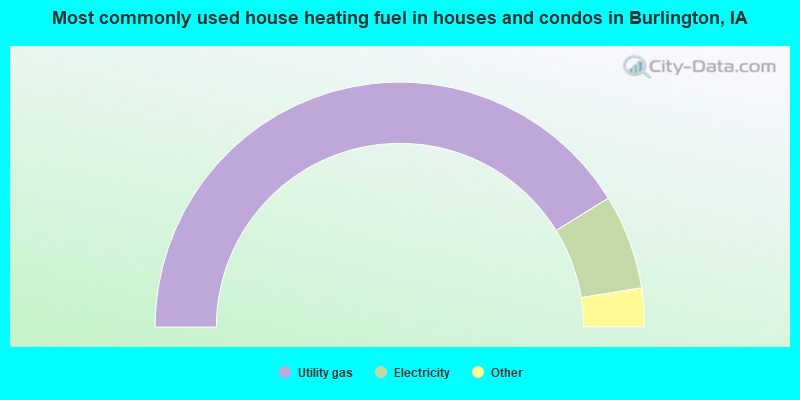
- 82.4%Utility gas
- 12.5%Electricity
- 3.2%Bottled, tank, or LP gas
- 1.3%Wood
- 0.4%No fuel used
- 0.1%Other fuel
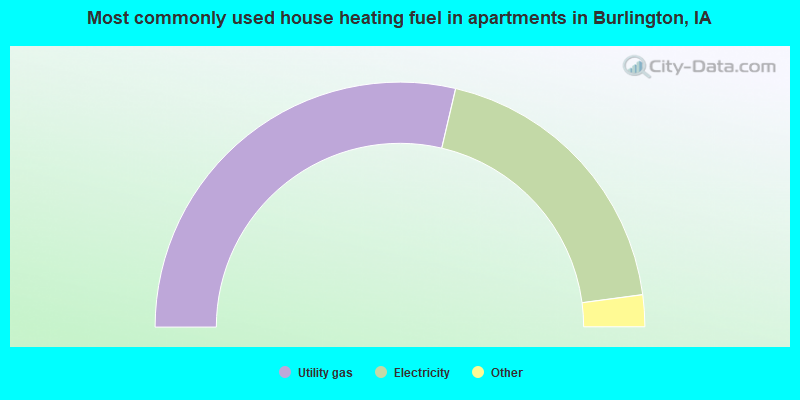
- 57.3%Utility gas
- 38.5%Electricity
- 2.3%Bottled, tank, or LP gas
- 1.0%No fuel used
- 0.7%Wood
- 0.2%Other fuel
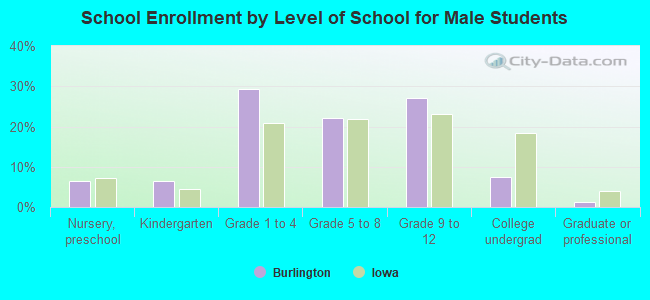
Private vs. public school enrollment:
| Here: | 10.2% |
| Iowa: | 10.6% |
| Here: | 10.7% |
| Iowa: | 7.9% |
| Here: | 12.3% |
| Iowa: | 23.9% |