Calabash, NC (North Carolina) Houses and Residents
| Calabash: | $202,613 |
| North Carolina: | $280,600 |
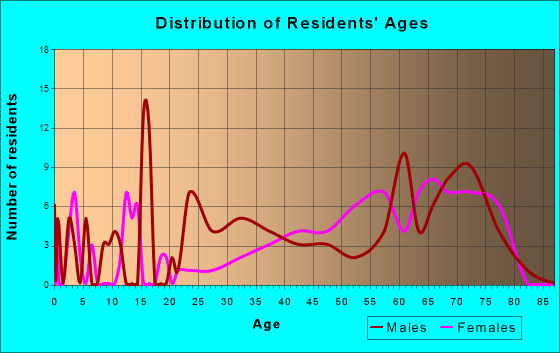
Total population: 2,092 (Urban population: 717 (all inside urban clusters), Rural population: 0)
Houses: 1,813 (1,236 occupied: 829 owner occupied, 471 renter occupied)
| % of renters here: | 36% |
| State: | 33% |
Housing density: 1,279 houses/condos per square mile
Median price asked for vacant for-sale houses and condos in 2022: $111,900.
Median contract rent in 2022: $1,183 (lower quartile is $918, upper quartile is $1,436)
Median rent asked for vacant for-rent units in 2022: $1,286
Median gross rent in Calabash, NC in 2022: $1,318
Housing units in Calabash with a mortgage: 448 (19 second mortgage, 0 home equity loan, 21 both second mortgage and home equity loan)
Houses without a mortgage: 0
Median household income for houses/condos with a mortgage: $59,241
Median household income for apartments without a mortgage: $60,940
Median monthly housing costs: $1,084
Compare current foreclosures near Calabash, NC:
| Photo | Address | Area | Beds / Baths | Price | Details |
|---|---|---|---|---|---|

|
#1
Haystack Way
Calabash, NC 28467
|
2,080 sq. feet
|
2 baths 4 beds |
show details | |

|
#2
Boundaryline Dr NW
Calabash, NC 28467
|
2,311 sq. feet
|
2 baths 3 beds |
show details | |

|
#3
Pilot House Pl
Calabash, NC 28467
|
1,600 sq. feet
|
3 baths 3 beds |
show details | |

|
#4
Freeboard Ln
Calabash, NC 28467
|
1,600 sq. feet
|
2 baths 3 beds |
show details | |

|
#5
Valley Dr
Calabash, NC 28467
|
1,330 sq. feet
|
2 baths 3 beds |
show details | |

|
#6
Buoy Ct
Calabash, NC 28467
|
2,205 sq. feet
|
2 baths 2 beds |
show details | |

|
#7
Nottoway Ave NW
Calabash, NC 28467
|
1,448 sq. feet
|
2 baths 3 beds |
show details | |

|
#8
High Point Ave
Calabash, NC 28467
|
1,068 sq. feet
|
2 baths 2 beds |
show details | |

|
#9
Sherman Dr, Apt 907
Calabash, NC 28467
|
- sq. feet
|
- baths - beds |
show details | |

|
#10
Beach Dr Sw, Unit 1110
Calabash, NC 28467
|
- sq. feet
|
- baths - beds |
show details |
| Photo | Address | Area | Beds / Baths | Price | Details |
|---|---|---|---|---|---|

|
#11
Landmark Cv
Calabash, NC 28467
|
- sq. feet
|
- baths - beds |
show details | |

|
#12
Carolina Farms Blvd
Calabash, NC 28467
|
1,281 sq. feet
|
- baths - beds |
show details | |

|
#13
High Point Ave
Calabash, NC 28467
|
- sq. feet
|
- baths - beds |
show details | |

|
#14
Tree Acres Cir NW
Calabash, NC 28467
|
- sq. feet
|
- baths - beds |
show details | |

|
#15
N Highway 905
Longs, SC 29568
|
1,344 sq. feet
|
2 baths 3 beds |
show details | |

|
#16
Hughes Smith Rd NW
Ash, NC 28420
|
2,128 sq. feet
|
2 baths 3 beds |
show details | |

|
#17
Lake Tree Dr SW
Ocean Isle Beach, NC 28469
|
2,026 sq. feet
|
2 baths 3 beds |
show details | |

|
#18
Stegal Cir
Longs, SC 29568
|
2,864 sq. feet
|
2 baths 3 beds |
show details | |

|
#19
Anne St
North Myrtle Beach, SC 29582
|
1,810 sq. feet
|
1 baths 3 beds |
show details | |

|
#20
Finch Dr SW
Shallotte, NC 28470
|
1,012 sq. feet
|
2 baths 3 beds |
show details |
| Photo | Address | Area | Beds / Baths | Price | Details |
|---|---|---|---|---|---|

|
#21
High Meadows Dr
Shallotte, NC 28470
|
1,404 sq. feet
|
2 baths 3 beds |
show details | |

|
#22
Country Club Dr
Shallotte, NC 28470
|
1,874 sq. feet
|
2 baths 3 beds |
show details | |

|
#23
Lakeview Dr SW
Supply, NC 28462
|
1,080 sq. feet
|
2 baths 3 beds |
show details | |

|
#24
Holden Beach Rd SW # 25
Shallotte, NC 28470
|
1,416 sq. feet
|
2 baths 3 beds |
show details | |

|
#25
Heath Dr
Longs, SC 29568
|
1,407 sq. feet
|
2 baths 3 beds |
show details | |

|
#26
Forest Dr SW
Supply, NC 28462
|
2,072 sq. feet
|
2 baths 3 beds |
show details | |

|
#27
Civietown Rd SW
Supply, NC 28462
|
1,298 sq. feet
|
1 baths 3 beds |
show details | |

|
#28
Sevilleen St SW
Ocean Isle Beach, NC 28469
|
1,872 sq. feet
|
2 baths 3 beds |
show details | |

|
#29
Red Bluff Rd
Loris, SC 29569
|
1,058 sq. feet
|
1 baths 3 beds |
show details | |

|
#30
Nature Trl
Little River, SC 29566
|
1,142 sq. feet
|
2 baths 3 beds |
show details |
| Photo | Address | Area | Beds / Baths | Price | Details |
|---|---|---|---|---|---|

|
#31
Wyndfall Dr SW
Sunset Beach, NC 28468
|
1,328 sq. feet
|
2 baths 3 beds |
show details | |

|
#32
Clipper Rd
North Myrtle Beach, SC 29582
|
1,580 sq. feet
|
2 baths 3 beds |
show details | |

|
#33
Sultana Dr
Little River, SC 29566
|
1,322 sq. feet
|
2 baths 3 beds |
show details | |

|
#34
Scotch Broom Dr # D-103
Little River, SC 29566
|
1,552 sq. feet
|
2 baths 3 beds |
show details | |

|
#35
N Kings Hwy Apt 14-1
Myrtle Beach, SC 29572
|
- sq. feet
|
- baths - beds |
show details | |

|
#36
Mill Branch Rd NW
Ash, NC 28420
|
- sq. feet
|
- baths - beds |
show details | |

|
#37
Hackberry Way
Longs, SC 29568
|
- sq. feet
|
- baths - beds |
show details | |

|
#38
Shamrock Dr SW
Sunset Beach, NC 28468
|
- sq. feet
|
- baths - beds |
show details | |

|
#39
Big Neck Rd NW
Ash, NC 28420
|
- sq. feet
|
- baths - beds |
show details | |

|
#40
Bay Dr
Little River, SC 29566
|
- sq. feet
|
- baths - beds |
show details |
| Photo | Address | Area | Beds / Baths | Price | Details |
|---|---|---|---|---|---|

|
#41
Oxfordshire St, Unit 13
Little River, SC 29566
|
- sq. feet
|
- baths - beds |
show details | |

|
#42
Adrift Loop, Unit A
Little River, SC 29566
|
- sq. feet
|
- baths - beds |
show details | |

|
#43
Highland Forest Cir # 1
Shallotte, NC 28470
|
- sq. feet
|
- baths - beds |
show details | |

|
#44
Eureka Trl
Longs, SC 29568
|
- sq. feet
|
- baths - beds |
show details | |

|
#45
Harrelson Rd
Longs, SC 29568
|
- sq. feet
|
- baths - beds |
show details | |

|
#46
Irees Way
Longs, SC 29568
|
- sq. feet
|
- baths - beds |
show details | |

|
#47
Sutherland Dr
Little River, SC 29566
|
- sq. feet
|
- baths - beds |
show details | |

|
#48
Jardine Loop
Little River, SC 29566
|
- sq. feet
|
- baths - beds |
show details | |

|
#49
Lake Arrowhead Rd
Myrtle Beach, SC 29572
|
- sq. feet
|
- baths - beds |
show details | |

|
Check over 1 million property listings on Foreclosure.com!
|
browse all offers | |||

Latest news about housing in Calabash, NC collected exclusively by city-data.com from local newspapers, TV, and radio stations

 | Calabash input (54 replies) |
| Why are so many homes for sale, Shoreline Dr., Sunset Beach (5 replies) |
| Where to look for a home best for ex-farm dogs (10 replies) |
| 3-month rentals - Southport/Ocean Isle (26 replies) |
| Long Term Rental - Calabash area (1 reply) |
| Restaurants in Calabash (4 replies) |
Median year apartment built: 1996
Household type by relationship:
Households: 2,815- Male householders: 560 (203 living alone), Female householders: 687 (204 living alone)
429 spouses (419 opposite-sex spouses), 123 unmarried partners, (123 opposite-sex unmarried partners), 600 children (559 natural, 9 adopted, 30 stepchildren), 264 grandchildren, 7 brothers or sisters, 110 parents, 0 foster children, 24 other relatives, 6 non-relatives
Size of family households: 489 2-persons, 73 3-persons, 92 4-persons, 111 5-persons, 5 6-persons, 5 7-or-more-persons.
Size of nonfamily households: 429 1-person, 102 2-persons, 3 3-persons.
124 married couples with children.
111 single-parent households (17 men, 94 women).
94.5% of residents of Calabash speak English at home.
4.9% of residents speak Spanish at home (26% speak English very well, 74% speak English well).
0.6% of residents speak other Indo-European language at home (31% speak English very well, 69% speak English well).
Foreign born population: 76 (2.7%)
(30.3% of them are naturalized citizens)
| Here: | 5.5 |
| State: | 6.4 |
| Here: | 3.5 |
| State: | 4.4 |

- Bedrooms in owner-occupied houses and condos in Calabash, North Carolina
- 0no bedroom
- 61 bedroom
- 3152 bedrooms
- 3923 bedrooms
- 1124 bedrooms
- 55+ bedrooms

- Bedrooms in renter-occupied apartments in Calabash, North Carolina
- 56no bedroom
- 1291 bedroom
- 1592 bedrooms
- 1173 bedrooms
- 04 bedrooms
- 105+ bedrooms

- Cars and other vehicles available in Calabash in owner-occupied houses/condos
- 38no vehicle
- 2951 vehicle
- 3642 vehicles
- 953 vehicles
- 84 vehicles
- 305+ vehicles

- Cars and other vehicles available in Calabash in renter-occupied apartments
- 107no vehicle
- 2361 vehicle
- 782 vehicles
- 293 vehicles
- 114 vehicles
- 105+ vehicles

- Rooms in owner-occupied houses in Calabash, North Carolina
- 01 room
- 62 rooms
- 473 rooms
- 664 rooms
- 3475 rooms
- 1856 rooms
- 1047 rooms
- 368 rooms
- 399+ rooms

- Rooms in renter-occupied apartments in Calabash, North Carolina
- 561 room
- 1002 rooms
- 703 rooms
- 1884 rooms
- 65 rooms
- 326 rooms
- 37 rooms
- 08 rooms
- 169+ rooms


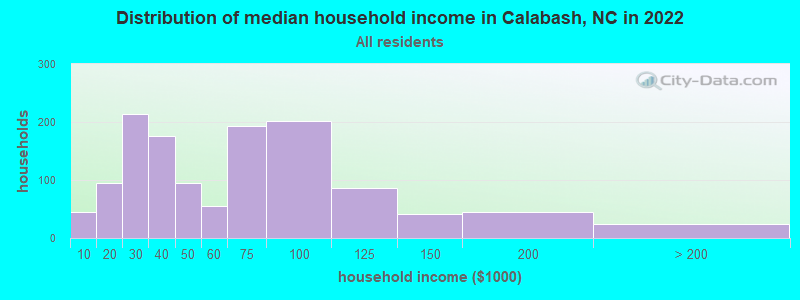
Calabash, NC household income distribution

- 44Less than $10,000
- 95$10,000 to $19,999
- 214$20,000 to $29,999
- 176$30,000 to $39,999
- 95$40,000 to $49,999
- 56$50,000 to $59,999
- 193$60,000 to $74,999
- 201$75,000 to $99,999
- 87$100,000 to $124,999
- 41$125,000 to $149,999
- 45$150,000 to $199,999
- 25$200,000 or more
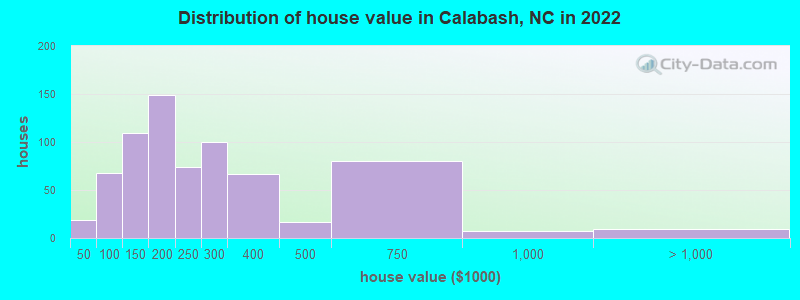
Home value of owner - occupied houses in 2022 in Calabash, NC
-
- 6Less than $10,000
- 8$20,000 to $24,999
- 4$40,000 to $49,999
- 8$50,000 to $59,999
- 9$70,000 to $79,999
- 39$80,000 to $89,999
- 6$90,000 to $99,999
- 79$100,000 to $124,999
- 29$125,000 to $149,999
- 112$150,000 to $174,999
- 35$175,000 to $199,999
- 73$200,000 to $249,999
- 99$250,000 to $299,999
- 66$300,000 to $399,999
- 17$400,000 to $499,999
- 80$500,000 to $749,999
- 6$750,000 to $999,999
- 8$1,000,000 to $1,499,999
Rent paid by renters in 2022 in Calabash, NC
-
- 4$450 to $499
- 5$500 to $549
- 4$550 to $599
- 22$650 to $699
- 6$700 to $749
- 17$750 to $799
- 25$800 to $899
- 19$900 to $999
- 180$1,000 to $1,249
- 26$1,250 to $1,499
- 85$1,500 to $1,999
- 37No cash rent


Percentage of workers working in this county: 55.2%
Number of people working at home: 110 (10.0% of all workers)
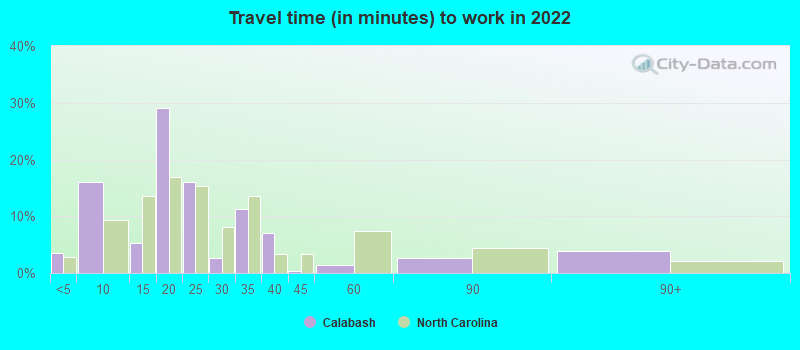
Travel time to work (commute)
- Less than 5 minutes: 210
- 5 to 9 minutes: 78
- 10 to 14 minutes: 141
- 15 to 19 minutes: 239
- 20 to 24 minutes: 96
- 25 to 29 minutes: 46
- 30 to 34 minutes: 81
- 35 to 39 minutes: 23
- 40 to 44 minutes: 30
- 45 to 59 minutes: 82
- 60 to 89 minutes: 0
- 90 or more minutes: 18
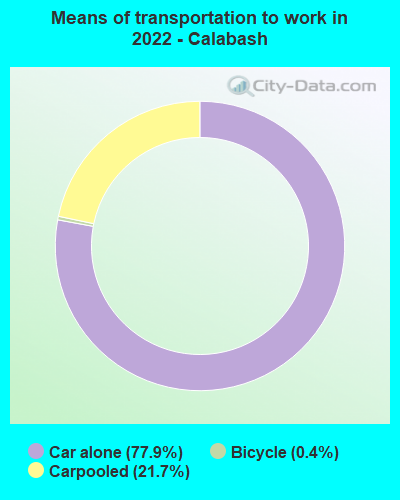
Means of transportation to work:
- Drove a car alone: 976 (69.5%)
- Carpooled: 283 (20.1%)
- Bicycle: 5 (0.4%)
- Worked at home: 110 (7.8%)

- Unemployment by race in 2022
- Unemployment rate for White non-Hispanic residents
- 12.1%Males
- 2.0%Females
- Unemployment rate for two or more race residents
- 22.1%Males

- Year of entry for the foreign-born population in Calabash, North Carolina
- 02010 or later
- 02000 to 2009
- 1041990 to 1999
- 41980 to 1989
- 11970 to 1979
- 10Before 1970

First ancestries reported:
- Irish: 296 (21.5%)
- American: 148 (10.8%)
- German: 66 (4.8%)
- English: 64 (4.7%)
- Italian: 63 (4.6%)
- Scottish: 46 (3.3%)
- Yugoslavian: 30 (2.2%)
- Swedish: 25 (1.8%)
- Scotch-Irish: 20 (1.5%)
- European: 13 (0.9%)
- Danish: 5 (0.4%)
- French: 5 (0.4%)
- Welsh: 5 (0.4%)
- Dutch: 4 (0.3%)
- Syrian: 2 (0.1%)
Most common places of birth for foreign-born residents (%):
| Calabash: | 52.3% (67) |
| North Carolina: | 4.7% (40,707) |
| Calabash: | 31.2% (40) |
| North Carolina: | 24.7% (214,776) |
| Calabash: | 18.8% (24) |
| North Carolina: | 0.2% (1,928) |
| Calabash: | 3.9% (5) |
| North Carolina: | 0.2% (1,332) |
| Calabash: | 3.9% (5) |
| North Carolina: | 1.0% (9,005) |
| Calabash: | 3.1% (4) |
| North Carolina: | 2.1% (18,105) |
Place of birth for U.S.-born residents:
- This state: 967
- Other state: 1,712
- Northeast: 587
- Midwest: 220
- South: 709
- West: 218
96.5% of Calabash residents lived in the same house 1 years ago.
Out of people who lived in different houses, 9.3% lived in this county.
Out of people who lived in different counties, 22.9% lived in North Carolina.
| Calabash: | 96.5% |
| State average: | 87.3% |
Education attainment for males 25 years and older:
- No schooling: 0
- Nursery to 4th grade: 0
- 5th and 6th grade: 11
- 7th and 8th grade: 3
- 9th grade: 20
- 10th grade: 15
- 11th grade: 44
- 12th grade, no diploma: 82
- High school graduate (or equivalency): 231
- Less than 1 year of college: 14
- Some college more than 1 year, no degree: 128
- Associate degree: 114
- Bachelor's degree: 94
- Master's degree: 84
- Professional school degree: 0
- Doctorate degree: 6

Education attainment for females 25 years and older:
- No schooling: 0
- Nursery to 4th grade: 0
- 5th and 6th grade: 0
- 7th and 8th grade: 4
- 9th grade: 0
- 10th grade: 47
- 11th grade: 14
- 12th grade, no diploma: 13
- High school graduate (or equivalency): 415
- Less than 1 year of college: 116
- Some college more than 1 year, no degree: 90
- Associate degree: 186
- Bachelor's degree: 105
- Master's degree: 111
- Professional school degree: 4
- Doctorate degree: 0

Housing units in structures:
- One, detached: 884
- One, attached: 5
- Two: 14
- 3 or 4: 8
- 5 to 9: 80
- 10 to 19: 183
- 20 to 49: 106
- 50 or more: 6
- Mobile homes: 519
- Boats, RVs, vans, etc.: 5
Median worth of mobile homes: $147,660
Housing units lacking complete kitchen facilities in 2022: 2.2%
House/condo owner moved in on average 8 years ago
Renter moved in on average 1 years ago

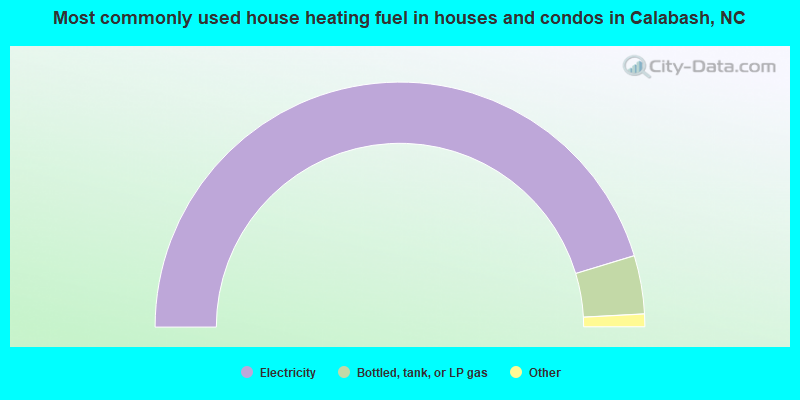
- 90.6%Electricity
- 7.7%Bottled, tank, or LP gas
- 0.8%Utility gas
- 0.8%Other fuel
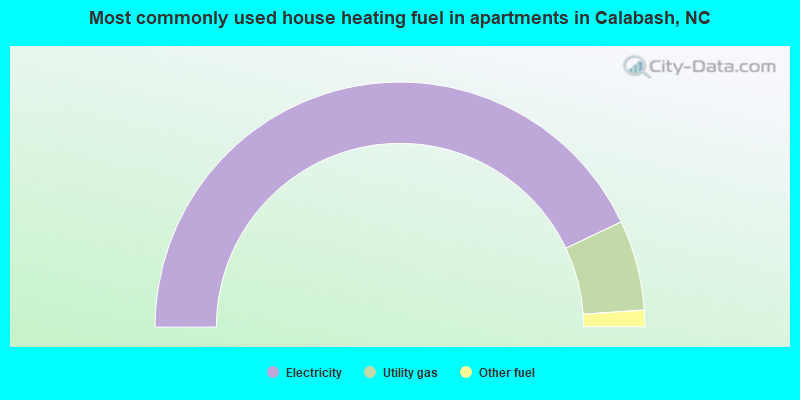
- 86.0%Electricity
- 11.9%Utility gas
- 2.2%Other fuel
Private vs. public school enrollment:
| Here: | 0.0% |
| North Carolina: | 13.8% |
| Here: | 24.4% |
| North Carolina: | 11.9% |
| Here: | 0.0% |
| North Carolina: | 19.3% |


