Housing density: 1,449 houses/condos per square mile
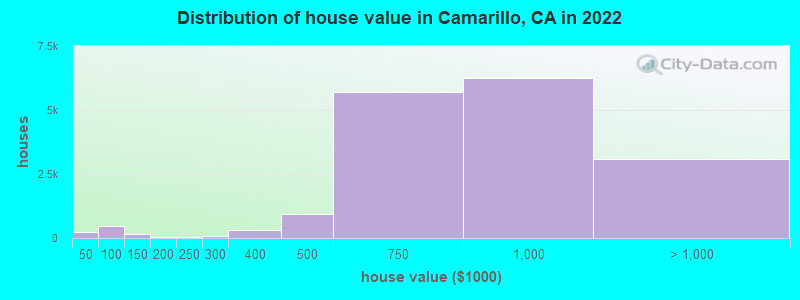
Median price asked for vacant for-sale houses and condos in 2022: $901,241.
Median contract rent in 2022: over $2,000 (lower quartile is $1,989, upper quartile is over $2,000)
Median rent asked for vacant for-rent units in 2022: $3,301
Median gross rent in Camarillo, CA in 2022: over $2,000
Housing units in Camarillo with a mortgage: 11,613 (734 second mortgage, 148 home equity loan, 546 both second mortgage and home equity loan) Houses without a mortgage: 38
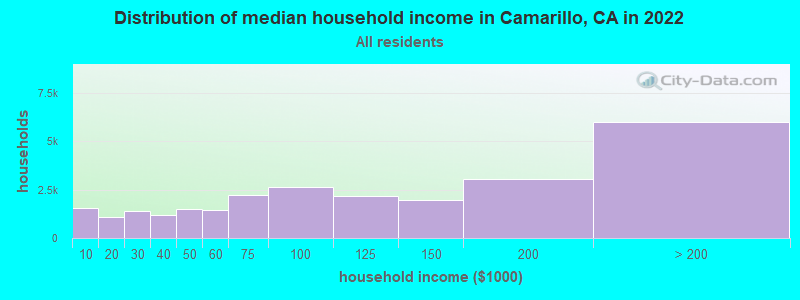
Median household income for houses/condos with a mortgage: $157,088
Median household income for apartments without a mortgage: $72,966
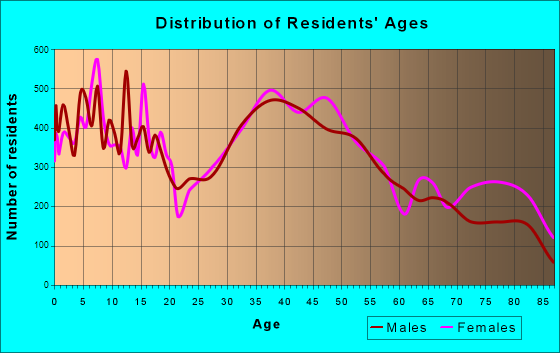
9,764 married couples with children.
2,593 single-parent households (391 men, 2,202 women).
71.8% of residents of Camarillo speak English at home.
16.0% of residents speak Spanish at home (77% speak English very well, 11% speak English well, 8% speak English not well, 4% don't speak English at all).
5.1% of residents speak other Indo-European language at home (88% speak English very well, 9% speak English well, 3% speak English not well).
6.6% of residents speak Asian or Pacific Island language at home (66% speak English very well, 18% speak English well, 15% speak English not well).
1.1% of residents speak other language at home (81% speak English very well, 18% speak English well, 1% speak English not well).
Foreign born population: 13,760 (19.6%)
(62.1% of them are naturalized citizens)
Percentage of workers working in this county: 90.0% Number of people working at home: 5,739 (17.0% of all workers)
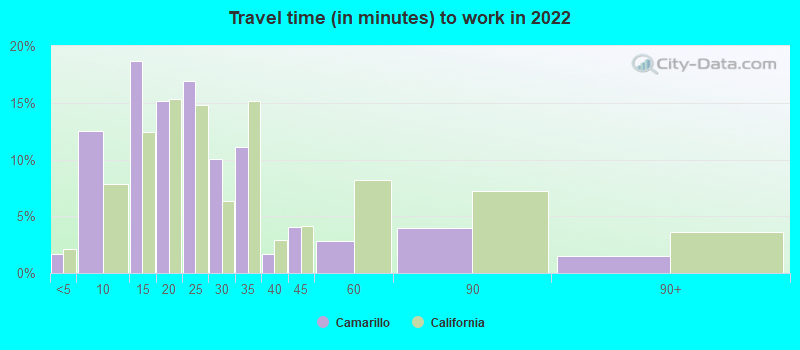
Travel time to work (commute)
Less than 5 minutes: 376
5 to 9 minutes: 2,571
10 to 14 minutes: 4,672
15 to 19 minutes: 5,522
20 to 24 minutes: 4,143
25 to 29 minutes: 2,082
30 to 34 minutes: 3,946
35 to 39 minutes: 246
40 to 44 minutes: 422
45 to 59 minutes: 968
60 to 89 minutes: 1,246
90 or more minutes: 665
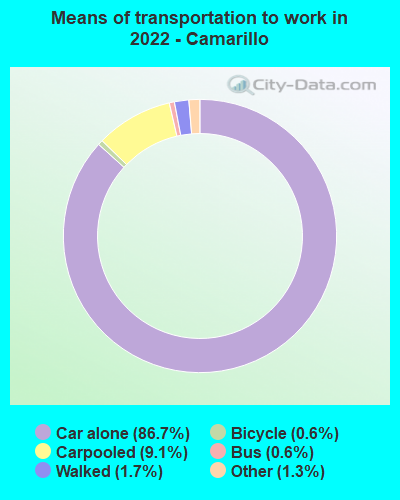
Means of transportation to work:
Drove a car alone: 27,392 (71.6%)
Carpooled: 3,405 (8.9%)
Bus: 208 (0.5%)
Taxi: 483 (1.3%)
Bicycle: 229 (0.6%)
Walked: 584 (1.5%)
Worked at home: 5,739 (15.0%)
Unemployment by race in 2022
Unemployment rate for White non-Hispanic residents
4.1%Males
2.5%Females
Unemployment rate for Black residents
5.1%Males
4.1%Females
Unemployment rate for Asian residents
0.6%Males
5.9%Females
Unemployment rate for other race residents
6.5%Males
1.8%Females
Unemployment rate for two or more race residents
2.7%Males
1.9%Females
Unemployment rate for Hispanic or Latino residents
0.6%Males
2.6%Females
Year of entry for the foreign-born population in Camarillo, California
2,7352010 or later
2,3252000 to 2009
1,8691990 to 1999
1,9961980 to 1989
1,5141970 to 1979
1,994Before 1970
First ancestries reported:
American: 2,929 (8.6%)
English: 2,110 (6.2%)
German: 1,476 (4.3%)
Italian: 1,414 (4.2%)
Irish: 1,404 (4.1%)
European: 1,181 (3.5%)
Norwegian: 344 (1.0%)
Polish: 273 (0.8%)
Iranian: 266 (0.8%)
Ukrainian: 261 (0.8%)
Scottish: 209 (0.6%)
British: 204 (0.6%)
French: 160 (0.5%)
Dutch: 149 (0.4%)
Danish: 147 (0.4%)
Russian: 142 (0.4%)
Nigerian: 140 (0.4%)
Czech: 128 (0.4%)
Eastern European: 125 (0.4%)
Swedish: 121 (0.4%)
Northern European: 113 (0.3%)
Welsh: 113 (0.3%)
Scotch-Irish: 101 (0.3%)
Hungarian: 100 (0.3%)
French Canadian: 93 (0.3%)
Greek: 74 (0.2%)
Egyptian: 60 (0.2%)
Celtic: 57 (0.2%)
Portuguese: 52 (0.2%)
Lebanese: 46 (0.1%)
Scandinavian: 45 (0.1%)
Austrian: 43 (0.1%)
Australian: 38 (0.1%)
Belgian: 37 (0.1%)
Canadian: 32 (0.09%)
Palestinian: 32 (0.09%)
Jamaican: 30 (0.09%)
Syrian: 28 (0.08%)
African: 25 (0.07%)
Czechoslovakian: 22 (0.06%)
Lithuanian: 21 (0.06%)
Slavic: 21 (0.06%)
Pennsylvania German: 18 (0.05%)
Swiss: 18 (0.05%)
Israeli: 18 (0.05%)
Belizean: 16 (0.05%)
Latvian: 13 (0.04%)
Ethiopian: 13 (0.04%)
Haitian: 13 (0.04%)
Finnish: 10 (0.03%)
Turkish: 10 (0.03%)
Yugoslavian: 10 (0.03%)
Basque: 8 (0.02%)
Croatian: 7 (0.02%)
Assyrian: 7 (0.02%)
Dutch West Indian: 7 (0.02%)
Brazilian: 5 (0.01%)
Icelander: 5 (0.01%)
Slovene: 4 (0.01%)
Most common places of birth for foreign-born residents (%):
Mexico
Camarillo:
25.9% (2,965)
California:
37.2% (3,881,193)
Philippines
Camarillo:
17.5% (2,002)
California:
7.8% (818,297)
India
Camarillo:
8.2% (943)
California:
5.2% (539,184)
Canada
Camarillo:
5.5% (630)
California:
1.2% (127,477)
Korea
Camarillo:
5.2% (600)
California:
3.0% (315,248)
China, excluding Hong Kong and Taiwan
Camarillo:
3.4% (384)
California:
6.6% (684,672)
Japan
Camarillo:
2.4% (269)
California:
1.0% (103,575)
Germany
Camarillo:
2.4% (269)
California:
0.7% (73,304)
Iran
Camarillo:
2.1% (236)
California:
2.0% (206,004)
England
Camarillo:
1.7% (198)
California:
0.6% (57,953)
Vietnam
Camarillo:
1.5% (173)
California:
4.9% (512,335)
Place of birth for U.S.-born residents:
This state: 39,905
Other state: 16,071
Northeast: 4,047
Midwest: 3,678
South: 4,938
West: 3,408
88.5% of Camarillo residents lived in the same house 1 years ago. Out of people who lived in different houses, 40.7% lived in this county. Out of people who lived in different counties, 68.1% lived in California.
Camarillo:
88.5%
State average:
88.9%
Education attainment for males 25 years and older:
No schooling: 704
Nursery to 4th grade: 267
5th and 6th grade: 345
7th and 8th grade: 0
9th grade: 0
10th grade: 46
11th grade: 622
12th grade, no diploma: 97
High school graduate (or equivalency): 3,179
Less than 1 year of college: 984
Some college more than 1 year, no degree: 3,309
Associate degree: 2,719
Bachelor's degree: 6,353
Master's degree: 2,875
Professional school degree: 1,464
Doctorate degree: 629
Education attainment for females 25 years and older:
No schooling: 616
Nursery to 4th grade: 422
5th and 6th grade: 180
7th and 8th grade: 65
9th grade: 42
10th grade: 0
11th grade: 97
12th grade, no diploma: 138
High school graduate (or equivalency): 4,511
Less than 1 year of college: 1,704
Some college more than 1 year, no degree: 3,694
Associate degree: 3,201
Bachelor's degree: 7,657
Master's degree: 3,077
Professional school degree: 627
Doctorate degree: 988
Housing units in structures:
One, detached: 16,060
One, attached: 5,256
Two: 443
3 or 4: 671
5 to 9: 900
10 to 19: 1,047
20 to 49: 748
50 or more: 1,461
Mobile homes: 833
Median worth of mobile homes: $412,200
Housing units lacking complete plumbing facilities in 2022: 1.0%
Housing units lacking complete kitchen facilities in 2022: 1.2%
House/condo owner moved in on average 11 years ago