Camas, WA (Washington) Houses and Residents
| Camas: | $708,379 |
| Washington: | $569,500 |
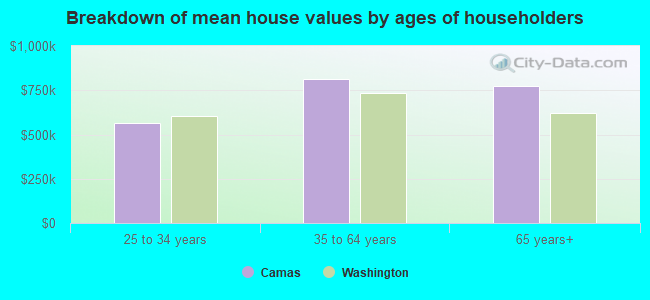
Mean price in 2022:
Detached houses: $819,978
Here: $819,978 State: $734,307 Townhouses or other attached units: $560,551
Here: $560,551 State: $657,697 Mobile homes: $66,671
Here: $66,671 State: $218,362
Total population: 21,220 (Urban population: 12,230, Rural population: 452 (all nonfarm))
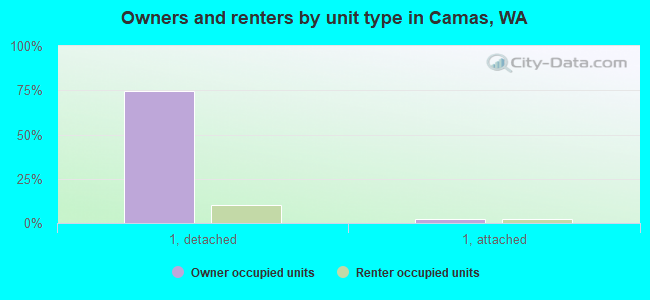
Houses: 9,783 (9,368 occupied: 7,483 owner occupied, 1,879 renter occupied)
| % of renters here: | 20% |
| State: | 36% |
Housing density: 897 houses/condos per square mile
Median price asked for vacant for-sale houses and condos in 2022: $3,680,222.
Median contract rent in 2022: $1,706 (lower quartile is $1,191, upper quartile is over $2,000)
Median rent asked for vacant for-rent units in 2022: $1,844
Median gross rent in Camas, WA in 2022: $1,811
Housing units in Camas with a mortgage: 5,396 (833 second mortgage, 32 home equity loan, 630 both second mortgage and home equity loan)
Houses without a mortgage: 99
Median household income for houses/condos with a mortgage: $155,512
Median household income for apartments without a mortgage: $115,163
Median monthly housing costs: $2,082
Compare current foreclosures in Camas, WA:
| Photo | Address | Area | Beds / Baths | Price | Details |
|---|---|---|---|---|---|

|
#1
NE Sitka Dr
Camas, WA 98607
|
2,312 sq. feet
|
2 baths 4 beds |
show details | |

|
#2
SE 33rd St
Camas, WA 98607
|
1,860 sq. feet
|
3 baths 4 beds |
show details | |

|
#3
NW Valley St
Camas, WA 98607
|
4,840 sq. feet
|
3 baths 4 beds |
show details | |

|
#4
SE 6th Ave
Camas, WA 98607
|
702 sq. feet
|
1 baths 2 beds |
show details | |

|
#5
NE 277th Ave
Camas, WA 98607
|
3,778 sq. feet
|
4 baths 4 beds |
show details | |

|
#6
NW 17th Cir
Camas, WA 98607
|
3,883 sq. feet
|
2 baths 3 beds |
show details | |

|
#7
NW 37th Ave
Camas, WA 98607
|
2,566 sq. feet
|
2 baths 4 beds |
show details | |

|
#8
NW Astor Ct
Camas, WA 98607
|
3,352 sq. feet
|
3 baths 3 beds |
show details | |

|
#9
NW Hill St
Camas, WA 98607
|
2,204 sq. feet
|
3 baths 4 beds |
show details | |

|
#10
NW Couch St
Camas, WA 98607
|
1,660 sq. feet
|
2 baths 3 beds |
show details |
| Photo | Address | Area | Beds / Baths | Price | Details |
|---|---|---|---|---|---|

|
#11
NW Valley St
Camas, WA 98607
|
3,125 sq. feet
|
3 baths 4 beds |
show details | |

|
#12
SE Sunrise Dr
Camas, WA 98607
|
3,933 sq. feet
|
3 baths 6 beds |
show details | |

|
#13
N 89th Loop
Camas, WA 98607
|
- sq. feet
|
- baths - beds |
show details | |

|
#14
NE Spruce Dr
Camas, WA 98607
|
- sq. feet
|
- baths - beds |
show details | |

|
#15
N Wright St
Camas, WA 98607
|
- sq. feet
|
- baths - beds |
show details | |

|
#16
NE 3rd Ave # 302
Camas, WA 98607
|
- sq. feet
|
- baths - beds |
show details | |

|
#17
NW 5th Ave
Camas, WA 98607
|
- sq. feet
|
- baths - beds |
show details | |

|
#18
SE 3rd Way # 216
Camas, WA 98607
|
- sq. feet
|
- baths - beds |
show details | |

|
#19
NE Sitka Dr
Camas, WA 98607
|
- sq. feet
|
- baths - beds |
show details | |

|
#20
SE 1st St, Apt 401
Camas, WA 98607
|
- sq. feet
|
- baths - beds |
show details |
| Photo | Address | Area | Beds / Baths | Price | Details |
|---|---|---|---|---|---|

|
#21
NE 94th St
Camas, WA 98607
|
- sq. feet
|
- baths - beds |
show details | |

|
#22
NE Tacoma Ct
Camas, WA 98607
|
- sq. feet
|
- baths - beds |
show details | |

|
#23
NE Laurel St
Camas, WA 98607
|
- sq. feet
|
- baths - beds |
show details | |

|
#24
NE 4th Ave Apt 7
Camas, WA 98607
|
- sq. feet
|
- baths - beds |
show details | |

|
#25
SE 1st St, Apt 233
Camas, WA 98607
|
- sq. feet
|
- baths - beds |
show details | |

|
#26
SE 34th St, Ste 106 Pmb 120
Camas, WA 98607
|
- sq. feet
|
- baths - beds |
show details | |

|
#27
NW 27th Ave
Camas, WA 98607
|
- sq. feet
|
- baths - beds |
show details | |

|
#28
NW 9th Ave
Camas, WA 98607
|
- sq. feet
|
- baths - beds |
show details | |

|
#29
NE 3rd Ave # 103
Camas, WA 98607
|
- sq. feet
|
- baths - beds |
show details | |

|
#30
NW Norwood St
Camas, WA 98607
|
- sq. feet
|
- baths - beds |
show details |
| Photo | Address | Area | Beds / Baths | Price | Details |
|---|---|---|---|---|---|

|
Check over 1 million property listings on Foreclosure.com!
|
browse all offers | |||
| Photo | Address | Area | Beds / Baths | Price | Details |
|---|

Latest news about housing in Camas, WA collected exclusively by city-data.com from local newspapers, TV, and radio stations

 | Camas house - But different SD - boundary exceptions (24 replies) |
| Is the Vancouver/Camas housing market finally starting to cool a bit? (16 replies) |
| Remodeling a home in Camas /East Vancouver (9 replies) |
| anyone know of houses to rent in camas? (3 replies) |
| rental houses in Camas (3 replies) |
| older homes/neighborhoods in Camas?? (6 replies) |
Median year apartment built: 1995
Household type by relationship:
Households: 27,051- Male householders: 4,711 (429 living alone), Female householders: 4,425 (935 living alone)
6,649 spouses (6,601 opposite-sex spouses), 445 unmarried partners, (422 opposite-sex unmarried partners), 9,284 children (8,561 natural, 350 adopted, 373 stepchildren), 262 grandchildren, 230 brothers or sisters, 252 parents, 12 foster children, 177 other relatives, 523 non-relatives
- In group quarters: 74
Size of family households: 2,730 2-persons, 1,555 3-persons, 1,959 4-persons, 664 5-persons, 264 6-persons, 70 7-or-more-persons.
Size of nonfamily households: 1,494 1-person, 311 2-persons, 49 3-persons.
6,051 married couples with children.
840 single-parent households (157 men, 683 women).
85.8% of residents of Camas speak English at home.
1.7% of residents speak Spanish at home (86% speak English very well, 10% speak English well, 4% don't speak English at all).
5.2% of residents speak other Indo-European language at home (80% speak English very well, 12% speak English well, 7% speak English not well, 1% don't speak English at all).
5.3% of residents speak Asian or Pacific Island language at home (68% speak English very well, 20% speak English well, 12% speak English not well).
0.6% of residents speak other language at home (92% speak English very well, 8% speak English well).
Foreign born population: 3,115 (11.5%)
(60.6% of them are naturalized citizens)
| Here: | 7.3 |
| State: | 6.5 |
| Here: | 4.7 |
| State: | 3.9 |
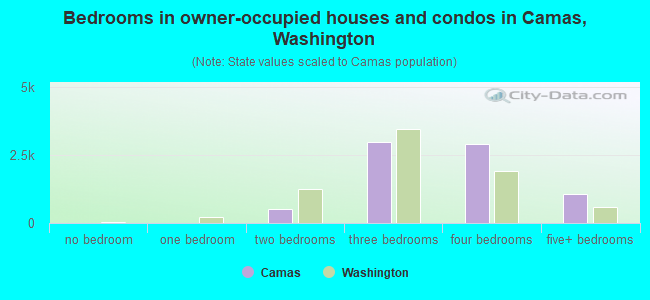
- Bedrooms in owner-occupied houses and condos in Camas, Washington
- 0no bedroom
- 151 bedroom
- 5042 bedrooms
- 2,9743 bedrooms
- 2,9224 bedrooms
- 1,0685+ bedrooms
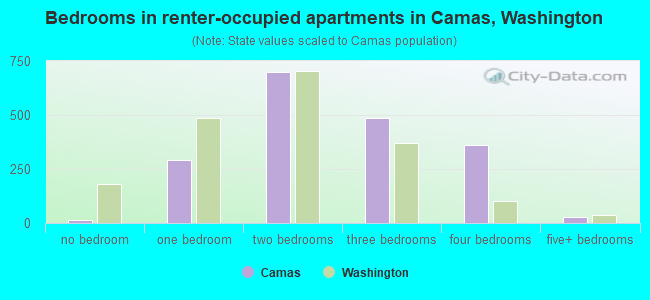
- Bedrooms in renter-occupied apartments in Camas, Washington
- 13no bedroom
- 2911 bedroom
- 6992 bedrooms
- 4873 bedrooms
- 3604 bedrooms
- 295+ bedrooms
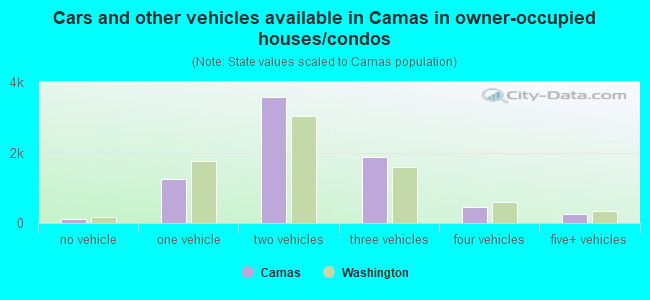
- Cars and other vehicles available in Camas in owner-occupied houses/condos
- 119no vehicle
- 1,2491 vehicle
- 3,5692 vehicles
- 1,8633 vehicles
- 4414 vehicles
- 2445+ vehicles
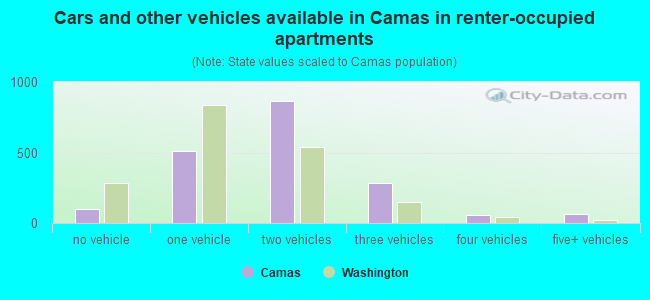
- Cars and other vehicles available in Camas in renter-occupied apartments
- 98no vehicle
- 5121 vehicle
- 8642 vehicles
- 2853 vehicles
- 564 vehicles
- 665+ vehicles
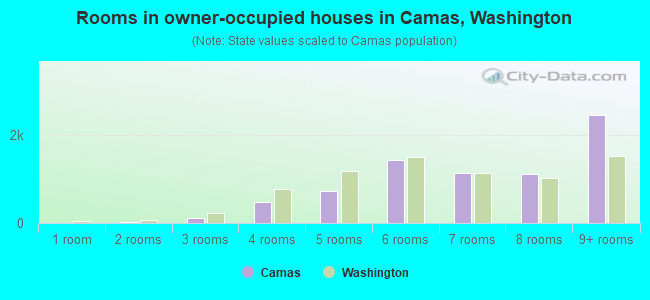
- Rooms in owner-occupied houses in Camas, Washington
- 01 room
- 152 rooms
- 1053 rooms
- 4674 rooms
- 7305 rooms
- 1,4416 rooms
- 1,1427 rooms
- 1,1248 rooms
- 2,4599+ rooms
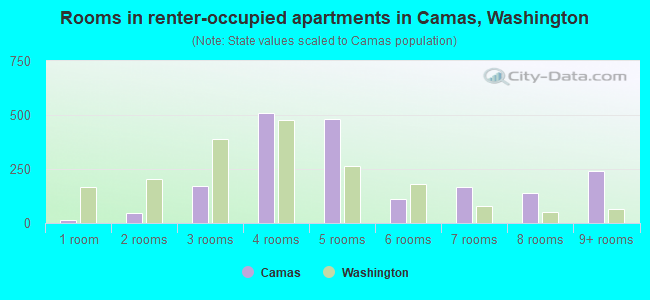
- Rooms in renter-occupied apartments in Camas, Washington
- 131 room
- 452 rooms
- 1713 rooms
- 5084 rooms
- 4825 rooms
- 1096 rooms
- 1687 rooms
- 1408 rooms
- 2439+ rooms
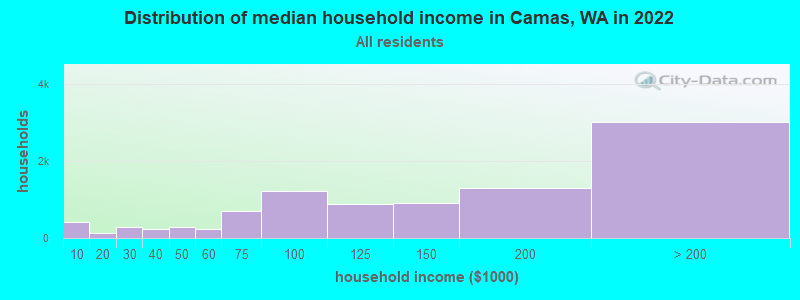
Camas, WA household income distribution

- 421Less than $10,000
- 118$10,000 to $19,999
- 291$20,000 to $29,999
- 246$30,000 to $39,999
- 280$40,000 to $49,999
- 224$50,000 to $59,999
- 697$60,000 to $74,999
- 1,214$75,000 to $99,999
- 884$100,000 to $124,999
- 902$125,000 to $149,999
- 1,292$150,000 to $199,999
- 3,008$200,000 or more
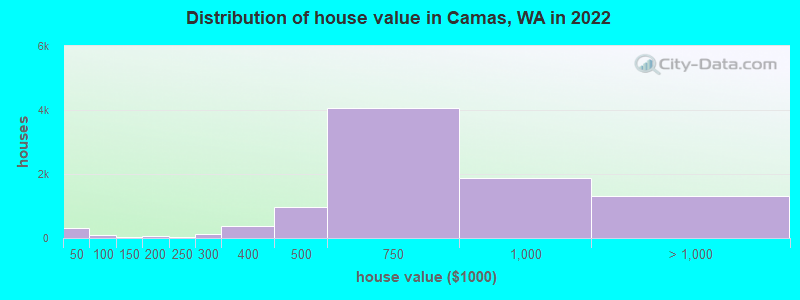
Home value of owner - occupied houses in 2022 in Camas, WA
-
- 162Less than $10,000
- 53$10,000 to $14,999
- 15$20,000 to $24,999
- 20$25,000 to $29,999
- 6$35,000 to $39,999
- 44$40,000 to $49,999
- 5$50,000 to $59,999
- 22$70,000 to $79,999
- 20$80,000 to $89,999
- 7$90,000 to $99,999
- 37$100,000 to $124,999
- 35$150,000 to $174,999
- 14$175,000 to $199,999
- 27$200,000 to $249,999
- 138$250,000 to $299,999
- 386$300,000 to $399,999
- 954$400,000 to $499,999
- 4,066$500,000 to $749,999
- 1,889$750,000 to $999,999
- 992$1,000,000 to $1,499,999
- 192$1,500,000 to $1,999,999
- 125$2,000,000 or more
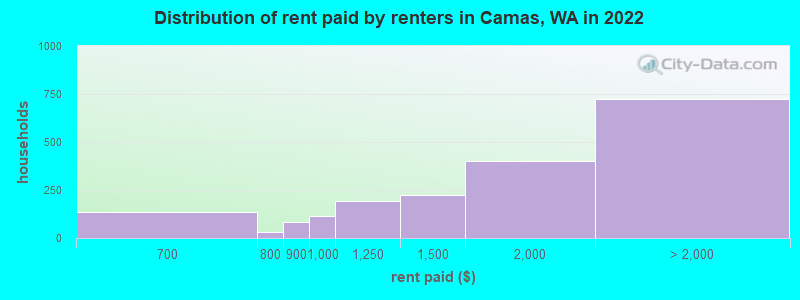
Rent paid by renters in 2022 in Camas, WA
-
- 134$600 to $649
- 29$750 to $799
- 84$800 to $899
- 111$900 to $999
- 195$1,000 to $1,249
- 225$1,250 to $1,499
- 399$1,500 to $1,999
- 443$2,000 to $2,499
- 118$2,500 to $2,999
- 14$3,000 to $3,499
- 71$3,500 or more
- 74No cash rent
Percentage of workers working in this county: 80.8%
Number of people working at home: 4,099 (31.4% of all workers)
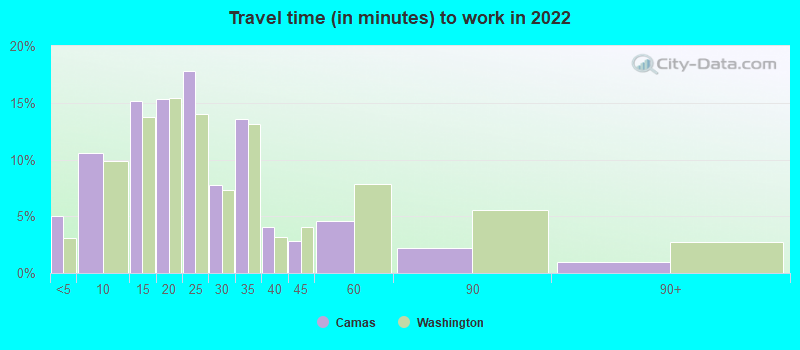
Travel time to work (commute)
- Less than 5 minutes: 501
- 5 to 9 minutes: 850
- 10 to 14 minutes: 1,178
- 15 to 19 minutes: 1,503
- 20 to 24 minutes: 1,861
- 25 to 29 minutes: 717
- 30 to 34 minutes: 917
- 35 to 39 minutes: 283
- 40 to 44 minutes: 310
- 45 to 59 minutes: 533
- 60 to 89 minutes: 452
- 90 or more minutes: 244
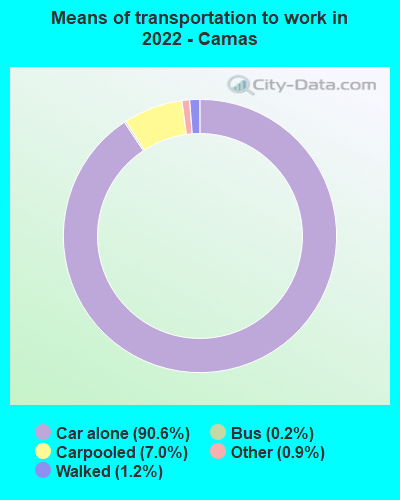
Means of transportation to work:
- Drove a car alone: 9,461 (66.1%)
- Carpooled: 760 (5.3%)
- Bus: 15 (0.1%)
- Taxi: 59 (0.4%)
- Bicycle: 4 (0.0%)
- Walked: 155 (1.1%)
- Worked at home: 4,099 (28.6%)
- Unemployment by race in 2022
- Unemployment rate for White non-Hispanic residents
- 3.0%Males
- 1.2%Females
- Unemployment rate for Asian residents
- 5.2%Females
- Unemployment rate for other race residents
- 11.5%Females
- Unemployment rate for two or more race residents
- 5.9%Males
- 1.1%Females
- Unemployment rate for Hispanic or Latino residents
- 9.0%Males
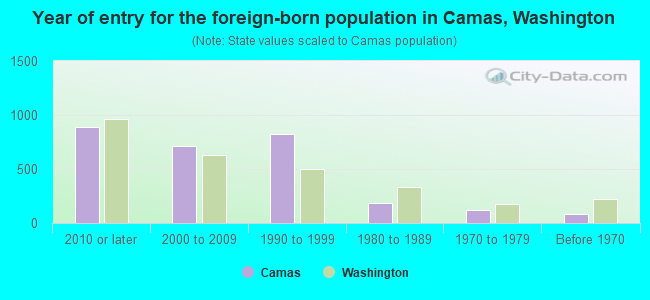
- Year of entry for the foreign-born population in Camas, Washington
- 8902010 or later
- 7162000 to 2009
- 8271990 to 1999
- 1831980 to 1989
- 1171970 to 1979
- 86Before 1970
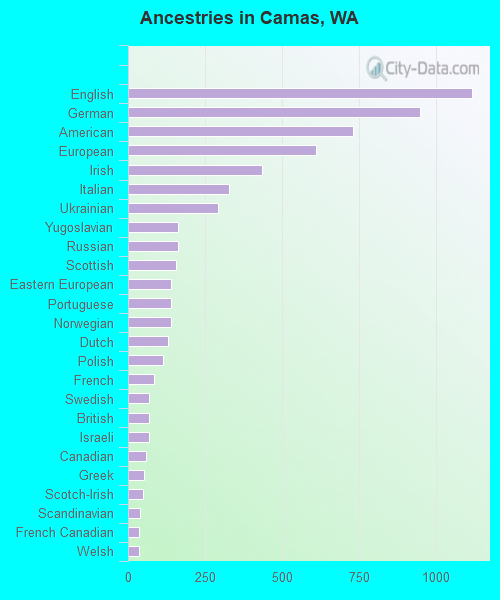
First ancestries reported:
- English: 1,118 (10.0%)
- German: 951 (8.5%)
- American: 731 (6.5%)
- European: 611 (5.5%)
- Irish: 436 (3.9%)
- Italian: 330 (3.0%)
- Ukrainian: 294 (2.6%)
- Yugoslavian: 163 (1.5%)
- Russian: 162 (1.4%)
- Scottish: 157 (1.4%)
- Eastern European: 141 (1.3%)
- Portuguese: 140 (1.3%)
- Norwegian: 140 (1.3%)
- Dutch: 129 (1.2%)
- Polish: 115 (1.0%)
- French: 86 (0.8%)
- Swedish: 69 (0.6%)
- British: 67 (0.6%)
- Israeli: 67 (0.6%)
- Canadian: 60 (0.5%)
- Greek: 52 (0.5%)
- Scotch-Irish: 50 (0.4%)
- Scandinavian: 39 (0.3%)
- French Canadian: 37 (0.3%)
- Welsh: 37 (0.3%)
- Finnish: 31 (0.3%)
- African: 31 (0.3%)
- Slavic: 25 (0.2%)
- Northern European: 24 (0.2%)
- Danish: 23 (0.2%)
- Romanian: 21 (0.2%)
- Lithuanian: 18 (0.2%)
- Czech: 17 (0.2%)
- Ethiopian: 15 (0.1%)
- Croatian: 11 (0.10%)
- Palestinian: 11 (0.10%)
- Iranian: 11 (0.10%)
- Serbian: 9 (0.08%)
- Moroccan: 8 (0.07%)
- Jordanian: 4 (0.04%)
- Bulgarian: 2 (0.02%)
Most common places of birth for foreign-born residents (%):
| Camas: | 18.8% (631) |
| Washington: | 7.4% (84,470) |
| Camas: | 17.0% (571) |
| Washington: | 8.9% (101,353) |
| Camas: | 8.0% (267) |
| Washington: | 3.1% (35,872) |
| Camas: | 5.8% (194) |
| Washington: | 6.3% (71,661) |
| Camas: | 4.8% (160) |
| Washington: | 4.3% (48,886) |
| Camas: | 4.5% (151) |
| Washington: | 4.1% (47,238) |
| Camas: | 4.4% (146) |
| Washington: | 0.1% (1,599) |
| Camas: | 4.1% (136) |
| Washington: | 1.5% (16,607) |
| Camas: | 3.5% (116) |
| Washington: | 1.9% (21,540) |
| Camas: | 3.4% (113) |
| Washington: | 5.4% (62,003) |
| Camas: | 3.4% (113) |
| Washington: | 21.1% (241,655) |
| Camas: | 2.8% (94) |
| Washington: | 1.5% (17,453) |
| Camas: | 2.3% (78) |
| Washington: | 0.3% (3,171) |
| Camas: | 2.1% (69) |
| Washington: | 0.3% (3,373) |
| Camas: | 1.9% (64) |
| Washington: | 0.3% (2,941) |
| Camas: | 1.8% (59) |
| Washington: | 0.3% (3,825) |
| Camas: | 1.7% (57) |
| Washington: | 0.3% (3,995) |
| Camas: | 1.6% (54) |
| Washington: | 0.2% (2,647) |
| Camas: | 1.6% (52) |
| Washington: | 0.2% (2,506) |
Place of birth for U.S.-born residents:
- This state: 8,350
- Other state: 15,131
- Northeast: 1,417
- Midwest: 1,732
- South: 1,770
- West: 10,212
88.2% of Camas residents lived in the same house 1 years ago.
Out of people who lived in different houses, 25.5% lived in this county.
Out of people who lived in different counties, 22.9% lived in Washington.
| Camas: | 88.2% |
| State average: | 85.2% |
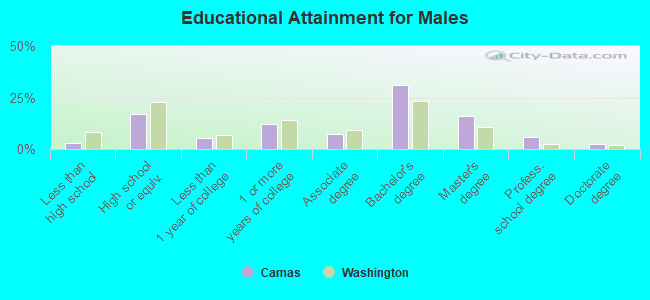
Education attainment for males 25 years and older:
- No schooling: 60
- Nursery to 4th grade: 7
- 5th and 6th grade: 3
- 7th and 8th grade: 15
- 9th grade: 28
- 10th grade: 40
- 11th grade: 26
- 12th grade, no diploma: 79
- High school graduate (or equivalency): 1,545
- Less than 1 year of college: 505
- Some college more than 1 year, no degree: 1,123
- Associate degree: 659
- Bachelor's degree: 2,882
- Master's degree: 1,475
- Professional school degree: 528
- Doctorate degree: 244
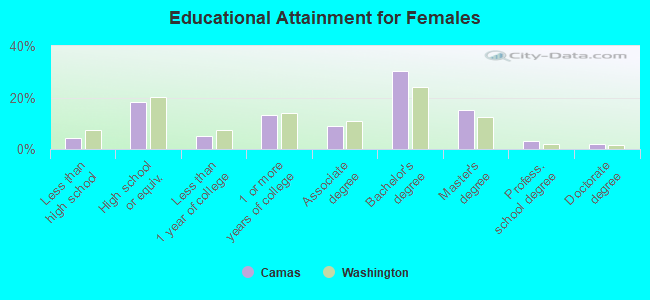
Education attainment for females 25 years and older:
- No schooling: 57
- Nursery to 4th grade: 0
- 5th and 6th grade: 0
- 7th and 8th grade: 22
- 9th grade: 65
- 10th grade: 55
- 11th grade: 40
- 12th grade, no diploma: 145
- High school graduate (or equivalency): 1,655
- Less than 1 year of college: 453
- Some college more than 1 year, no degree: 1,215
- Associate degree: 835
- Bachelor's degree: 2,774
- Master's degree: 1,376
- Professional school degree: 282
- Doctorate degree: 192
Housing units in structures:
- One, detached: 8,136
- One, attached: 746
- Two: 181
- 3 or 4: 62
- 5 to 9: 231
- 10 to 19: 78
- 20 to 49: 132
- 50 or more: 67
- Mobile homes: 146
Median worth of mobile homes: $14,322
Housing units lacking complete kitchen facilities in 2022: 2.0%
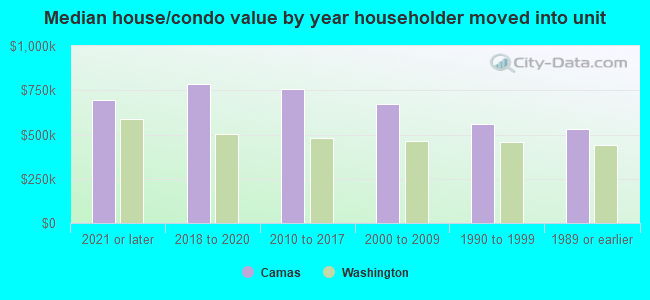
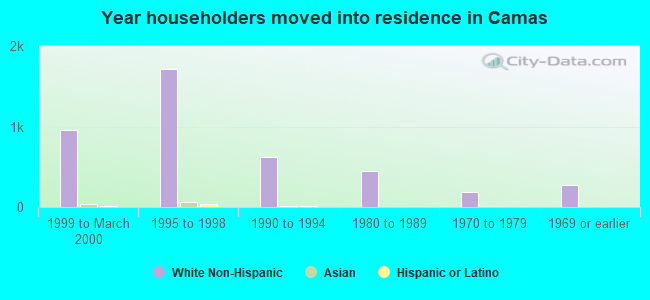
House/condo owner moved in on average 7 years ago
Renter moved in on average 4 years ago
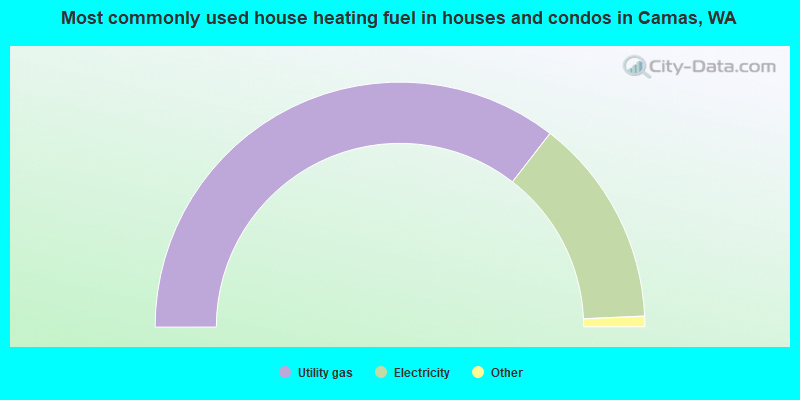
- 71.0%Utility gas
- 27.6%Electricity
- 0.7%Fuel oil, kerosene, etc.
- 0.6%Bottled, tank, or LP gas
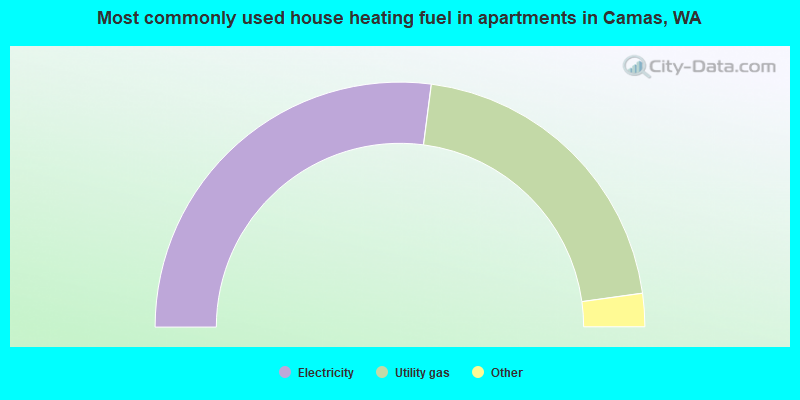
- 54.1%Electricity
- 41.5%Utility gas
- 2.0%Wood
- 1.5%Bottled, tank, or LP gas
- 1.0%Fuel oil, kerosene, etc.
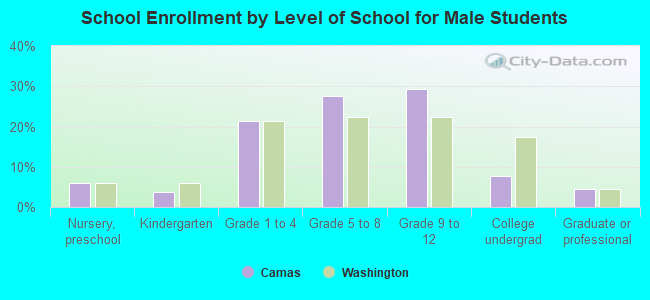
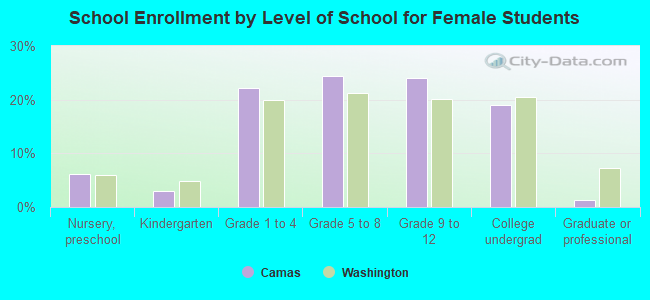
Private vs. public school enrollment:
| Here: | 5.5% |
| Washington: | 12.4% |
| Here: | 9.2% |
| Washington: | 9.2% |
| Here: | 9.8% |
| Washington: | 16.5% |