Housing density: 1,593 houses/condos per square mile
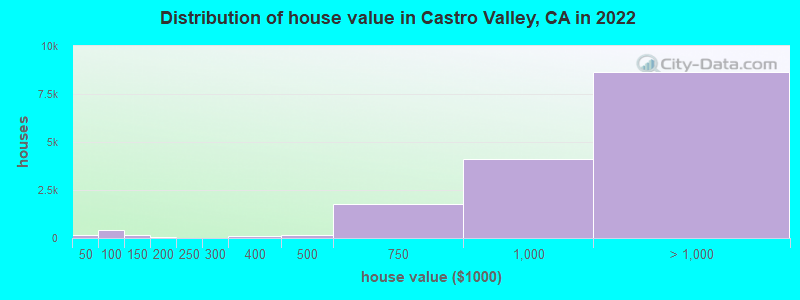
Median price asked for vacant for-sale houses and condos in 2022 in this county: $1,043,180.
Median contract rent in 2022: over $2,000 (lower quartile is $1,964, upper quartile is over $2,000)
Median rent asked for vacant for-rent units in 2022: $4,630
Median gross rent in Castro Valley, CA in 2022: over $2,000
Housing units in Castro Valley with a mortgage: 9,996 (1,518 second mortgage, 53 home equity loan, 1,356 both second mortgage and home equity loan) Houses without a mortgage: 338
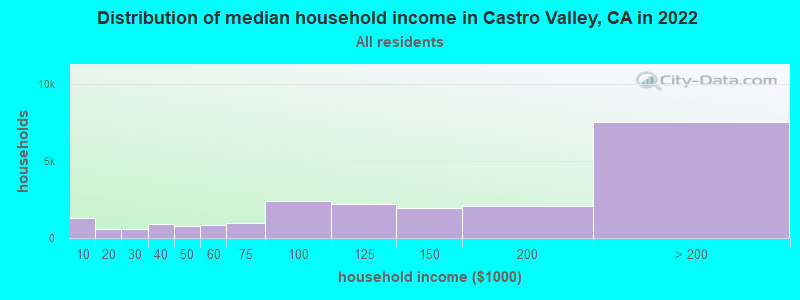
Median household income for houses/condos with a mortgage: $203,594
Median household income for apartments without a mortgage: $121,371
Median monthly housing costs: $2,418
Compare current foreclosures near Castro Valley, CA:
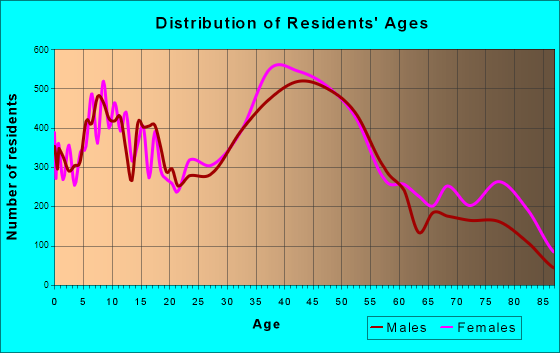
Size of family households: 6,122 2-persons, 3,647 3-persons, 4,736 4-persons, 1,595 5-persons, 860 6-persons, 122 7-or-more-persons.
Size of nonfamily households: 3,369 1-person, 1,462 2-persons, 200 3-persons.
9,536 married couples with children.
2,363 single-parent households (783 men, 1,580 women).
61.1% of residents of Castro Valley speak English at home.
8.9% of residents speak Spanish at home (69% speak English very well, 17% speak English well, 12% speak English not well, 3% don't speak English at all).
6.2% of residents speak other Indo-European language at home (77% speak English very well, 18% speak English well, 4% speak English not well, 1% don't speak English at all).
21.1% of residents speak Asian or Pacific Island language at home (48% speak English very well, 28% speak English well, 16% speak English not well, 8% don't speak English at all).
2.1% of residents speak other language at home (71% speak English very well, 19% speak English well, 9% speak English not well, 1% don't speak English at all).
Foreign born population: 16,587 (24.9%)
(70.3% of them are naturalized citizens)
Percentage of workers working in this county: 80.6% Number of people working at home: 7,477 (23.0% of all workers)
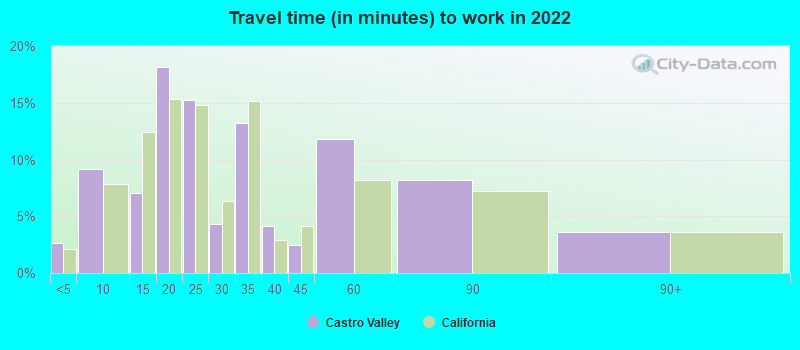
Travel time to work (commute)
Less than 5 minutes: 363
5 to 9 minutes: 997
10 to 14 minutes: 1,517
15 to 19 minutes: 2,484
20 to 24 minutes: 3,839
25 to 29 minutes: 2,489
30 to 34 minutes: 4,461
35 to 39 minutes: 860
40 to 44 minutes: 1,025
45 to 59 minutes: 2,568
60 to 89 minutes: 1,679
90 or more minutes: 907
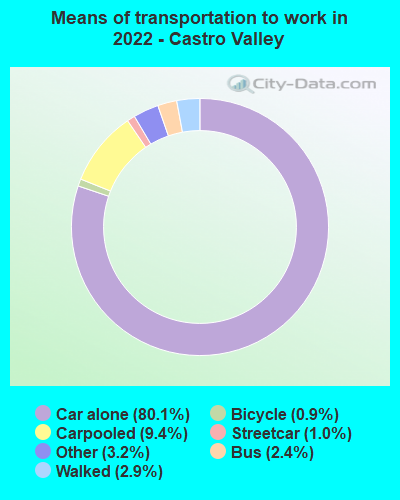
Means of transportation to work:
Drove a car alone: 8,897 (50.1%)
Carpooled: 1,091 (6.1%)
Bus: 227 (1.3%)
Subway or elevated rail: 86 (0.5%)
Long-distance train or commuter rail: 8 (0.0%)
Taxi: 372 (2.1%)
Bicycle: 114 (0.6%)
Walked: 328 (1.8%)
Worked at home: 7,477 (42.1%)
Unemployment by race in 2022
Unemployment rate for White non-Hispanic residents
4.1%Males
0.9%Females
Unemployment rate for Black residents
6.1%Males
0.9%Females
Unemployment rate for American Indian and Alaska Native residents
1.9%Males
17.6%Females
Unemployment rate for Asian residents
1.1%Males
8.6%Females
Unemployment rate for other race residents
1.3%Males
0.4%Females
Unemployment rate for two or more race residents
4.5%Males
3.2%Females
Unemployment rate for Hispanic or Latino residents
2.3%Males
5.8%Females
Year of entry for the foreign-born population in Castro Valley, California
4,7172010 or later
3,8672000 to 2009
3,7781990 to 1999
2,5511980 to 1989
1,9091970 to 1979
2,327Before 1970
First ancestries reported:
English: 1,087 (3.0%)
German: 927 (2.5%)
Irish: 745 (2.0%)
Italian: 719 (2.0%)
American: 697 (1.9%)
Portuguese: 648 (1.8%)
European: 597 (1.6%)
Russian: 425 (1.2%)
Greek: 402 (1.1%)
Nigerian: 394 (1.1%)
Northern European: 348 (1.0%)
Ukrainian: 224 (0.6%)
Swedish: 205 (0.6%)
Romanian: 187 (0.5%)
Arab: 176 (0.5%)
Sierra Leonean: 170 (0.5%)
Norwegian: 154 (0.4%)
Iranian: 149 (0.4%)
Ethiopian: 148 (0.4%)
Kenyan: 139 (0.4%)
Egyptian: 133 (0.4%)
French: 128 (0.4%)
Scandinavian: 124 (0.3%)
Scottish: 120 (0.3%)
Polish: 116 (0.3%)
Turkish: 102 (0.3%)
African: 87 (0.2%)
Eastern European: 87 (0.2%)
Dutch: 86 (0.2%)
Assyrian: 76 (0.2%)
French Canadian: 50 (0.1%)
Scotch-Irish: 49 (0.1%)
Czech: 39 (0.1%)
British: 38 (0.1%)
Afghan: 37 (0.1%)
South African: 35 (0.10%)
Palestinian: 33 (0.09%)
Swiss: 29 (0.08%)
Welsh: 29 (0.08%)
Lebanese: 28 (0.08%)
Croatian: 26 (0.07%)
Moroccan: 26 (0.07%)
Syrian: 20 (0.05%)
Icelander: 18 (0.05%)
Estonian: 18 (0.05%)
Yugoslavian: 18 (0.05%)
Armenian: 17 (0.05%)
Hungarian: 16 (0.04%)
Canadian: 16 (0.04%)
Lithuanian: 15 (0.04%)
Basque: 15 (0.04%)
Danish: 9 (0.02%)
Czechoslovakian: 6 (0.02%)
Trinidadian and Tobagonian: 6 (0.02%)
Brazilian: 3 (0.01%)
Australian: 3 (0.01%)
Most common places of birth for foreign-born residents (%):
China, excluding Hong Kong and Taiwan
Castro Valley:
27.5% (5,170)
California:
6.6% (684,672)
Mexico
Castro Valley:
9.4% (1,764)
California:
37.2% (3,881,193)
Philippines
Castro Valley:
6.4% (1,196)
California:
7.8% (818,297)
Vietnam
Castro Valley:
5.9% (1,117)
California:
4.9% (512,335)
India
Castro Valley:
5.1% (964)
California:
5.2% (539,184)
Hong Kong
Castro Valley:
4.4% (823)
California:
1.0% (105,215)
Nigeria
Castro Valley:
4.0% (756)
California:
0.3% (35,557)
Korea
Castro Valley:
3.0% (572)
California:
3.0% (315,248)
Japan
Castro Valley:
1.9% (366)
California:
1.0% (103,575)
Other Eastern Europe
Castro Valley:
1.7% (329)
California:
0.2% (17,699)
Peru
Castro Valley:
1.7% (316)
California:
0.7% (74,025)
Taiwan
Castro Valley:
1.6% (296)
California:
1.7% (176,274)
Ukraine
Castro Valley:
1.6% (293)
California:
0.6% (60,761)
Place of birth for U.S.-born residents:
This state: 39,652
Other state: 8,353
Northeast: 2,145
Midwest: 2,155
South: 1,451
West: 2,602
89.6% of Castro Valley residents lived in the same house 1 years ago. Out of people who lived in different houses, 39.2% lived in this county. Out of people who lived in different counties, 64.5% lived in California.
Castro Valley:
89.6%
State average:
88.9%
Education attainment for males 25 years and older:
No schooling: 109
Nursery to 4th grade: 0
5th and 6th grade: 281
7th and 8th grade: 69
9th grade: 130
10th grade: 0
11th grade: 92
12th grade, no diploma: 668
High school graduate (or equivalency): 2,979
Less than 1 year of college: 1,167
Some college more than 1 year, no degree: 2,818
Associate degree: 1,974
Bachelor's degree: 5,636
Master's degree: 4,712
Professional school degree: 403
Doctorate degree: 802
Education attainment for females 25 years and older:
No schooling: 357
Nursery to 4th grade: 345
5th and 6th grade: 841
7th and 8th grade: 524
9th grade: 0
10th grade: 93
11th grade: 204
12th grade, no diploma: 416
High school graduate (or equivalency): 3,119
Less than 1 year of college: 1,232
Some college more than 1 year, no degree: 2,965
Associate degree: 2,604
Bachelor's degree: 7,519
Master's degree: 4,084
Professional school degree: 847
Doctorate degree: 713
Housing units in structures:
One, detached: 16,720
One, attached: 1,859
Two: 659
3 or 4: 793
5 to 9: 131
10 to 19: 755
20 to 49: 913
50 or more: 464
Mobile homes: 682
Median worth of mobile homes: $89,600
House/condo owner moved in on average 14 years ago