Charleston, SC (South Carolina) Houses and Residents
Estimated median house or condo value in 2022: $496,700 (it was $137,800 in 2000 )
Charleston:
$496,700South Carolina:
$254,600
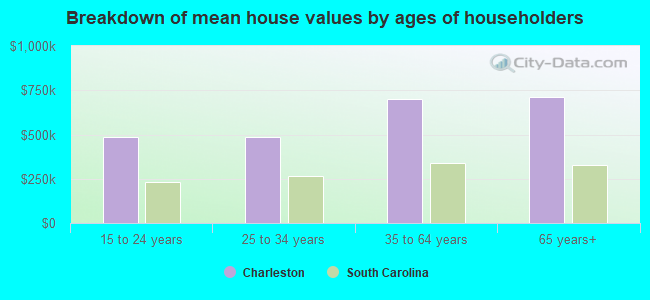
Lower value quartile - upper value quartile: $351,100 - $749,700Mean price in 2022: Detached houses: $679,016 Here:
$679,016State:
$368,255
Townhouses or other attached units: $532,773 Here:
$532,773State:
$292,023
In 2-unit structures: $625,765 Here:
$625,765State:
$358,283
In 3-to-4-unit structures: $478,508 Here:
$478,508State:
$230,702
In 5-or-more-unit structures: $546,666 Here:
$546,666State:
$326,361
Mobile homes: $70,893 Here:
$70,893State:
$102,531
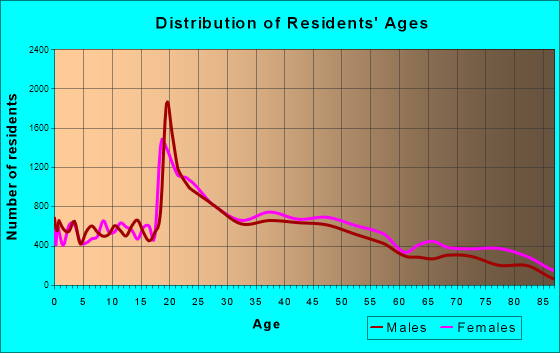
Total population: 130,113 (Urban population: 92,937, Rural population: 3,149 (27 farm, 3,122 nonfarm ))
Houses: 75,816 (68,377 occupied: 38,750 owner occupied, 29,627 renter occupied )
% of renters here:
43%State:
28%
Housing density: 782 houses/condos per square mile
Median price asked for vacant for-sale houses and condos in 2022: $828,925.
Median contract rent in 2022: $1,549 (lower quartile is $1,125, upper quartile is $1,947)
Median rent asked for vacant for-rent units in 2022: $1,343
Median gross rent in Charleston, SC in 2022: $1,636
Housing units in Charleston with a mortgage: 27,667 (2,388 second mortgage, 63 home equity loan, 1,921 both second mortgage and home equity loan )Houses without a mortgage: 544
Median household income for houses/condos with a mortgage: $132,887
Median household income for apartments without a mortgage: $92,378
Median monthly housing costs: $1,664
Data:
Median house or condo value ($)
Median house or condo value ($ change since 2000)
Median house or condo value ($) - White
Median house or condo value ($) - Black or African American
Median house or condo value ($) - Asian
Median house or condo value ($) - Hispanic or Latino
Median house or condo value ($) - American Indian and Alaska Native
Median house or condo value ($) - Multirace
Median house or condo value ($) - Other Race
Median price asked for mobile homes ($)
Household density (households per square mile)
Mean house or condo value by units in structure - 1, detached ($)
Mean house or condo value by units in structure - 1, attached ($)
Mean house or condo value by units in structure - 2 ($)
Mean house or condo value by units in structure by units in structure - 3 or 4 ($)
Mean house or condo value by units in structure - 5 or more ($)
Mean house or condo value by units in structure - Boat, RV, van, etc. ($)
Mean house or condo value by units in structure - Mobile home ($)
Median contract rent ($)
Median contract rent - Lower quartile ($)
Median contract rent - Upper quartile ($)
Median gross rent ($)
Urban houses (%)
Rural houses (%)
Houses occupied (%)
Houses occupied (% change since 2000)
Houses owner occupied (%)
Houses owner occupied (% change since 2000)
Houses renter occupied (%)
Houses renter occupied (% change since 2000)
Vacant housing units - For rent (%)
Vacant housing units - For rent (% change since 2000)
Vacant housing units - For sale only (%)
Vacant housing units - For sale only (% change since 2000)
Vacant housing units - Rented or sold, not occupied (%)
Vacant housing units - Rented or sold, not occupied (% change since 2000)
Vacant housing units - For seasonal, recreational, or occasional use (%)
Vacant housing units - For seasonal, recreational, or occasional use (% change since 2000)
Vacant housing units - For migrant workers (%)
Vacant housing units - For migrant workers (% change since 2000)
Vacant housing units - Other vacant (%)
Vacant housing units - Other vacant (% change since 2000)
Median monthly housing costs ($)
Median household income for houses/condos with a mortgage ($)
Median household income for houses/condos without a mortgage ($)
Median household income ($)
Median household income ($) - White
Median household income ($) - Black or African American
Median household income ($) - Asian
Median household income ($) - Hispanic or Latino
Median household income ($) - American Indian and Alaska Native
Median household income ($) - Multirace
Median household income ($) - Other Race
Mortgage status - with mortgage (%)
Mortgage status - with second mortgage (%)
Mortgage status - with home equity loan (%)
Mortgage status - with both second mortgage and home equity loan (%)
Mortgage status - without a mortgage (%)
Median year house/condo built
Median year apartment built
Household type by relationship - Male householder living alone (%)
Household type by relationship - Male householder not living alone (%)
Household type by relationship - Female householder living alone (%)
Household type by relationship - Female householder not living alone (%)
Household type by relationship - Opposite-Sex spouse (%)
Household type by relationship - Same-Sex spouse (%)
Household type by relationship - Opposite-Sex unmarried partner (%)
Household type by relationship - Same-Sex unmarried partner (%)
Household type by relationship - In group quarters (%)
Size of family households - 2-person household (%)
Size of family households - 3-person household (%)
Size of family households - 4-person household (%)
Size of family households - 5-person household (%)
Size of family households - 6-person household (%)
Size of family households - 7-or-more-person household (%)
Size of nonfamily households - 1-person household (%)
Size of nonfamily households - 2-person household (%)
Size of nonfamily households - 3-person household (%)
Size of nonfamily households - 4-person household (%)
Size of nonfamily households - 5-person household (%)
Size of nonfamily households - 6-person household (%)
Size of nonfamily households - 7-or-moreperson household (%)
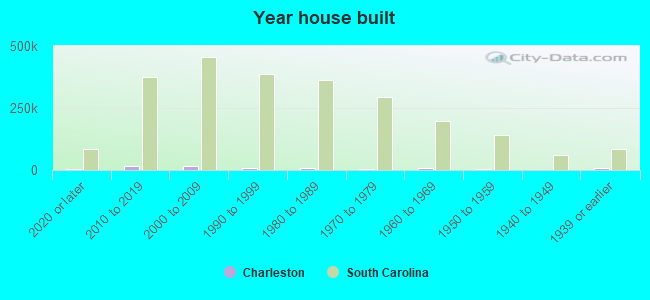
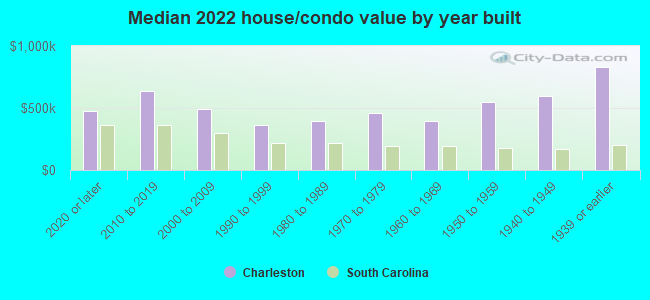
Year house built - Built 2010 or later (%)
Year house built - Built 2000 to 2009 (%)
Year house built - Built 1990 to 1999 (%)
Year house built - Built 1980 to 1989 (%)
Year house built - Built 1970 to 1979 (%)
Year house built - Built 1960 to 1969 (%)
Year house built - Built 1950 to 1959 (%)
Year house built - Built 1940 to 1949 (%)
Year house built - Built 1939 or earlier (%)
Median number of rooms in houses and condos
Median number of rooms in apartments
Median number of bedrooms in owner occupied houses
Mean number of bedrooms in owner occupied houses
Median number of bedrooms in renter occupied houses
Mean number of bedrooms in renter occupied houses
Median number of vehichles in owner occupied houses
Mean number of vehichles in owner occupied houses
Median number of vehichles in renter occupied houses
Mean number of vehichles in renter occupied houses
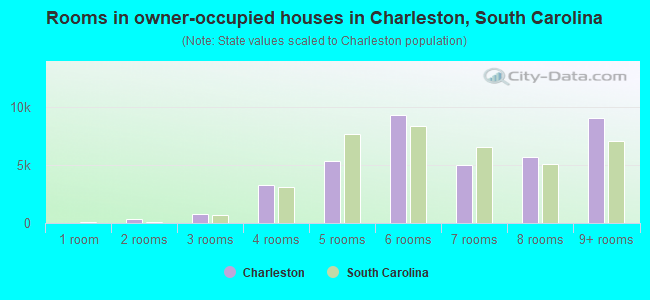
Rooms in owner-occupied houses - 1 room (%)
Rooms in owner-occupied houses - 2 rooms (%)
Rooms in owner-occupied houses - 3 rooms (%)
Rooms in owner-occupied houses - 4 rooms (%)
Rooms in owner-occupied houses - 5 rooms (%)
Rooms in owner-occupied houses - 6 rooms (%)
Rooms in owner-occupied houses - 7 rooms (%)
Rooms in owner-occupied houses - 8 rooms (%)
Rooms in owner-occupied houses - 9+ rooms (%)
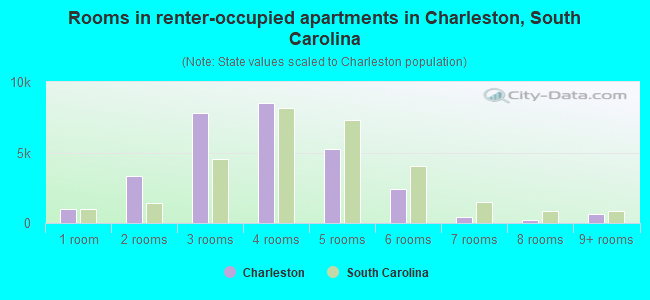
Rooms in renter-occupied houses - 1 room (%)
Rooms in renter-occupied houses - 2 rooms (%)
Rooms in renter-occupied houses - 3 rooms (%)
Rooms in renter-occupied houses - 4 rooms (%)
Rooms in renter-occupied houses - 5 rooms (%)
Rooms in renter-occupied houses - 6 rooms (%)
Rooms in renter-occupied houses - 7 rooms (%)
Rooms in renter-occupied houses - 8 rooms (%)
Rooms in renter-occupied houses - 9+ rooms (%)
Bedrooms in owner-occupied houses - no bedrooms (%)
Bedrooms in owner-occupied houses - 1 bedroom (%)
Bedrooms in owner-occupied houses - 2 bedrooms (%)
Bedrooms in owner-occupied houses - 3 bedrooms (%)
Bedrooms in owner-occupied houses - 4 bedrooms (%)
Bedrooms in owner-occupied houses - 5+ bedrooms (%)
Bedrooms in renter-occupied houses - no bedrooms (%)
Bedrooms in renter-occupied houses - 1 bedroom (%)
Bedrooms in renter-occupied houses - 2 bedrooms (%)
Bedrooms in renter-occupied houses - 3 bedrooms (%)
Bedrooms in renter-occupied houses - 4 bedrooms (%)
Bedrooms in renter-occupied houses - 5+ bedrooms (%)
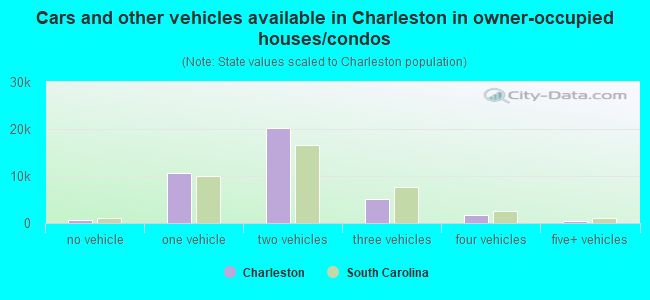
Vehicles available in owner-occupied houses - no vehicle available (%)
Vehicles available in owner-occupied houses - 1 vehicle available(%)
Vehicles available in owner-occupied houses - 2 Vehicles available (%)
Vehicles available in owner-occupied houses - 3 Vehicles available (%)
Vehicles available in owner-occupied houses - 4 Vehicles available (%)
Vehicles available in owner-occupied houses - 5+ Vehicles available (%)
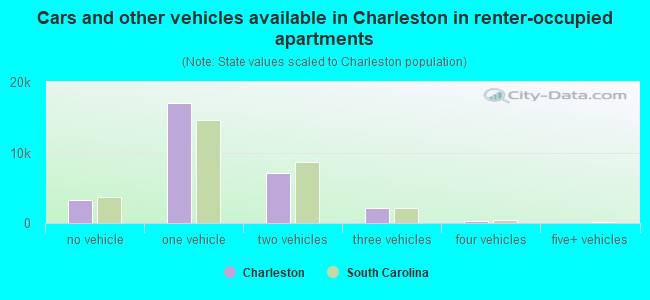
Vehicles available in renter-occupied houses - no vehicle available (%)
Vehicles available in renter-occupied houses - 1 vehicle available (%)
Vehicles available in renter-occupied houses - 2 Vehicles available (%)
Vehicles available in renter-occupied houses - 3 Vehicles available (%)
Vehicles available in renter-occupied houses - 4 Vehicles available (%)
Vehicles available in renter-occupied houses - 5+ Vehicles available (%)
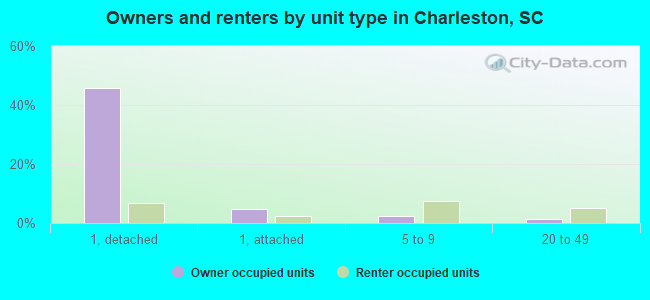
Housing units in structures - 1, detached (%)
Housing units in structures - 1, attached (%)
Housing units in structures - 2 (%)
Housing units in structures - 3 or 4 (%)
Housing units in structures - 5 to 9 (%)
Housing units in structures - 10 to 19 (%)
Housing units in structures - 20 to 49 (%)
Housing units in structures - 50 or more (%)
Housing units in structures - Mobile home (%)
Housing units in structures - Boat, RV, van, etc. (%)
Housing units in structures - Owners - 1, detached (%)
Housing units in structures - Owners - 1, attached (%)
Housing units in structures - Owners - 2 (%)
Housing units in structures - Owners - 3 or 4 (%)
Housing units in structures - Owners - 5 to 9 (%)
Housing units in structures - Owners - 10 to 19 (%)
Housing units in structures - Owners - 20 to 49 (%)
Housing units in structures - Owners - 50 or more (%)
Housing units in structures - Owners - Mobile home (%)
Housing units in structures - Owners - Boat, RV, van, etc. (%)
Housing units in structures - Renters - 1, detached (%)
Housing units in structures - Renters - 1, attached (%)
Housing units in structures - Renters - 2 (%)
Housing units in structures - Renters - 3 or 4 (%)
Housing units in structures - Renters - 5 to 9 (%)
Housing units in structures - Renters - 10 to 19 (%)
Housing units in structures - Renters - 20 to 49 (%)
Housing units in structures - Renters - 50 or more (%)
Housing units in structures - Renters - Mobile home (%)
Housing units in structures - Renters - Boat, RV, van, etc. (%)
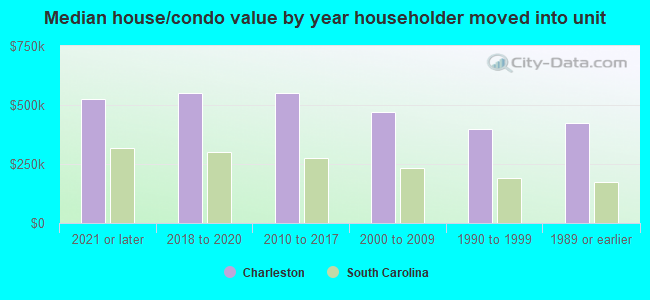
House/condo owner moved in on average (years ago)
Renter moved in on average (years ago)
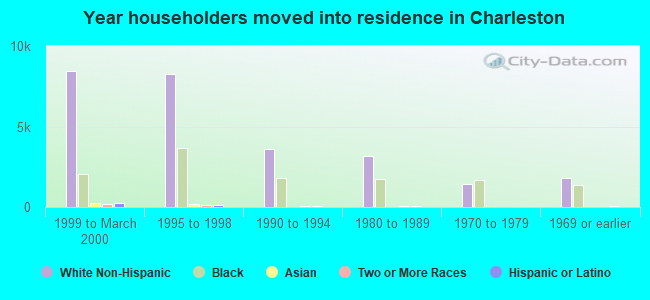
Year householder moved into unit - Moved in 1999 to March 2000 (%)
Year householder moved into unit - Moved in 1999 to March 2000 (%) - White
Year householder moved into unit - Moved in 1999 to March 2000 (%) - Black or African American
Year householder moved into unit - Moved in 1999 to March 2000 (%) - Asian
Year householder moved into unit - Moved in 1999 to March 2000 (%) - Hispanic or Latino
Year householder moved into unit - Moved in 1999 to March 2000 (%) - American Indian and Alaska Native
Year householder moved into unit - Moved in 1999 to March 2000 (%) - Multirace
Year householder moved into unit - Moved in 1999 to March 2000 (%) - Other Race
Year householder moved into unit - Moved in 1995 to 1998 (%)
Year householder moved into unit - Moved in 1995 to 1998 (%) - White
Year householder moved into unit - Moved in 1995 to 1998 (%) - Black or African American
Year householder moved into unit - Moved in 1995 to 1998 (%) - Asian
Year householder moved into unit - Moved in 1995 to 1998 (%) - Hispanic or Latino
Year householder moved into unit - Moved in 1995 to 1998 (%) - American Indian and Alaska Native
Year householder moved into unit - Moved in 1995 to 1998 (%) - Multirace
Year householder moved into unit - Moved in 1995 to 1998 (%) - Other Race
Year householder moved into unit - Moved in 1990 to 1994 (%)
Year householder moved into unit - Moved in 1990 to 1994 (%) - White
Year householder moved into unit - Moved in 1990 to 1994 (%) - Black or African American
Year householder moved into unit - Moved in 1990 to 1994 (%) - Asian
Year householder moved into unit - Moved in 1990 to 1994 (%) - Hispanic or Latino
Year householder moved into unit - Moved in 1990 to 1994 (%) - American Indian and Alaska Native
Year householder moved into unit - Moved in 1990 to 1994 (%) - Multirace
Year householder moved into unit - Moved in 1990 to 1994 (%) - Other Race
Year householder moved into unit - Moved in 1980 to 1989 (%)
Year householder moved into unit - Moved in 1980 to 1989 (%) - White
Year householder moved into unit - Moved in 1980 to 1989 (%) - Black or African American
Year householder moved into unit - Moved in 1980 to 1989 (%) - Asian
Year householder moved into unit - Moved in 1980 to 1989 (%) - Hispanic or Latino
Year householder moved into unit - Moved in 1980 to 1989 (%) - American Indian and Alaska Native
Year householder moved into unit - Moved in 1980 to 1989 (%) - Multirace
Year householder moved into unit - Moved in 1980 to 1989 (%) - Other Race
Year householder moved into unit - Moved in 1970 to 1979 (%)
Year householder moved into unit - Moved in 1970 to 1979 (%) - White
Year householder moved into unit - Moved in 1970 to 1979 (%) - Black or African American
Year householder moved into unit - Moved in 1970 to 1979 (%) - Asian
Year householder moved into unit - Moved in 1970 to 1979 (%) - Hispanic or Latino
Year householder moved into unit - Moved in 1970 to 1979 (%) - American Indian and Alaska Native
Year householder moved into unit - Moved in 1970 to 1979 (%) - Multirace
Year householder moved into unit - Moved in 1970 to 1979 (%) - Other Race
Year householder moved into unit - Moved in 1969 or earlier (%)
Year householder moved into unit - Moved in 1969 or earlier (%) - White
Year householder moved into unit - Moved in 1969 or earlier (%) - Black or African American
Year householder moved into unit - Moved in 1969 or earlier (%) - Asian
Year householder moved into unit - Moved in 1969 or earlier (%) - Hispanic or Latino
Year householder moved into unit - Moved in 1969 or earlier (%) - American Indian and Alaska Native
Year householder moved into unit - Moved in 1969 or earlier (%) - Multirace
Year householder moved into unit - Moved in 1969 or earlier (%) - Other Race
Housing units lacking complete plumbing facilities (%)
Housing units lacking complete kitchen facilities (%)
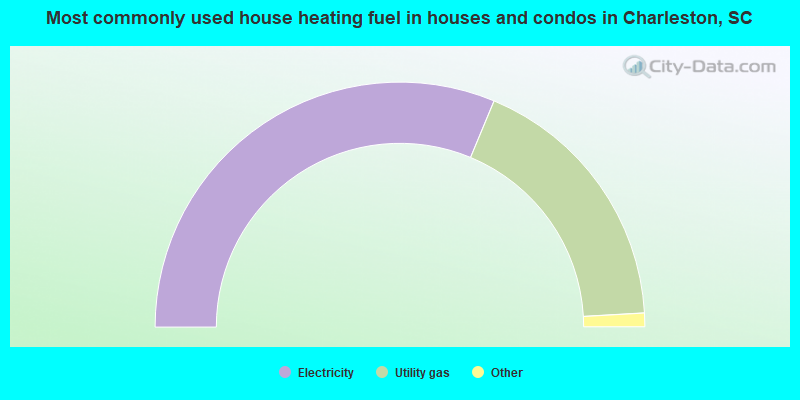
House heating fuel used in houses and condos - Utility gas (%)
House heating fuel used in houses and condos - Bottled, tank, or LP gas (%)
House heating fuel used in houses and condos - Electricity (%)
House heating fuel used in houses and condos - Fuel oil, kerosene, etc. (%)
House heating fuel used in houses and condos - Coal or coke (%)
House heating fuel used in houses and condos - Wood (%)
House heating fuel used in houses and condos - Solar energy (%)
House heating fuel used in houses and condos - Other fuel (%)
House heating fuel used in houses and condos - No fuel used (%)
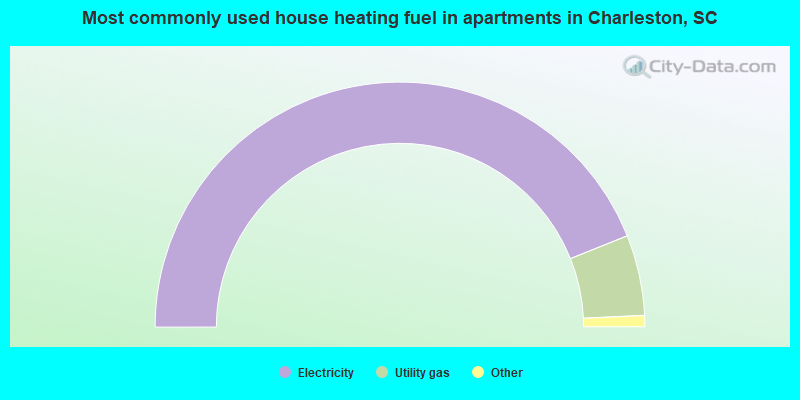
House heating fuel used in apartments - Utility gas (%)
House heating fuel used in apartments - Bottled, tank, or LP gas (%)
House heating fuel used in apartments - Electricity (%)
House heating fuel used in apartments - Fuel oil, kerosene, etc. (%)
House heating fuel used in apartments - Coal or coke (%)
House heating fuel used in apartments - Wood (%)
House heating fuel used in apartments - Solar energy (%)
House heating fuel used in apartments - Other fuel (%)
House heating fuel used in apartments - No fuel used (%)
Latest news about housing in Charleston, SC collected exclusively by city-data.com from local newspapers, TV, and radio stations
Median year house/condo built: 1999Median year apartment built: 1995Household type by relationship:
Households: 153,743
Male householders: 29,868 (8,793 living alone ), Female householders: 38,509 (16,197 living alone )27,288 spouses (27,009 opposite-sex spouses ), 4,944 unmarried partners , (4,430 opposite-sex unmarried partners ), 31,136 children (29,541 natural , 505 adopted , 1,090 stepchildren ), 1,131 grandchildren , 1,275 brothers or sisters , 1,403 parents , 0 foster children , 2,210 other relatives , 10,461 non-relatives In group quarters: 5,518
Size of family households: 20,736 2-persons , 5,600 3-persons , 5,494 4-persons , 1,269 5-persons , 448 6-persons , 605 7-or-more-persons .
Size of nonfamily households: 24,990 1-person , 7,656 2-persons , 1,017 3-persons , 513 4-persons , 49 6-persons .
18,355 married couples with children. single-parent households (771 men , 3,623 women ).
92.6% of residents of Charleston speak English at home. of residents speak Spanish at home (71% speak English very well , 18% speak English well , 10% speak English not well , 1% don't speak English at all ).of residents speak other Indo-European language at home (76% speak English very well , 17% speak English well , 6% speak English not well , 1% don't speak English at all ).of residents speak Asian or Pacific Island language at home (74% speak English very well , 20% speak English well , 7% speak English not well ).of residents speak other language at home (60% speak English very well , 34% speak English well , 7% speak English not well ).
Foreign born population: 8,401 (5.5%)of them are naturalized citizens )
Median number of rooms in houses and condos:
Median number of rooms in apartments
Owner-occupied Renter-occupied
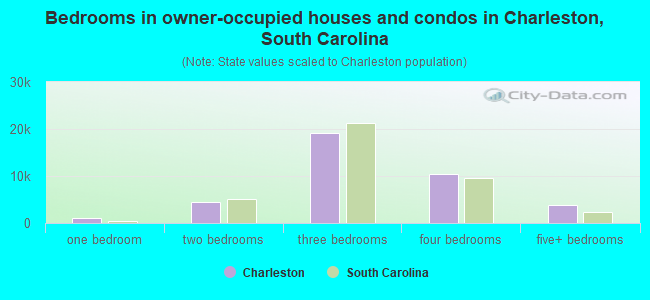
Bedrooms in owner-occupied houses and condos in Charleston, South Carolina
0 no bedroom 1,056 1 bedroom 4,491 2 bedrooms 19,130 3 bedrooms 10,323 4 bedrooms 3,750 5+ bedrooms
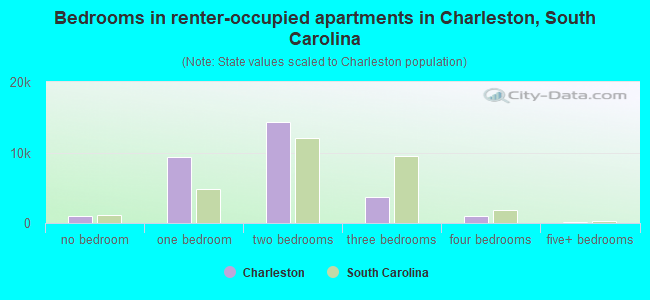
Bedrooms in renter-occupied apartments in Charleston, South Carolina
1,023 no bedroom 9,353 1 bedroom 14,391 2 bedrooms 3,689 3 bedrooms 1,008 4 bedrooms 163 5+ bedrooms
Owner-occupied Renter-occupied
Rooms in owner-occupied houses in Charleston, South Carolina
0 1 room 342 2 rooms 750 3 rooms 3,254 4 rooms 5,375 5 rooms 9,288 6 rooms 5,020 7 rooms 5,670 8 rooms 9,051 9+ rooms
Rooms in renter-occupied apartments in Charleston, South Carolina
1,023 1 room 3,352 2 rooms 7,831 3 rooms 8,491 4 rooms 5,247 5 rooms 2,438 6 rooms 408 7 rooms 180 8 rooms 657 9+ rooms
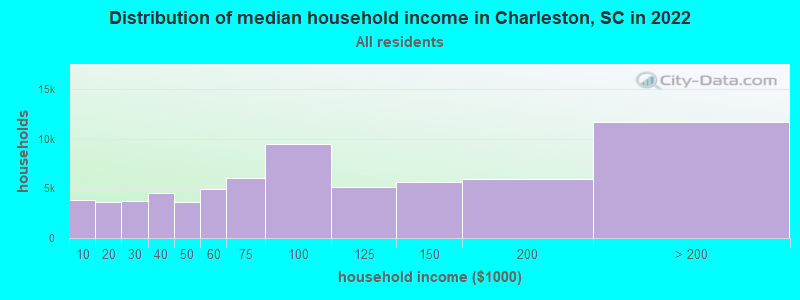
Charleston, SC household income distribution 3,886 Less than $10,0003,674 $10,000 to $19,9993,693 $20,000 to $29,9994,559 $30,000 to $39,9993,639 $40,000 to $49,9994,929 $50,000 to $59,9996,097 $60,000 to $74,9999,526 $75,000 to $99,9995,136 $100,000 to $124,9995,624 $125,000 to $149,9995,905 $150,000 to $199,99911,709 $200,000 or more
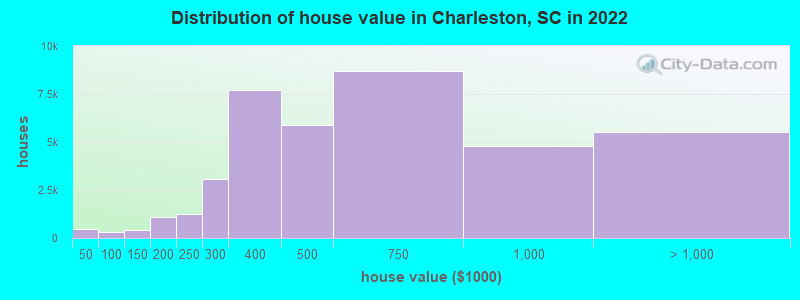
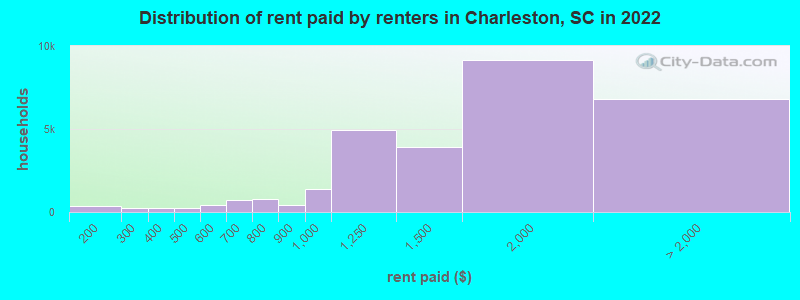
Home value of owner - occupied houses in 2022 in Charleston, SC 172 Less than $10,00028 $10,000 to $14,9996 $15,000 to $19,99987 $20,000 to $24,99912 $25,000 to $29,99986 $30,000 to $34,99941 $35,000 to $39,99929 $40,000 to $49,99945 $50,000 to $59,999193 $60,000 to $69,99916 $70,000 to $79,99916 $80,000 to $89,99919 $90,000 to $99,999268 $100,000 to $124,999144 $125,000 to $149,999649 $150,000 to $174,999457 $175,000 to $199,9991,247 $200,000 to $249,9993,060 $250,000 to $299,9997,690 $300,000 to $399,9995,862 $400,000 to $499,9998,702 $500,000 to $749,9994,786 $750,000 to $999,9992,439 $1,000,000 to $1,499,9991,066 $1,500,000 to $1,999,9992,021 $2,000,000 or moreRent paid by renters in 2022 in Charleston, SC 24 Less than $100345 $150 to $199224 $200 to $24976 $300 to $349183 $350 to $399140 $400 to $44986 $450 to $499351 $500 to $54994 $550 to $599644 $600 to $64955 $650 to $699771 $750 to $799414 $800 to $8991,393 $900 to $9994,957 $1,000 to $1,2493,922 $1,250 to $1,4999,148 $1,500 to $1,9993,752 $2,000 to $2,499839 $2,500 to $2,999265 $3,000 to $3,4991,469 $3,500 or more475 No cash rent
Percentage of workers working in this county: 88.7%Number of people working at home: 18,015 (20.7% of all workers )
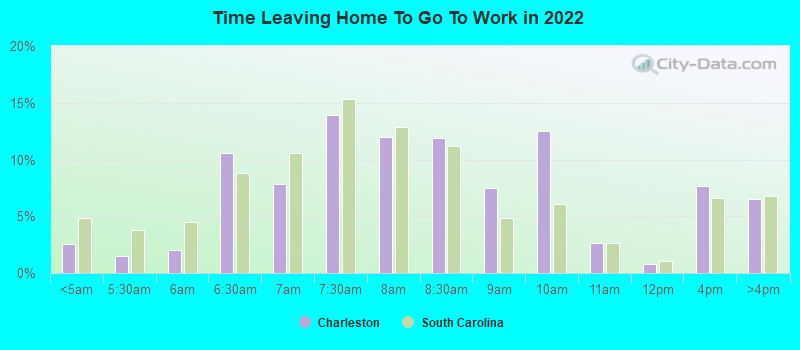
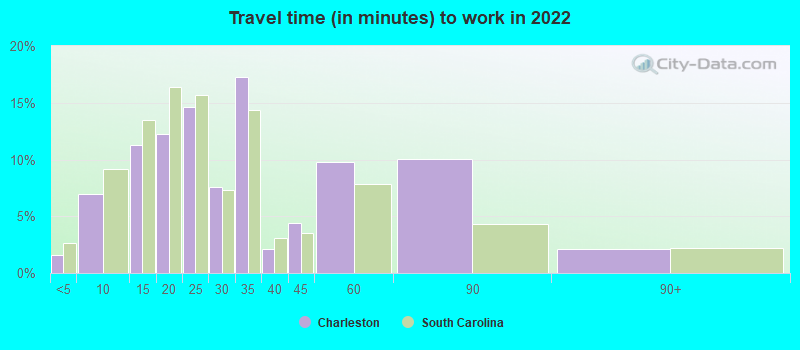
Travel time to work (commute)
Less than 5 minutes: 1,2345 to 9 minutes: 7,56810 to 14 minutes: 12,31015 to 19 minutes: 12,26020 to 24 minutes: 9,34425 to 29 minutes: 5,07930 to 34 minutes: 10,20835 to 39 minutes: 1,08240 to 44 minutes: 2,57645 to 59 minutes: 3,80660 to 89 minutes: 2,38490 or more minutes: 1,008
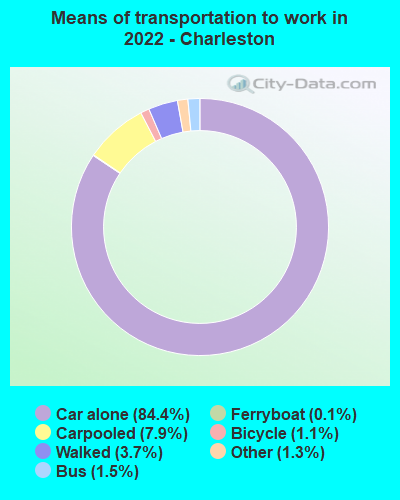
Means of transportation to work:
Drove a car alone: 83,636 (71.4%)Carpooled: 7,817 (6.7%)Bus : 1,497 (1.3%)Ferryboat: 134 (0.1%)Taxi: 1,312 (1.1%)Bicycle: 1,084 (0.9%)Walked: 3,662 (3.1%)Worked at home: 18,015 (15.4%)
Unemployment by race in 2022
Unemployment rate for White non-Hispanic residents 1.3% Males2.1% FemalesUnemployment rate for Black residents 3.5% Males13.3% FemalesUnemployment rate for American Indian and Alaska Native residents 43.1% FemalesUnemployment rate for Asian residents 3.1% Males6.5% FemalesUnemployment rate for other race residents 0.5% Males4.7% FemalesUnemployment rate for two or more race residents 10.5% Males6.3% FemalesUnemployment rate for Hispanic or Latino residents 5.4% Males3.5% Females
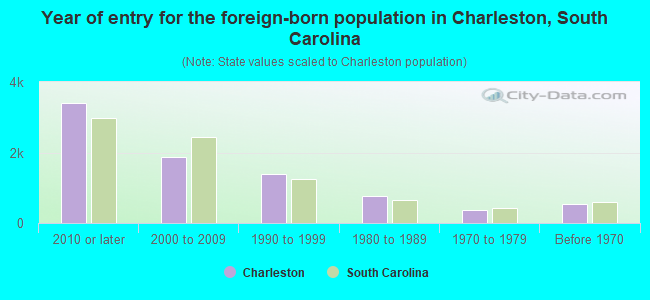
Year of entry for the foreign-born population in Charleston, South Carolina
3,394 2010 or later 1,859 2000 to 2009 1,389 1990 to 1999 779 1980 to 1989 378 1970 to 1979 552 Before 1970
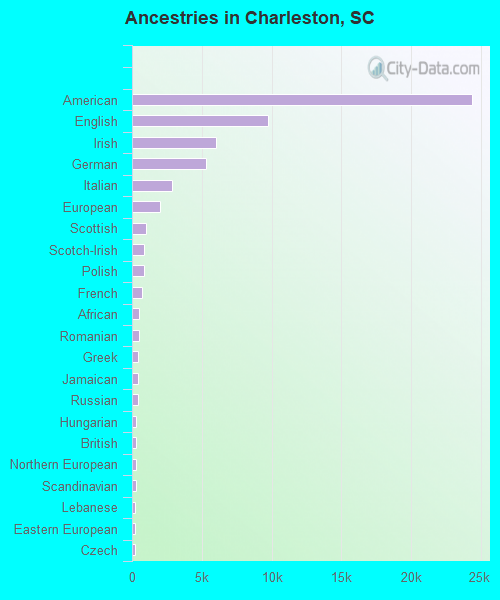
First ancestries reported:
American: 24,346 (28.2%)
English: 9,758 (11.3%)
Irish: 6,007 (7.0%)
German: 5,298 (6.1%)
Italian: 2,840 (3.3%)
European: 1,980 (2.3%)
Scottish: 974 (1.1%)
Scotch-Irish: 894 (1.0%)
Polish: 894 (1.0%)
French: 730 (0.8%)
African: 526 (0.6%)
Romanian: 505 (0.6%)
Greek: 452 (0.5%)
Jamaican: 415 (0.5%)
Russian: 399 (0.5%)
Hungarian: 314 (0.4%)
British: 314 (0.4%)
Northern European: 307 (0.4%)
Scandinavian: 295 (0.3%)
Lebanese: 250 (0.3%)
Eastern European: 228 (0.3%)
Czech: 227 (0.3%)
Welsh: 213 (0.2%)
Swedish: 212 (0.2%)
South African: 212 (0.2%)
Norwegian: 190 (0.2%)
French Canadian: 183 (0.2%)
Palestinian: 170 (0.2%)
Ukrainian: 166 (0.2%)
Dutch: 134 (0.2%)
Finnish: 113 (0.1%)
Nigerian: 98 (0.1%)
Slovak: 94 (0.1%)
Austrian: 85 (0.10%)
Egyptian: 84 (0.10%)
Turkish: 78 (0.09%)
Canadian: 70 (0.08%)
Australian: 59 (0.07%)
Iranian: 58 (0.07%)
Portuguese: 53 (0.06%)
Danish: 53 (0.06%)
Trinidadian and Tobagonian: 49 (0.06%)
Ethiopian: 40 (0.05%)
Lithuanian: 39 (0.05%)
Albanian: 36 (0.04%)
Brazilian: 33 (0.04%)
Swiss: 32 (0.04%)
Armenian: 27 (0.03%)
Alsatian: 26 (0.03%)
Czechoslovakian: 23 (0.03%)
Arab: 23 (0.03%)
Jordanian: 20 (0.02%)
Serbian: 19 (0.02%)
Pennsylvania German: 18 (0.02%)
Croatian: 15 (0.02%)
Slavic: 14 (0.02%)
Barbadian: 12 (0.01%)
Syrian: 10 (0.01%)
Cajun: 8 (0.01%)
Belgian: 8 (0.01%)
Basque: 8 (0.01%)
Israeli: 5 (0.01%)
Icelander: 5 (0.01%)
Haitian: 5 (0.01%)
Most common places of birth for foreign-born residents (%): Mexico Charleston:
9.7% (794)South Carolina:
22.5% (60,774)
India Charleston:
6.9% (561)South Carolina:
6.8% (18,307)
China, excluding Hong Kong and Taiwan Charleston:
4.8% (390)South Carolina:
3.2% (8,721)
Germany Charleston:
4.6% (371)South Carolina:
3.7% (9,982)
Jamaica Charleston:
3.6% (291)South Carolina:
2.6% (7,073)
Canada Charleston:
3.6% (290)South Carolina:
3.0% (8,193)
Asia, n.e.c. Charleston:
3.4% (275)South Carolina:
0.2% (457)
Romania Charleston:
3.3% (272)South Carolina:
0.6% (1,507)
Argentina Charleston:
3.3% (267)South Carolina:
0.5% (1,414)
Venezuela Charleston:
3.2% (262)South Carolina:
1.4% (3,822)
Philippines Charleston:
2.8% (229)South Carolina:
4.1% (11,031)
Colombia Charleston:
2.7% (223)South Carolina:
4.3% (11,533)
South Africa Charleston:
2.7% (223)South Carolina:
0.4% (1,091)
Honduras Charleston:
2.7% (220)South Carolina:
4.8% (12,834)
Korea Charleston:
2.6% (215)South Carolina:
1.7% (4,513)
Brazil Charleston:
2.5% (201)South Carolina:
2.0% (5,344)
Italy Charleston:
2.4% (198)South Carolina:
0.5% (1,444)
Egypt Charleston:
2.3% (186)South Carolina:
0.4% (1,208)
Russia Charleston:
1.9% (157)South Carolina:
1.3% (3,522)
Jordan Charleston:
1.9% (157)South Carolina:
0.1% (353)
England Charleston:
1.9% (151)South Carolina:
1.9% (5,117)
United Kingdom, excluding England and Scotland Charleston:
1.6% (130)South Carolina:
1.2% (3,296)
Dominican Republic Charleston:
1.6% (129)South Carolina:
0.9% (2,357)
France Charleston:
1.5% (124)South Carolina:
0.7% (1,940)
Place of birth for U.S.-born residents:
This state: 63,424Other state: 78,891Northeast: 20,916Midwest: 17,922South: 33,631West: 6,422 80.6% of Charleston residents lived in the same house 1 years ago.
Out of people who lived in different houses, 27.0% lived in this county.
Out of people who lived in different counties, 30.5% lived in South Carolina.
Charleston:
80.6%State average:
86.5%
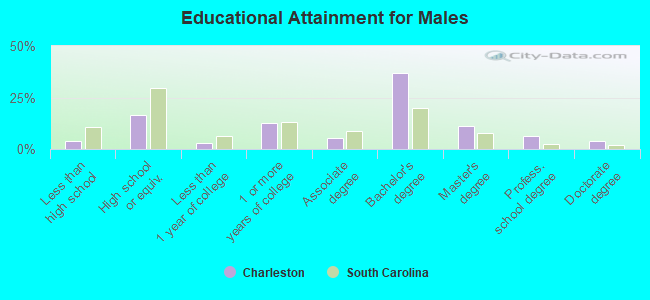
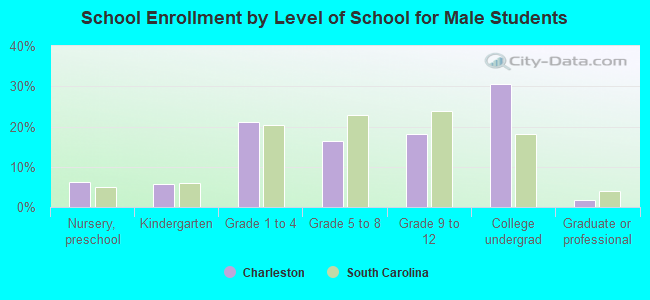
Education attainment for males 25 years and older:
No schooling: 273Nursery to 4th grade: 345th and 6th grade: 667th and 8th grade: 979th grade: 14510th grade: 46511th grade: 63912th grade, no diploma: 201High school graduate (or equivalency): 7,949Less than 1 year of college: 1,466Some college more than 1 year, no degree: 6,216Associate degree: 2,649Bachelor's degree: 17,922Master's degree: 5,520Professional school degree: 3,174Doctorate degree: 1,912
Education attainment for females 25 years and older:
No schooling: 1,039Nursery to 4th grade: 05th and 6th grade: 07th and 8th grade: 419th grade: 8010th grade: 21811th grade: 57112th grade, no diploma: 365High school graduate (or equivalency): 6,895Less than 1 year of college: 3,032Some college more than 1 year, no degree: 6,603Associate degree: 5,041Bachelor's degree: 20,647Master's degree: 11,273Professional school degree: 3,092Doctorate degree: 1,068
Housing units in structures:
One, detached: 36,281One, attached: 7,023Two: 2,5273 or 4: 2,9375 to 9: 6,11610 to 19: 6,43220 to 49: 6,17050 or more: 7,846Mobile homes: 360Boats, RVs, vans, etc.: 124Housing units lacking complete plumbing facilities in 2022: 0.8%Housing units lacking complete kitchen facilities in 2022: 1.0%House/condo owner moved in on average 7 years ago
Renter moved in on average 1 years ago
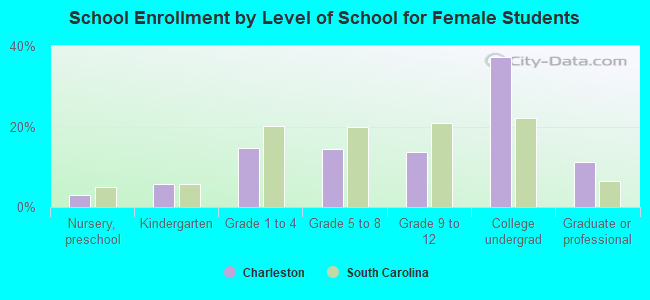
Private vs. public school enrollment:
Students in private schools in grades 1 to 8 (elementary and middle school): 2,377 Here:
19.9%South Carolina:
14.4%
Students in private schools in grades 9 to 12 (high school): 808 Here:
14.2%South Carolina:
11.1%
Students in private undergraduate colleges: 1,750 Here:
14.3%South Carolina:
21.9%