Chino, CA (California) Houses and Residents
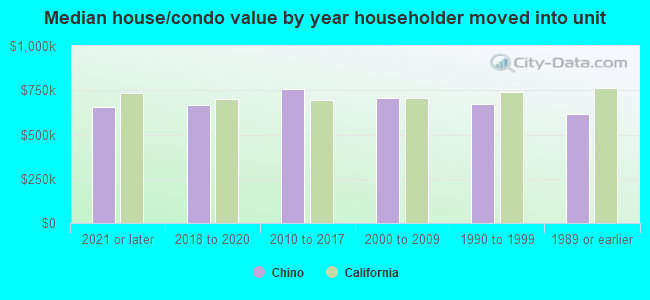
| Chino: | $681,400 |
| California: | $715,900 |
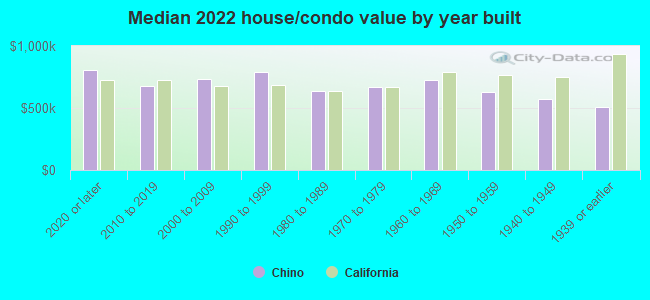
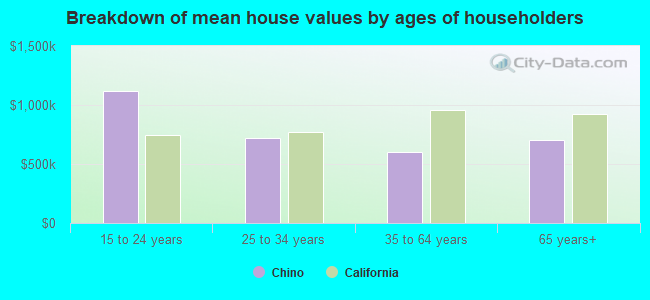
Mean price in 2022:
Detached houses: $699,130
Here: $699,130 State: $988,808 Townhouses or other attached units: $486,291
Here: $486,291 State: $838,546 In 3-to-4-unit structures: $479,760
Here: $479,760 State: $824,253 In 5-or-more-unit structures: $398,417
Here: $398,417 State: $730,996 Mobile homes: $78,919
Here: $78,919 State: $184,506
Total population: 84,723 (Urban population: 67,600, Rural population: 0)
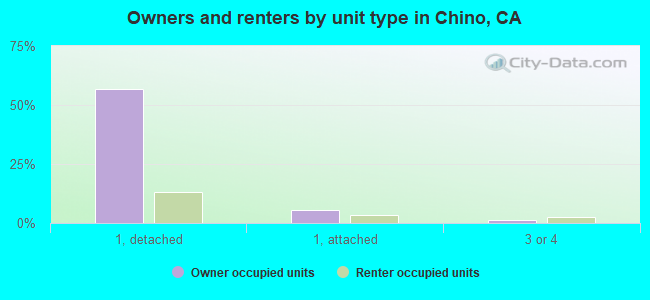
Houses: 28,018 (27,107 occupied: 18,252 owner occupied, 8,855 renter occupied)
| % of renters here: | 33% |
| State: | 44% |
Housing density: 1,331 houses/condos per square mile
Median price asked for vacant for-sale houses and condos in 2022: $483,008.
Median contract rent in 2022: over $2,000 (lower quartile is $1,503, upper quartile is over $2,000)
Median rent asked for vacant for-rent units in 2022: $2,132
Median gross rent in Chino, CA in 2022: over $2,000
Housing units in Chino with a mortgage: 12,879 (693 second mortgage, 46 home equity loan, 331 both second mortgage and home equity loan)
Houses without a mortgage: 99
Median household income for houses/condos with a mortgage: $115,912
Median household income for apartments without a mortgage: $77,020
Median monthly housing costs: $2,176
Compare current foreclosures in Chino, CA:
| Photo | Address | Area | Beds / Baths | Price | Details |
|---|---|---|---|---|---|

|
#1
Celebration St
Chino, CA 91708
|
1,644 sq. feet
|
2 baths 3 beds |
show details | |

|
#2
14th St
Chino, CA 91710
|
1,526 sq. feet
|
2 baths 3 beds |
show details | |

|
#3
Revere Ct
Chino, CA 91710
|
2,942 sq. feet
|
2 baths 4 beds |
show details | |

|
#4
Sugar Pine Ct
Chino, CA 91710
|
1,791 sq. feet
|
2 baths 3 beds |
show details | |

|
#5
Norton Ave
Chino, CA 91710
|
1,384 sq. feet
|
2 baths 3 beds |
show details | |

|
#6
Lester Ct
Chino, CA 91710
|
1,467 sq. feet
|
2 baths 3 beds |
show details | |

|
#7
Meadowlark Ln
Chino, CA 91710
|
1,971 sq. feet
|
3 baths 3 beds |
show details | |

|
#8
Angelina Ct
Chino, CA 91710
|
2,198 sq. feet
|
2 baths 4 beds |
show details | |

|
#9
Baker Ct
Chino, CA 91710
|
1,808 sq. feet
|
2 baths 3 beds |
show details | |

|
#10
Lassen Ct
Chino, CA 91710
|
1,199 sq. feet
|
2 baths 3 beds |
show details |
| Photo | Address | Area | Beds / Baths | Price | Details |
|---|---|---|---|---|---|

|
#11
San Antonio Ave
Chino, CA 91710
|
2,119 sq. feet
|
3 baths 4 beds |
show details | |

|
#12
Tucker Ave
Chino, CA 91710
|
1,880 sq. feet
|
2 baths 4 beds |
show details | |

|
#13
Teresita Ct
Chino, CA 91710
|
1,474 sq. feet
|
2 baths 3 beds |
show details | |

|
#14
Tioga Ct
Chino, CA 91710
|
1,671 sq. feet
|
2 baths 3 beds |
show details | |

|
#15
D St
Chino, CA 91710
|
653 sq. feet
|
1 baths 3 beds |
show details | |

|
#16
Whitney Ct
Chino, CA 91710
|
1,966 sq. feet
|
2 baths 4 beds |
show details | |

|
#17
17th St
Chino, CA 91710
|
1,158 sq. feet
|
2 baths 3 beds |
show details | |

|
#18
Salem St
Chino, CA 91710
|
1,718 sq. feet
|
2 baths 4 beds |
show details | |

|
#19
Concord Ct
Chino, CA 91710
|
2,845 sq. feet
|
3 baths 4 beds |
show details | |

|
#20
Goldmedal Ave
Chino, CA 91710
|
2,725 sq. feet
|
2 baths 5 beds |
show details |
| Photo | Address | Area | Beds / Baths | Price | Details |
|---|---|---|---|---|---|

|
#21
Lee Ct
Chino, CA 91710
|
1,560 sq. feet
|
2 baths 3 beds |
show details | |

|
#22
Concord Ct
Chino, CA 91710
|
2,727 sq. feet
|
3 baths 4 beds |
show details | |

|
#23
Issac Ct
Chino, CA 91710
|
2,198 sq. feet
|
2 baths 4 beds |
show details | |

|
#24
Yellowstone Cir
Chino, CA 91710
|
1,540 sq. feet
|
2 baths 4 beds |
show details | |

|
#25
Cypress Ave
Chino, CA 91710
|
1,885 sq. feet
|
2 baths 5 beds |
show details | |

|
#26
10th St
Chino, CA 91710
|
1,234 sq. feet
|
1 baths 1 beds |
show details | |

|
#27
Preciado Ave
Chino, CA 91710
|
2,286 sq. feet
|
2 baths 4 beds |
show details | |

|
#28
5th St
Chino, CA 91710
|
1,444 sq. feet
|
1 baths 3 beds |
show details | |

|
#29
Oaks Ave
Chino, CA 91710
|
2,293 sq. feet
|
2 baths 4 beds |
show details | |

|
#30
16th St
Chino, CA 91710
|
1,158 sq. feet
|
2 baths 3 beds |
show details |
| Photo | Address | Area | Beds / Baths | Price | Details |
|---|---|---|---|---|---|

|
#31
Ross Ave
Chino, CA 91710
|
1,524 sq. feet
|
2 baths 3 beds |
show details | |

|
#32
Lester Ct
Chino, CA 91710
|
1,467 sq. feet
|
2 baths 3 beds |
show details | |

|
#33
Angora St
Chino, CA 91710
|
1,910 sq. feet
|
2 baths 4 beds |
show details | |

|
#34
Silicon Ave
Chino, CA 91710
|
2,746 sq. feet
|
2 baths 6 beds |
show details | |

|
#35
Ramona Ave Apt 5
Chino, CA 91710
|
- sq. feet
|
- baths - beds |
show details | |

|
#36
16th St
Chino, CA 91710
|
- sq. feet
|
- baths - beds |
show details | |

|
#37
Yorba Ave Apt 7
Chino, CA 91710
|
- sq. feet
|
- baths - beds |
show details | |

|
#38
10th St
Chino, CA 91710
|
- sq. feet
|
- baths - beds |
show details | |

|
#39
12th St Apt 14a
Chino, CA 91710
|
- sq. feet
|
- baths - beds |
show details | |

|
#40
Brahman Ln
Chino, CA 91708
|
- sq. feet
|
- baths - beds |
show details |
| Photo | Address | Area | Beds / Baths | Price | Details |
|---|---|---|---|---|---|

|
#41
Sycamore Ave Apt B
Chino, CA 91710
|
- sq. feet
|
- baths - beds |
show details | |

|
#42
Homecoming Dr Unit 1285
Chino, CA 91708
|
- sq. feet
|
- baths - beds |
show details | |

|
#43
Celebration St
Chino, CA 91708
|
- sq. feet
|
- baths - beds |
show details | |

|
#44
Festival St
Chino, CA 91708
|
- sq. feet
|
- baths - beds |
show details | |

|
#45
Stonybrook Pl
Chino, CA 91710
|
- sq. feet
|
- baths - beds |
show details | |

|
#46
Revere St
Chino, CA 91710
|
- sq. feet
|
- baths - beds |
show details | |

|
#47
Ramona Ave Apt 157
Chino, CA 91710
|
- sq. feet
|
- baths - beds |
show details | |

|
#48
E Preserve Loop, Unit 2223
Chino, CA 91708
|
- sq. feet
|
- baths - beds |
show details | |

|
#49
D St
Chino, CA 91710
|
- sq. feet
|
- baths - beds |
show details | |

|
Check over 1 million property listings on Foreclosure.com!
|
browse all offers | |||

Latest news about housing in Chino, CA collected exclusively by city-data.com from local newspapers, TV, and radio stations


Median year apartment built: 1984
Household type by relationship:
Households: 93,149- Male householders: 15,823 (1,752 living alone), Female householders: 11,284 (1,745 living alone)
16,108 spouses (16,108 opposite-sex spouses), 1,350 unmarried partners, (1,350 opposite-sex unmarried partners), 31,941 children (31,165 natural, 58 adopted, 718 stepchildren), 1,749 grandchildren, 2,079 brothers or sisters, 3,129 parents, 138 foster children, 2,813 other relatives, 2,843 non-relatives
- In group quarters: 3,892
Size of family households: 6,917 2-persons, 5,847 3-persons, 4,628 4-persons, 2,455 5-persons, 1,727 6-persons, 993 7-or-more-persons.
Size of nonfamily households: 3,497 1-person, 817 2-persons, 50 3-persons, 114 4-persons, 62 5-persons.
17,446 married couples with children.
4,861 single-parent households (2,746 men, 2,115 women).
51.2% of residents of Chino speak English at home.
32.9% of residents speak Spanish at home (67% speak English very well, 15% speak English well, 12% speak English not well, 6% don't speak English at all).
1.8% of residents speak other Indo-European language at home (61% speak English very well, 16% speak English well, 17% speak English not well, 7% don't speak English at all).
14.0% of residents speak Asian or Pacific Island language at home (49% speak English very well, 28% speak English well, 14% speak English not well, 9% don't speak English at all).
0.5% of residents speak other language at home (66% speak English very well, 33% speak English well, 1% speak English not well).
Foreign born population: 24,615 (26.4%)
(51.1% of them are naturalized citizens)
| Here: | 6.3 |
| State: | 6.0 |
| Here: | 4.7 |
| State: | 3.9 |
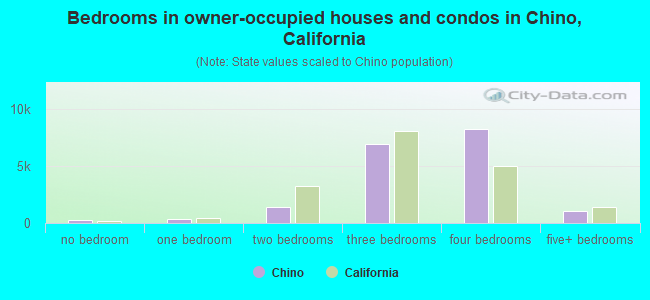
- Bedrooms in owner-occupied houses and condos in Chino, California
- 275no bedroom
- 3151 bedroom
- 1,4182 bedrooms
- 6,9223 bedrooms
- 8,2284 bedrooms
- 1,0945+ bedrooms
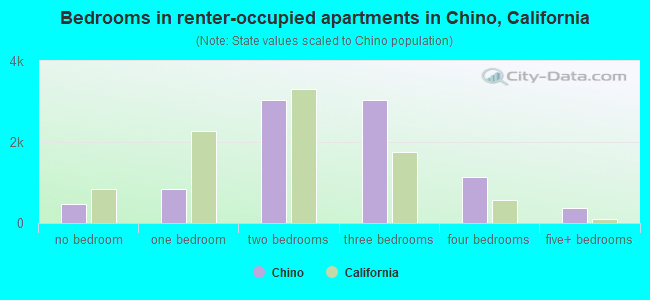
- Bedrooms in renter-occupied apartments in Chino, California
- 457no bedroom
- 8351 bedroom
- 3,0372 bedrooms
- 3,0353 bedrooms
- 1,1304 bedrooms
- 3615+ bedrooms
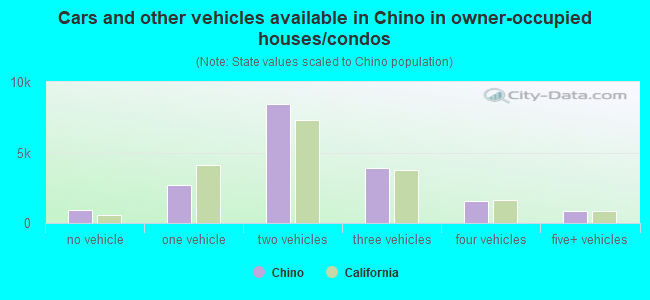
- Cars and other vehicles available in Chino in owner-occupied houses/condos
- 895no vehicle
- 2,6891 vehicle
- 8,4062 vehicles
- 3,8803 vehicles
- 1,5324 vehicles
- 8505+ vehicles
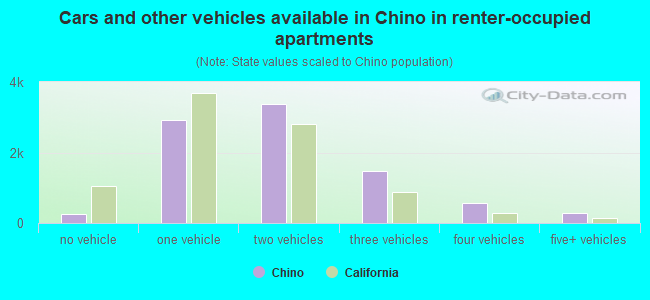
- Cars and other vehicles available in Chino in renter-occupied apartments
- 259no vehicle
- 2,9111 vehicle
- 3,3622 vehicles
- 1,4773 vehicles
- 5554 vehicles
- 2915+ vehicles
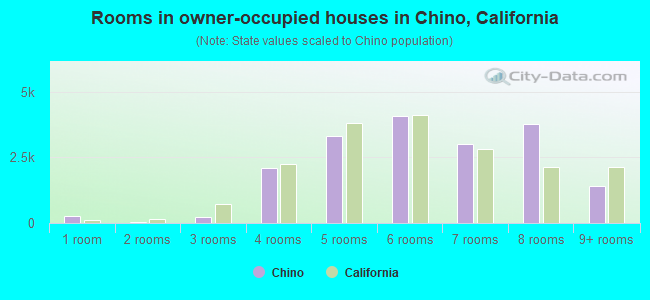
- Rooms in owner-occupied houses in Chino, California
- 2751 room
- 502 rooms
- 2473 rooms
- 2,0884 rooms
- 3,3065 rooms
- 4,0956 rooms
- 3,0067 rooms
- 3,7678 rooms
- 1,4189+ rooms
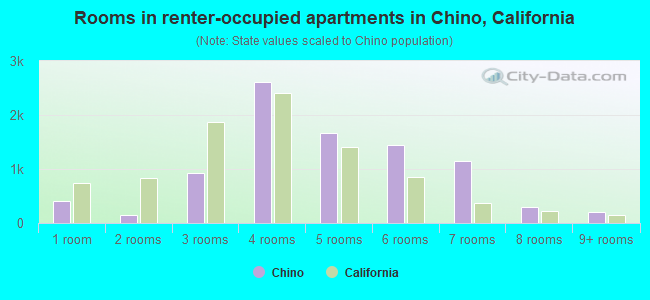
- Rooms in renter-occupied apartments in Chino, California
- 4051 room
- 1552 rooms
- 9233 rooms
- 2,6134 rooms
- 1,6655 rooms
- 1,4506 rooms
- 1,1527 rooms
- 2898 rooms
- 2039+ rooms
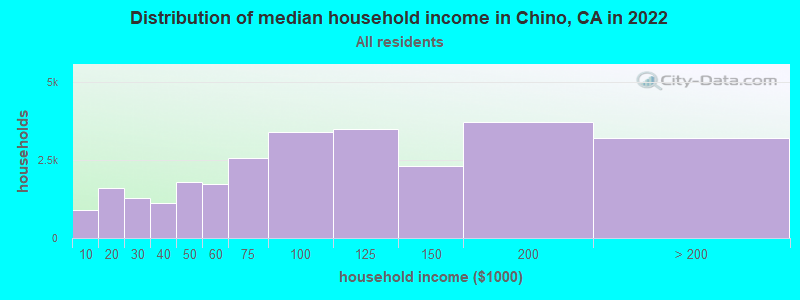
Chino, CA household income distribution

- 882Less than $10,000
- 1,618$10,000 to $19,999
- 1,287$20,000 to $29,999
- 1,126$30,000 to $39,999
- 1,784$40,000 to $49,999
- 1,725$50,000 to $59,999
- 2,556$60,000 to $74,999
- 3,395$75,000 to $99,999
- 3,484$100,000 to $124,999
- 2,322$125,000 to $149,999
- 3,717$150,000 to $199,999
- 3,211$200,000 or more
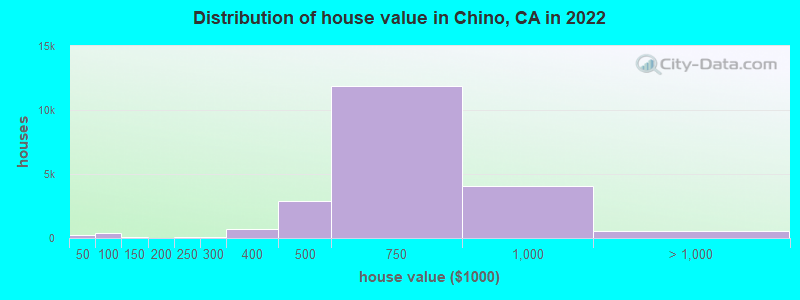
Home value of owner - occupied houses in 2022 in Chino, CA
-
- 108Less than $10,000
- 37$10,000 to $14,999
- 7$35,000 to $39,999
- 98$40,000 to $49,999
- 54$50,000 to $59,999
- 129$60,000 to $69,999
- 100$70,000 to $79,999
- 19$80,000 to $89,999
- 24$90,000 to $99,999
- 55$100,000 to $124,999
- 4$175,000 to $199,999
- 113$200,000 to $249,999
- 81$250,000 to $299,999
- 729$300,000 to $399,999
- 2,916$400,000 to $499,999
- 11,887$500,000 to $749,999
- 4,084$750,000 to $999,999
- 473$1,000,000 to $1,499,999
- 54$1,500,000 to $1,999,999
- 18$2,000,000 or more
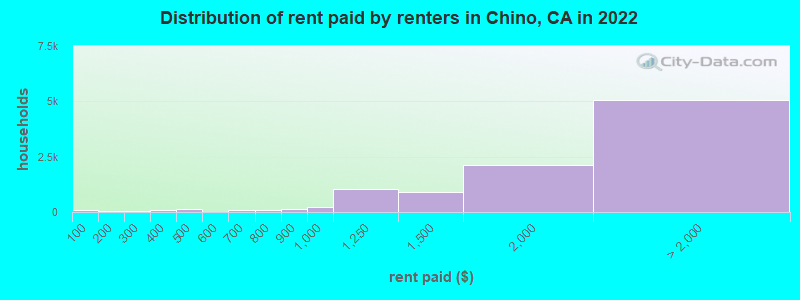
Rent paid by renters in 2022 in Chino, CA
-
- 86Less than $100
- 9$100 to $149
- 21$150 to $199
- 18$200 to $249
- 33$250 to $299
- 34$300 to $349
- 35$350 to $399
- 83$400 to $449
- 35$450 to $499
- 13$550 to $599
- 28$600 to $649
- 42$650 to $699
- 7$700 to $749
- 62$750 to $799
- 124$800 to $899
- 246$900 to $999
- 1,057$1,000 to $1,249
- 903$1,250 to $1,499
- 2,142$1,500 to $1,999
- 2,283$2,000 to $2,499
- 1,571$2,500 to $2,999
- 931$3,000 to $3,499
- 46$3,500 or more
- 228No cash rent
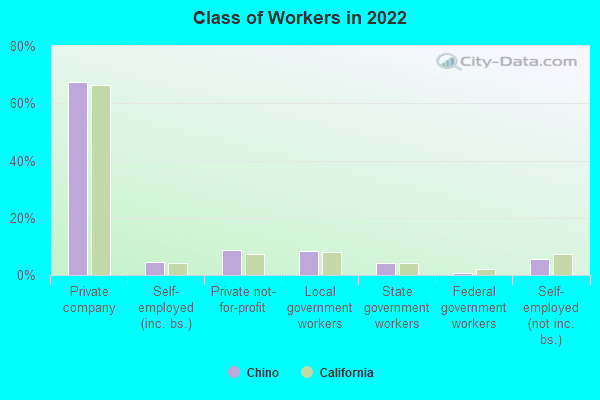
Percentage of workers working in this county: 61.2%
Number of people working at home: 6,837 (15.9% of all workers)
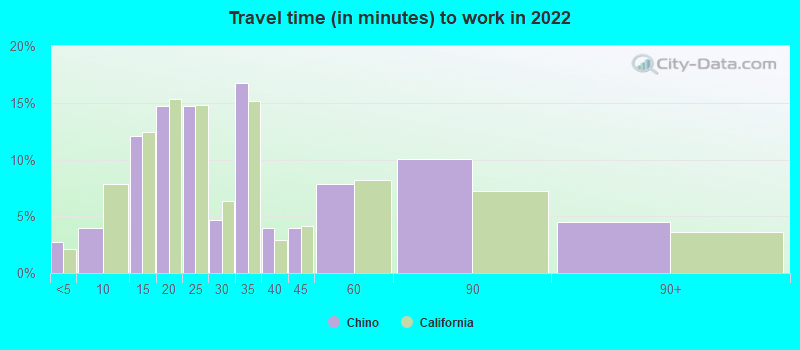
Travel time to work (commute)
- Less than 5 minutes: 621
- 5 to 9 minutes: 1,574
- 10 to 14 minutes: 3,147
- 15 to 19 minutes: 5,178
- 20 to 24 minutes: 3,662
- 25 to 29 minutes: 2,306
- 30 to 34 minutes: 6,279
- 35 to 39 minutes: 2,026
- 40 to 44 minutes: 1,697
- 45 to 59 minutes: 3,923
- 60 to 89 minutes: 2,688
- 90 or more minutes: 1,280
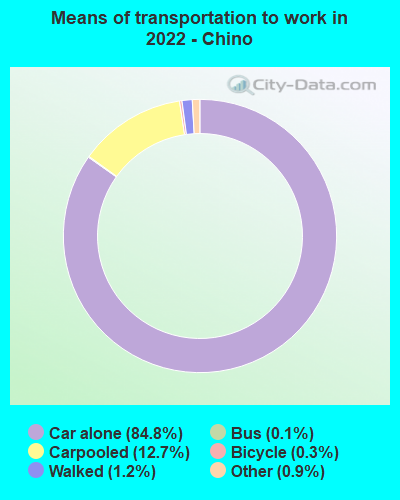
Means of transportation to work:
- Drove a car alone: 40,974 (73.6%)
- Carpooled: 6,587 (11.8%)
- Bus: 69 (0.1%)
- Long-distance train or commuter rail: 12 (0.0%)
- Taxi: 481 (0.9%)
- Bicycle: 111 (0.2%)
- Walked: 622 (1.1%)
- Worked at home: 6,837 (12.3%)
- Unemployment by race in 2022
- Unemployment rate for White non-Hispanic residents
- 3.0%Males
- 6.5%Females
- Unemployment rate for Black residents
- 20.4%Males
- 11.1%Females
- Unemployment rate for American Indian and Alaska Native residents
- 22.0%Males
- 4.2%Females
- Unemployment rate for Asian residents
- 1.0%Males
- 3.7%Females
- Unemployment rate for other race residents
- 0.8%Males
- 13.1%Females
- Unemployment rate for two or more race residents
- 3.4%Males
- 4.2%Females
- Unemployment rate for Hispanic or Latino residents
- 1.6%Males
- 7.1%Females
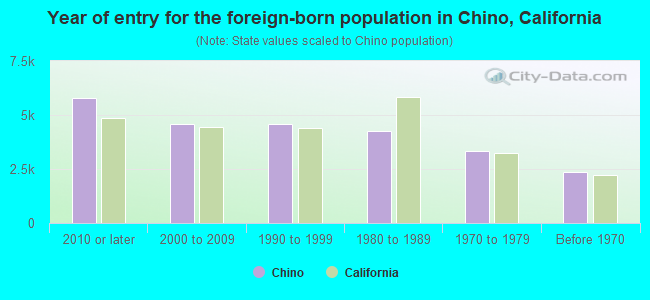
- Year of entry for the foreign-born population in Chino, California
- 5,8012010 or later
- 4,6002000 to 2009
- 4,5901990 to 1999
- 4,2611980 to 1989
- 3,3381970 to 1979
- 2,365Before 1970
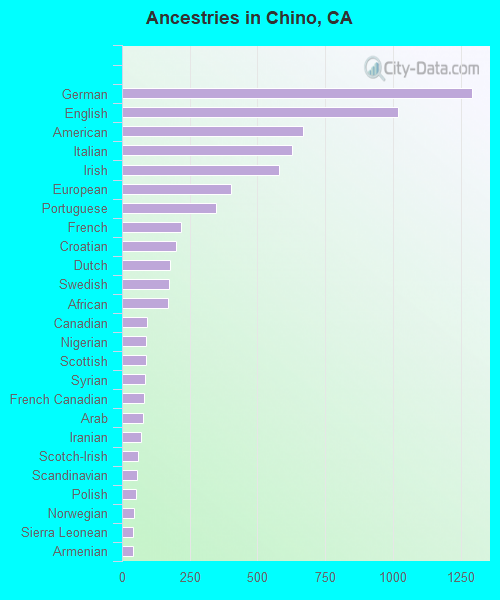
First ancestries reported:
- German: 1,290 (2.3%)
- English: 1,017 (1.8%)
- American: 668 (1.2%)
- Italian: 628 (1.1%)
- Irish: 580 (1.0%)
- European: 403 (0.7%)
- Portuguese: 347 (0.6%)
- French: 216 (0.4%)
- Croatian: 200 (0.4%)
- Dutch: 176 (0.3%)
- Swedish: 172 (0.3%)
- African: 168 (0.3%)
- Canadian: 94 (0.2%)
- Nigerian: 87 (0.2%)
- Scottish: 87 (0.2%)
- Syrian: 85 (0.1%)
- French Canadian: 81 (0.1%)
- Arab: 76 (0.1%)
- Iranian: 71 (0.1%)
- Scotch-Irish: 58 (0.1%)
- Scandinavian: 57 (0.10%)
- Polish: 50 (0.09%)
- Norwegian: 46 (0.08%)
- Sierra Leonean: 41 (0.07%)
- Armenian: 39 (0.07%)
- British: 38 (0.07%)
- Ethiopian: 34 (0.06%)
- Eastern European: 32 (0.06%)
- Greek: 30 (0.05%)
- Jamaican: 27 (0.05%)
- Cajun: 24 (0.04%)
- Romanian: 24 (0.04%)
- Trinidadian and Tobagonian: 24 (0.04%)
- Yugoslavian: 24 (0.04%)
- Northern European: 22 (0.04%)
- Slovak: 22 (0.04%)
- Lebanese: 21 (0.04%)
- Basque: 19 (0.03%)
- Welsh: 19 (0.03%)
- Finnish: 15 (0.03%)
- Czechoslovakian: 14 (0.02%)
- Russian: 12 (0.02%)
- Egyptian: 11 (0.02%)
- Hungarian: 10 (0.02%)
- Palestinian: 10 (0.02%)
- Ghanaian: 9 (0.02%)
- Pennsylvania German: 7 (0.01%)
- Austrian: 4 (0.01%)
- Australian: 3 (0.01%)
Most common places of birth for foreign-born residents (%):
| Chino: | 41.1% (9,504) |
| California: | 37.2% (3,881,193) |
| Chino: | 11.4% (2,631) |
| California: | 6.6% (684,672) |
| Chino: | 7.8% (1,799) |
| California: | 7.8% (818,297) |
| Chino: | 6.0% (1,377) |
| California: | 1.7% (176,274) |
| Chino: | 5.1% (1,174) |
| California: | 3.0% (315,248) |
| Chino: | 3.2% (740) |
| California: | 4.9% (512,335) |
| Chino: | 3.1% (714) |
| California: | 0.6% (58,161) |
| Chino: | 2.1% (474) |
| California: | 5.2% (539,184) |
| Chino: | 1.9% (449) |
| California: | 4.2% (440,287) |
| Chino: | 1.9% (447) |
| California: | 0.4% (39,097) |
| Chino: | 1.8% (406) |
| California: | 1.0% (105,215) |
| Chino: | 1.6% (364) |
| California: | 2.8% (290,436) |
Place of birth for U.S.-born residents:
- This state: 59,837
- Other state: 7,772
- Northeast: 1,357
- Midwest: 2,813
- South: 2,024
- West: 1,578
87.1% of Chino residents lived in the same house 1 years ago.
Out of people who lived in different houses, 25.5% lived in this county.
Out of people who lived in different counties, 87.3% lived in California.
| Chino: | 87.1% |
| State average: | 88.9% |
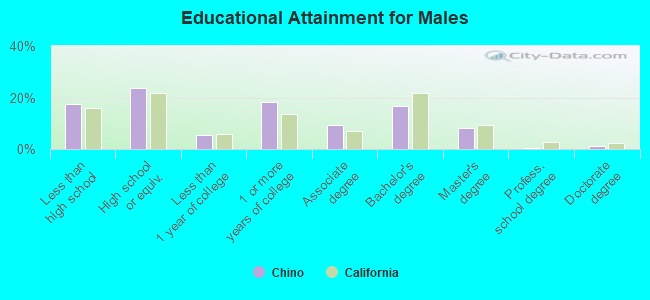
Education attainment for males 25 years and older:
- No schooling: 868
- Nursery to 4th grade: 236
- 5th and 6th grade: 856
- 7th and 8th grade: 320
- 9th grade: 456
- 10th grade: 89
- 11th grade: 1,175
- 12th grade, no diploma: 1,403
- High school graduate (or equivalency): 7,343
- Less than 1 year of college: 1,680
- Some college more than 1 year, no degree: 5,595
- Associate degree: 2,820
- Bachelor's degree: 5,128
- Master's degree: 2,474
- Professional school degree: 129
- Doctorate degree: 322
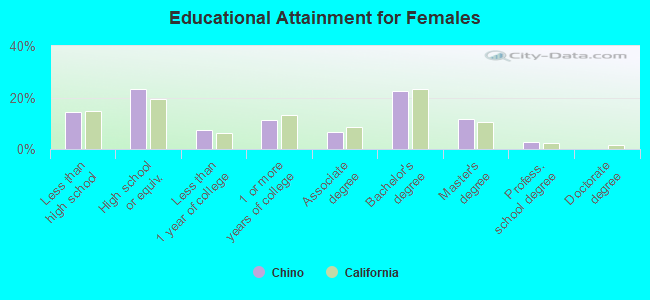
Education attainment for females 25 years and older:
- No schooling: 718
- Nursery to 4th grade: 266
- 5th and 6th grade: 722
- 7th and 8th grade: 288
- 9th grade: 431
- 10th grade: 104
- 11th grade: 74
- 12th grade, no diploma: 1,814
- High school graduate (or equivalency): 7,147
- Less than 1 year of college: 2,224
- Some college more than 1 year, no degree: 3,534
- Associate degree: 2,063
- Bachelor's degree: 7,013
- Master's degree: 3,563
- Professional school degree: 881
- Doctorate degree: 44
Housing units in structures:
- One, detached: 19,759
- One, attached: 3,309
- Two: 99
- 3 or 4: 761
- 5 to 9: 262
- 10 to 19: 1,031
- 20 to 49: 1,149
- 50 or more: 1,400
- Mobile homes: 248
Median worth of mobile homes: $87,260
Housing units lacking complete kitchen facilities in 2022: 3.6%
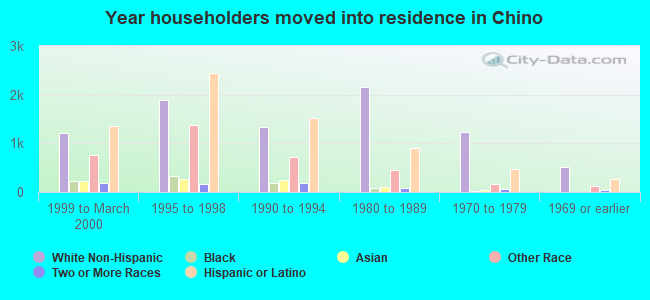
House/condo owner moved in on average 8 years ago
Renter moved in on average 3 years ago
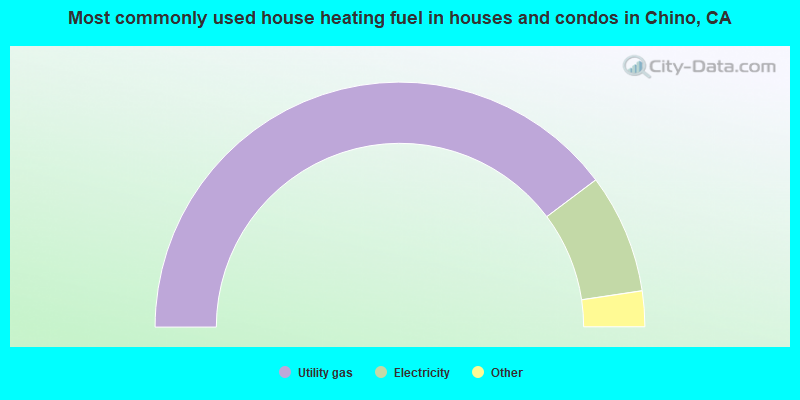
- 79.5%Utility gas
- 15.8%Electricity
- 2.1%Solar energy
- 1.7%Bottled, tank, or LP gas
- 0.7%No fuel used
- 0.2%Fuel oil, kerosene, etc.
- 0.1%Wood
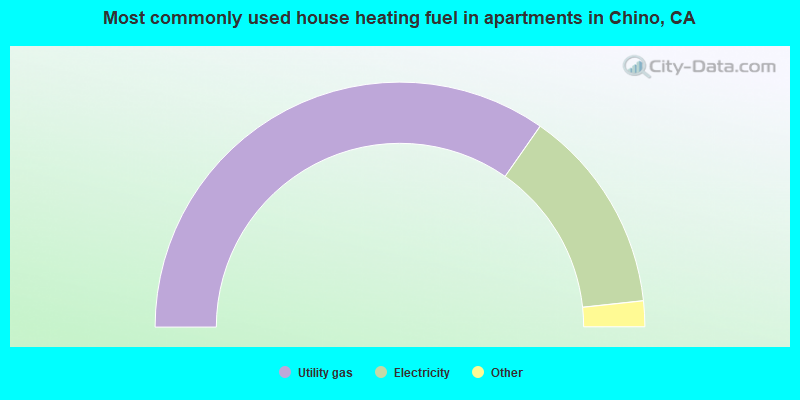
- 69.4%Utility gas
- 27.2%Electricity
- 2.2%No fuel used
- 0.7%Bottled, tank, or LP gas
- 0.3%Solar energy
- 0.2%Other fuel
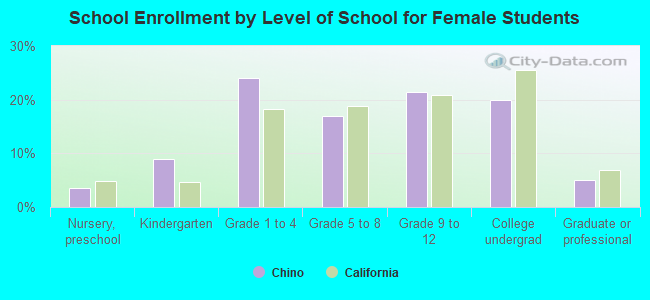
Private vs. public school enrollment:
| Here: | 8.6% |
| California: | 10.5% |
| Here: | 18.9% |
| California: | 8.5% |
| Here: | 15.1% |
| California: | 15.9% |