Cornelius, NC (North Carolina) Houses and Residents
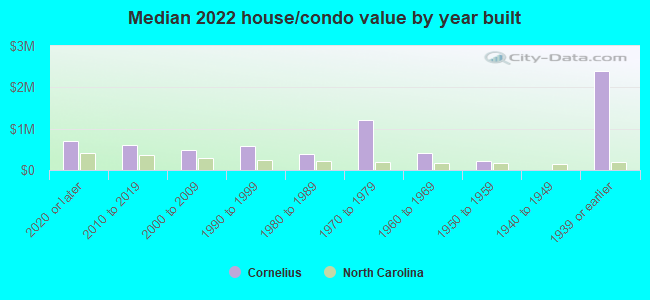
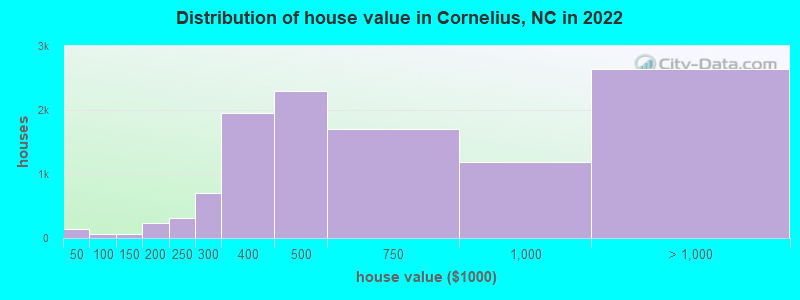
Estimated median house or condo value in 2022: $544,328 (it was $217,200 in 2000 )
Cornelius:
$544,328North Carolina:
$280,600
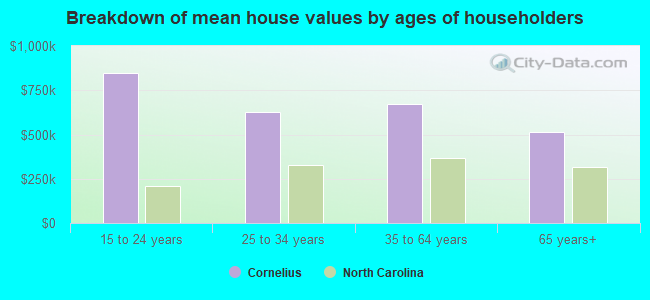
Lower value quartile - upper value quartile: $411,514 - $1,071,940Mean price in 2022: Detached houses: $658,132 Here:
$658,132State:
$375,326
Townhouses or other attached units: $339,013 Here:
$339,013State:
$317,935
In 3-to-4-unit structures: $196,313 Here:
$196,313State:
$254,939
In 5-or-more-unit structures: $256,459 Here:
$256,459State:
$329,290
Mobile homes: $241,908 Here:
$241,908State:
$124,933
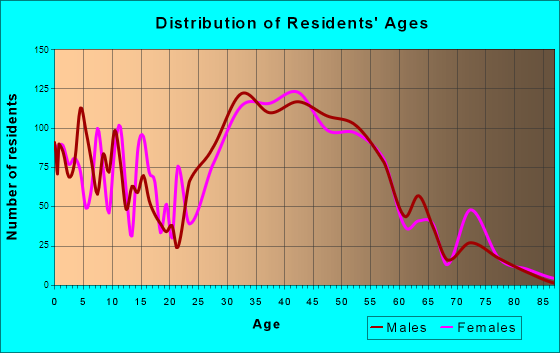
Total population: 27,481 (Urban population: 11,478, Rural population: 238 (all nonfarm) )
Houses: 15,092 (14,035 occupied: 9,848 owner occupied, 4,275 renter occupied )
% of renters here:
30%State:
33%
Housing density: 1,785 houses/condos per square mile
Median price asked for vacant for-sale houses and condos in 2022: $415,924.
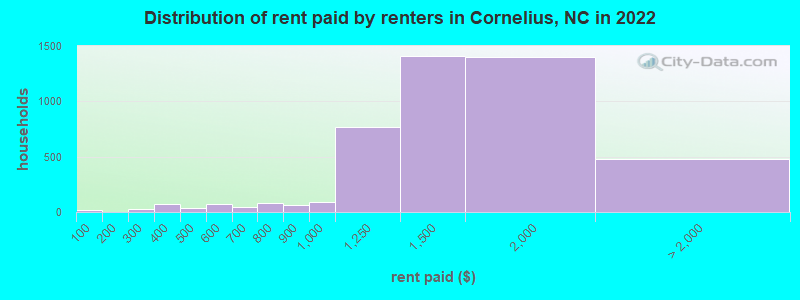
Median contract rent in 2022: $1,457 (lower quartile is $1,195, upper quartile is $1,744)
Median rent asked for vacant for-rent units in 2022: $1,387
Median gross rent in Cornelius, NC in 2022: $1,545
Housing units in Cornelius with a mortgage: 6,827 (915 second mortgage, 84 home equity loan, 834 both second mortgage and home equity loan )Houses without a mortgage: 248
Median household income for houses/condos with a mortgage: $176,841
Median household income for apartments without a mortgage: $123,995
Median monthly housing costs: $1,651
Data:
Median house or condo value ($)
Median house or condo value ($ change since 2000)
Median house or condo value ($) - White
Median house or condo value ($) - Black or African American
Median house or condo value ($) - Asian
Median house or condo value ($) - Hispanic or Latino
Median house or condo value ($) - American Indian and Alaska Native
Median house or condo value ($) - Multirace
Median house or condo value ($) - Other Race
Median price asked for mobile homes ($)
Household density (households per square mile)
Mean house or condo value by units in structure - 1, detached ($)
Mean house or condo value by units in structure - 1, attached ($)
Mean house or condo value by units in structure - 2 ($)
Mean house or condo value by units in structure by units in structure - 3 or 4 ($)
Mean house or condo value by units in structure - 5 or more ($)
Mean house or condo value by units in structure - Boat, RV, van, etc. ($)
Mean house or condo value by units in structure - Mobile home ($)
Median contract rent ($)
Median contract rent - Lower quartile ($)
Median contract rent - Upper quartile ($)
Median gross rent ($)
Urban houses (%)
Rural houses (%)
Houses occupied (%)
Houses occupied (% change since 2000)
Houses owner occupied (%)
Houses owner occupied (% change since 2000)
Houses renter occupied (%)
Houses renter occupied (% change since 2000)
Vacant housing units - For rent (%)
Vacant housing units - For rent (% change since 2000)
Vacant housing units - For sale only (%)
Vacant housing units - For sale only (% change since 2000)
Vacant housing units - Rented or sold, not occupied (%)
Vacant housing units - Rented or sold, not occupied (% change since 2000)
Vacant housing units - For seasonal, recreational, or occasional use (%)
Vacant housing units - For seasonal, recreational, or occasional use (% change since 2000)
Vacant housing units - For migrant workers (%)
Vacant housing units - For migrant workers (% change since 2000)
Vacant housing units - Other vacant (%)
Vacant housing units - Other vacant (% change since 2000)
Median monthly housing costs ($)
Median household income for houses/condos with a mortgage ($)
Median household income for houses/condos without a mortgage ($)
Median household income ($)
Median household income ($) - White
Median household income ($) - Black or African American
Median household income ($) - Asian
Median household income ($) - Hispanic or Latino
Median household income ($) - American Indian and Alaska Native
Median household income ($) - Multirace
Median household income ($) - Other Race
Mortgage status - with mortgage (%)
Mortgage status - with second mortgage (%)
Mortgage status - with home equity loan (%)
Mortgage status - with both second mortgage and home equity loan (%)
Mortgage status - without a mortgage (%)
Median year house/condo built
Median year apartment built
Household type by relationship - Male householder living alone (%)
Household type by relationship - Male householder not living alone (%)
Household type by relationship - Female householder living alone (%)
Household type by relationship - Female householder not living alone (%)
Household type by relationship - Opposite-Sex spouse (%)
Household type by relationship - Same-Sex spouse (%)
Household type by relationship - Opposite-Sex unmarried partner (%)
Household type by relationship - Same-Sex unmarried partner (%)
Household type by relationship - In group quarters (%)
Size of family households - 2-person household (%)
Size of family households - 3-person household (%)
Size of family households - 4-person household (%)
Size of family households - 5-person household (%)
Size of family households - 6-person household (%)
Size of family households - 7-or-more-person household (%)
Size of nonfamily households - 1-person household (%)
Size of nonfamily households - 2-person household (%)
Size of nonfamily households - 3-person household (%)
Size of nonfamily households - 4-person household (%)
Size of nonfamily households - 5-person household (%)
Size of nonfamily households - 6-person household (%)
Size of nonfamily households - 7-or-moreperson household (%)
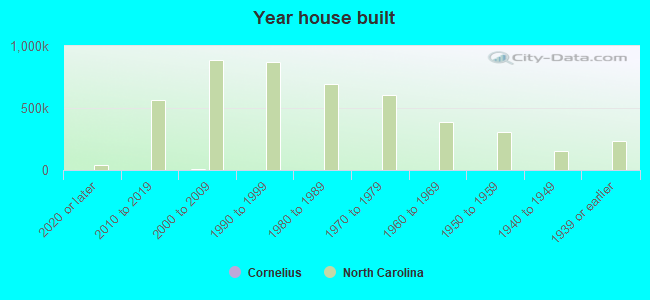
Year house built - Built 2010 or later (%)
Year house built - Built 2000 to 2009 (%)
Year house built - Built 1990 to 1999 (%)
Year house built - Built 1980 to 1989 (%)
Year house built - Built 1970 to 1979 (%)
Year house built - Built 1960 to 1969 (%)
Year house built - Built 1950 to 1959 (%)
Year house built - Built 1940 to 1949 (%)
Year house built - Built 1939 or earlier (%)
Median number of rooms in houses and condos
Median number of rooms in apartments
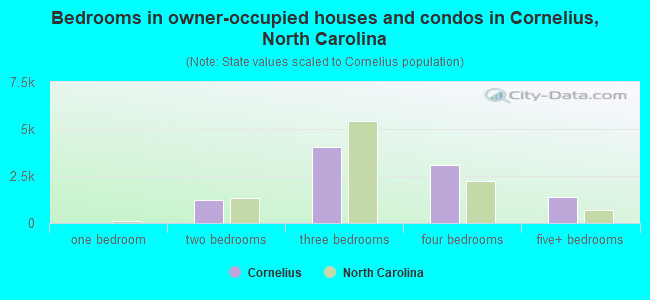
Median number of bedrooms in owner occupied houses
Mean number of bedrooms in owner occupied houses
Median number of bedrooms in renter occupied houses
Mean number of bedrooms in renter occupied houses
Median number of vehichles in owner occupied houses
Mean number of vehichles in owner occupied houses
Median number of vehichles in renter occupied houses
Mean number of vehichles in renter occupied houses
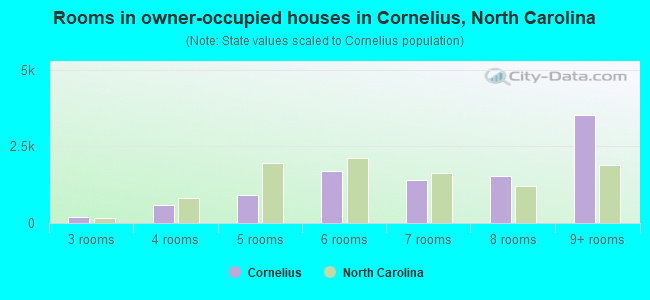
Rooms in owner-occupied houses - 1 room (%)
Rooms in owner-occupied houses - 2 rooms (%)
Rooms in owner-occupied houses - 3 rooms (%)
Rooms in owner-occupied houses - 4 rooms (%)
Rooms in owner-occupied houses - 5 rooms (%)
Rooms in owner-occupied houses - 6 rooms (%)
Rooms in owner-occupied houses - 7 rooms (%)
Rooms in owner-occupied houses - 8 rooms (%)
Rooms in owner-occupied houses - 9+ rooms (%)
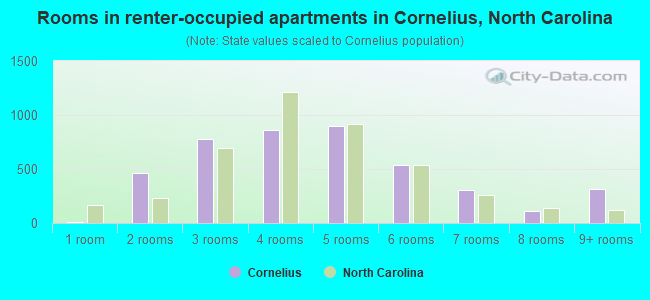
Rooms in renter-occupied houses - 1 room (%)
Rooms in renter-occupied houses - 2 rooms (%)
Rooms in renter-occupied houses - 3 rooms (%)
Rooms in renter-occupied houses - 4 rooms (%)
Rooms in renter-occupied houses - 5 rooms (%)
Rooms in renter-occupied houses - 6 rooms (%)
Rooms in renter-occupied houses - 7 rooms (%)
Rooms in renter-occupied houses - 8 rooms (%)
Rooms in renter-occupied houses - 9+ rooms (%)
Bedrooms in owner-occupied houses - no bedrooms (%)
Bedrooms in owner-occupied houses - 1 bedroom (%)
Bedrooms in owner-occupied houses - 2 bedrooms (%)
Bedrooms in owner-occupied houses - 3 bedrooms (%)
Bedrooms in owner-occupied houses - 4 bedrooms (%)
Bedrooms in owner-occupied houses - 5+ bedrooms (%)
Bedrooms in renter-occupied houses - no bedrooms (%)
Bedrooms in renter-occupied houses - 1 bedroom (%)
Bedrooms in renter-occupied houses - 2 bedrooms (%)
Bedrooms in renter-occupied houses - 3 bedrooms (%)
Bedrooms in renter-occupied houses - 4 bedrooms (%)
Bedrooms in renter-occupied houses - 5+ bedrooms (%)
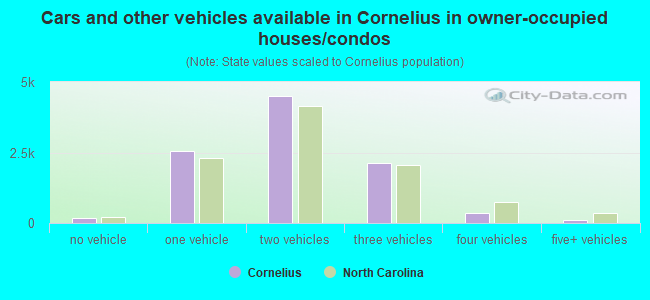
Vehicles available in owner-occupied houses - no vehicle available (%)
Vehicles available in owner-occupied houses - 1 vehicle available(%)
Vehicles available in owner-occupied houses - 2 Vehicles available (%)
Vehicles available in owner-occupied houses - 3 Vehicles available (%)
Vehicles available in owner-occupied houses - 4 Vehicles available (%)
Vehicles available in owner-occupied houses - 5+ Vehicles available (%)
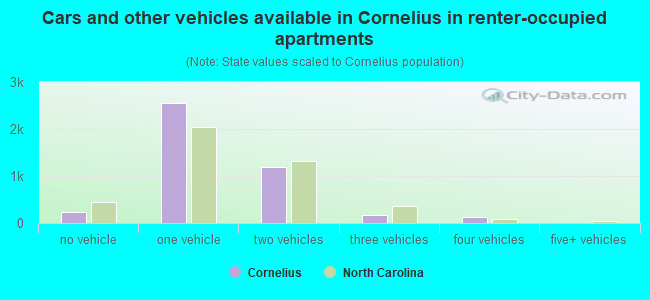
Vehicles available in renter-occupied houses - no vehicle available (%)
Vehicles available in renter-occupied houses - 1 vehicle available (%)
Vehicles available in renter-occupied houses - 2 Vehicles available (%)
Vehicles available in renter-occupied houses - 3 Vehicles available (%)
Vehicles available in renter-occupied houses - 4 Vehicles available (%)
Vehicles available in renter-occupied houses - 5+ Vehicles available (%)
Housing units in structures - 1, detached (%)
Housing units in structures - 1, attached (%)
Housing units in structures - 2 (%)
Housing units in structures - 3 or 4 (%)
Housing units in structures - 5 to 9 (%)
Housing units in structures - 10 to 19 (%)
Housing units in structures - 20 to 49 (%)
Housing units in structures - 50 or more (%)
Housing units in structures - Mobile home (%)
Housing units in structures - Boat, RV, van, etc. (%)
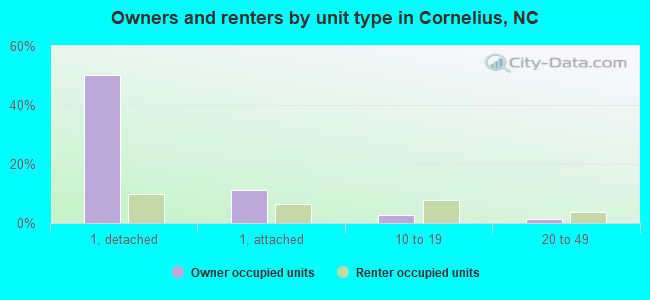
Housing units in structures - Owners - 1, detached (%)
Housing units in structures - Owners - 1, attached (%)
Housing units in structures - Owners - 2 (%)
Housing units in structures - Owners - 3 or 4 (%)
Housing units in structures - Owners - 5 to 9 (%)
Housing units in structures - Owners - 10 to 19 (%)
Housing units in structures - Owners - 20 to 49 (%)
Housing units in structures - Owners - 50 or more (%)
Housing units in structures - Owners - Mobile home (%)
Housing units in structures - Owners - Boat, RV, van, etc. (%)
Housing units in structures - Renters - 1, detached (%)
Housing units in structures - Renters - 1, attached (%)
Housing units in structures - Renters - 2 (%)
Housing units in structures - Renters - 3 or 4 (%)
Housing units in structures - Renters - 5 to 9 (%)
Housing units in structures - Renters - 10 to 19 (%)
Housing units in structures - Renters - 20 to 49 (%)
Housing units in structures - Renters - 50 or more (%)
Housing units in structures - Renters - Mobile home (%)
Housing units in structures - Renters - Boat, RV, van, etc. (%)
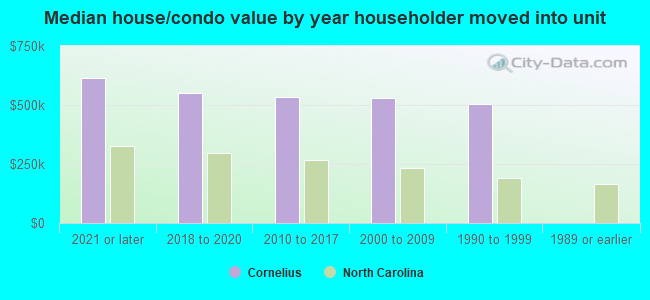
House/condo owner moved in on average (years ago)
Renter moved in on average (years ago)
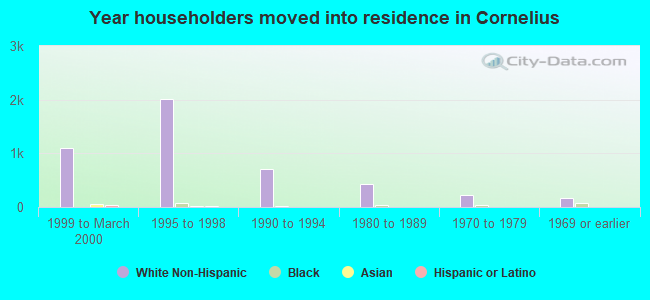
Year householder moved into unit - Moved in 1999 to March 2000 (%)
Year householder moved into unit - Moved in 1999 to March 2000 (%) - White
Year householder moved into unit - Moved in 1999 to March 2000 (%) - Black or African American
Year householder moved into unit - Moved in 1999 to March 2000 (%) - Asian
Year householder moved into unit - Moved in 1999 to March 2000 (%) - Hispanic or Latino
Year householder moved into unit - Moved in 1999 to March 2000 (%) - American Indian and Alaska Native
Year householder moved into unit - Moved in 1999 to March 2000 (%) - Multirace
Year householder moved into unit - Moved in 1999 to March 2000 (%) - Other Race
Year householder moved into unit - Moved in 1995 to 1998 (%)
Year householder moved into unit - Moved in 1995 to 1998 (%) - White
Year householder moved into unit - Moved in 1995 to 1998 (%) - Black or African American
Year householder moved into unit - Moved in 1995 to 1998 (%) - Asian
Year householder moved into unit - Moved in 1995 to 1998 (%) - Hispanic or Latino
Year householder moved into unit - Moved in 1995 to 1998 (%) - American Indian and Alaska Native
Year householder moved into unit - Moved in 1995 to 1998 (%) - Multirace
Year householder moved into unit - Moved in 1995 to 1998 (%) - Other Race
Year householder moved into unit - Moved in 1990 to 1994 (%)
Year householder moved into unit - Moved in 1990 to 1994 (%) - White
Year householder moved into unit - Moved in 1990 to 1994 (%) - Black or African American
Year householder moved into unit - Moved in 1990 to 1994 (%) - Asian
Year householder moved into unit - Moved in 1990 to 1994 (%) - Hispanic or Latino
Year householder moved into unit - Moved in 1990 to 1994 (%) - American Indian and Alaska Native
Year householder moved into unit - Moved in 1990 to 1994 (%) - Multirace
Year householder moved into unit - Moved in 1990 to 1994 (%) - Other Race
Year householder moved into unit - Moved in 1980 to 1989 (%)
Year householder moved into unit - Moved in 1980 to 1989 (%) - White
Year householder moved into unit - Moved in 1980 to 1989 (%) - Black or African American
Year householder moved into unit - Moved in 1980 to 1989 (%) - Asian
Year householder moved into unit - Moved in 1980 to 1989 (%) - Hispanic or Latino
Year householder moved into unit - Moved in 1980 to 1989 (%) - American Indian and Alaska Native
Year householder moved into unit - Moved in 1980 to 1989 (%) - Multirace
Year householder moved into unit - Moved in 1980 to 1989 (%) - Other Race
Year householder moved into unit - Moved in 1970 to 1979 (%)
Year householder moved into unit - Moved in 1970 to 1979 (%) - White
Year householder moved into unit - Moved in 1970 to 1979 (%) - Black or African American
Year householder moved into unit - Moved in 1970 to 1979 (%) - Asian
Year householder moved into unit - Moved in 1970 to 1979 (%) - Hispanic or Latino
Year householder moved into unit - Moved in 1970 to 1979 (%) - American Indian and Alaska Native
Year householder moved into unit - Moved in 1970 to 1979 (%) - Multirace
Year householder moved into unit - Moved in 1970 to 1979 (%) - Other Race
Year householder moved into unit - Moved in 1969 or earlier (%)
Year householder moved into unit - Moved in 1969 or earlier (%) - White
Year householder moved into unit - Moved in 1969 or earlier (%) - Black or African American
Year householder moved into unit - Moved in 1969 or earlier (%) - Asian
Year householder moved into unit - Moved in 1969 or earlier (%) - Hispanic or Latino
Year householder moved into unit - Moved in 1969 or earlier (%) - American Indian and Alaska Native
Year householder moved into unit - Moved in 1969 or earlier (%) - Multirace
Year householder moved into unit - Moved in 1969 or earlier (%) - Other Race
Housing units lacking complete plumbing facilities (%)
Housing units lacking complete kitchen facilities (%)
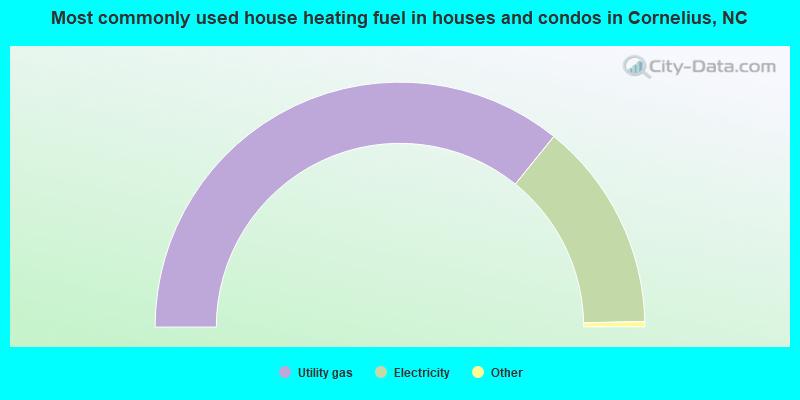
House heating fuel used in houses and condos - Utility gas (%)
House heating fuel used in houses and condos - Bottled, tank, or LP gas (%)
House heating fuel used in houses and condos - Electricity (%)
House heating fuel used in houses and condos - Fuel oil, kerosene, etc. (%)
House heating fuel used in houses and condos - Coal or coke (%)
House heating fuel used in houses and condos - Wood (%)
House heating fuel used in houses and condos - Solar energy (%)
House heating fuel used in houses and condos - Other fuel (%)
House heating fuel used in houses and condos - No fuel used (%)
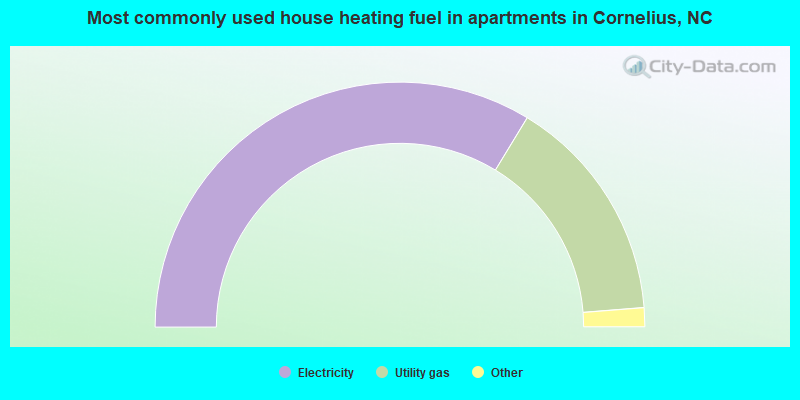
House heating fuel used in apartments - Utility gas (%)
House heating fuel used in apartments - Bottled, tank, or LP gas (%)
House heating fuel used in apartments - Electricity (%)
House heating fuel used in apartments - Fuel oil, kerosene, etc. (%)
House heating fuel used in apartments - Coal or coke (%)
House heating fuel used in apartments - Wood (%)
House heating fuel used in apartments - Solar energy (%)
House heating fuel used in apartments - Other fuel (%)
House heating fuel used in apartments - No fuel used (%)
Latest news about housing in Cornelius, NC collected exclusively by city-data.com from local newspapers, TV, and radio stations
Median year house/condo built: 2004Median year apartment built: 2005Household type by relationship:
Households: 32,240
Male householders: 6,926 (1,380 living alone ), Female householders: 6,784 (2,515 living alone )7,750 spouses (7,672 opposite-sex spouses ), 651 unmarried partners , (615 opposite-sex unmarried partners ), 8,855 children (8,538 natural , 189 adopted , 127 stepchildren ), 319 grandchildren , 67 brothers or sisters , 184 parents , 0 foster children , 230 other relatives , 465 non-relatives In group quarters: 4
Size of family households: 4,732 2-persons , 1,950 3-persons , 1,497 4-persons , 558 5-persons , 216 6-persons .
Size of nonfamily households: 4,228 1-person , 794 2-persons , 21 3-persons .
5,507 married couples with children. single-parent households (486 men , 733 women ).
92.4% of residents of Cornelius speak English at home. of residents speak Spanish at home (60% speak English very well , 16% speak English well , 13% speak English not well , 12% don't speak English at all ).of residents speak other Indo-European language at home (47% speak English very well , 10% speak English well , 39% speak English not well , 5% don't speak English at all ).of residents speak Asian or Pacific Island language at home (82% speak English very well , 18% speak English well ).of residents speak other language at home (94% speak English very well , 6% speak English not well ).
Foreign born population: 2,770 (8.6%)of them are naturalized citizens )
Median number of rooms in houses and condos:
Median number of rooms in apartments
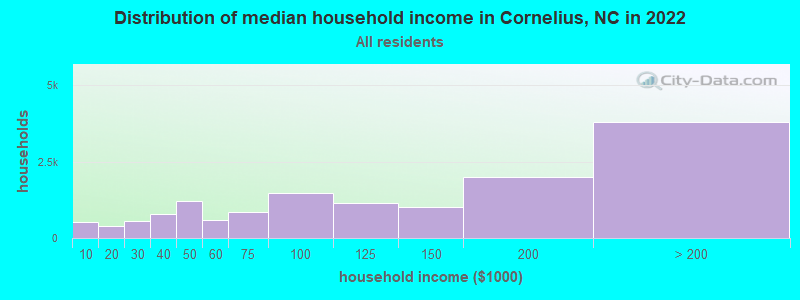
Cornelius, NC household income distribution 511 Less than $10,000390 $10,000 to $19,999549 $20,000 to $29,999782 $30,000 to $39,9991,223 $40,000 to $49,999586 $50,000 to $59,999853 $60,000 to $74,9991,473 $75,000 to $99,9991,156 $100,000 to $124,9991,011 $125,000 to $149,9991,985 $150,000 to $199,9993,793 $200,000 or more
Home value of owner - occupied houses in 2022 in Cornelius, NC 73 Less than $10,00020 $20,000 to $24,99915 $25,000 to $29,99932 $40,000 to $49,9994 $60,000 to $69,99923 $70,000 to $79,99960 $100,000 to $124,9994 $125,000 to $149,999141 $150,000 to $174,99997 $175,000 to $199,999314 $200,000 to $249,999702 $250,000 to $299,9991,951 $300,000 to $399,9992,291 $400,000 to $499,9991,703 $500,000 to $749,9991,190 $750,000 to $999,999897 $1,000,000 to $1,499,999563 $1,500,000 to $1,999,9991,179 $2,000,000 or moreRent paid by renters in 2022 in Cornelius, NC 15 Less than $10026 $200 to $24974 $300 to $34932 $400 to $44958 $500 to $54917 $550 to $59923 $600 to $64918 $650 to $69942 $700 to $74939 $750 to $79960 $800 to $89990 $900 to $999767 $1,000 to $1,2491,406 $1,250 to $1,4991,402 $1,500 to $1,999180 $2,000 to $2,49964 $2,500 to $2,99913 $3,000 to $3,499218 No cash rent
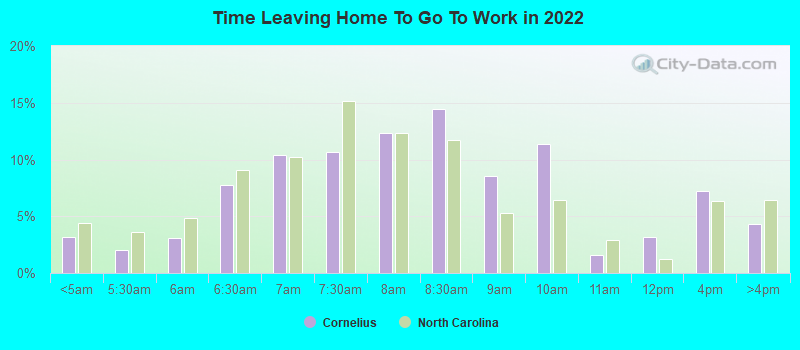
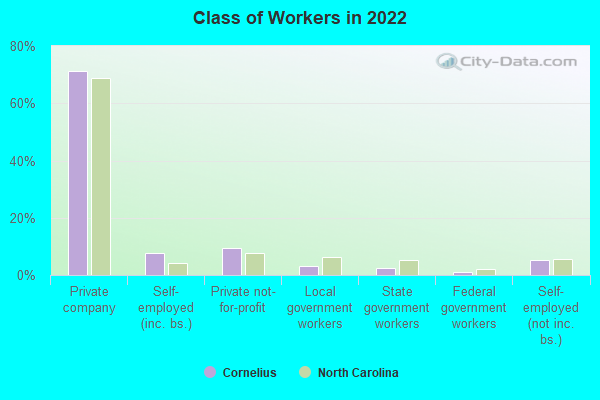
Percentage of workers working in this county: 84.2%Number of people working at home: 5,442 (32.6% of all workers )
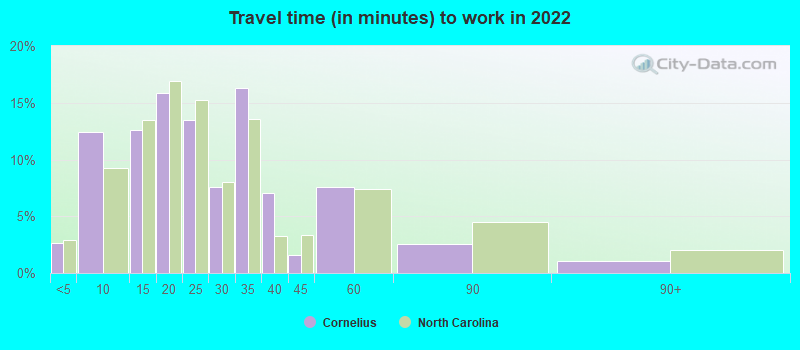
Travel time to work (commute)
Less than 5 minutes: 2805 to 9 minutes: 1,47410 to 14 minutes: 1,62515 to 19 minutes: 1,57220 to 24 minutes: 1,37025 to 29 minutes: 95530 to 34 minutes: 1,58235 to 39 minutes: 32640 to 44 minutes: 44845 to 59 minutes: 95160 to 89 minutes: 56990 or more minutes: 106
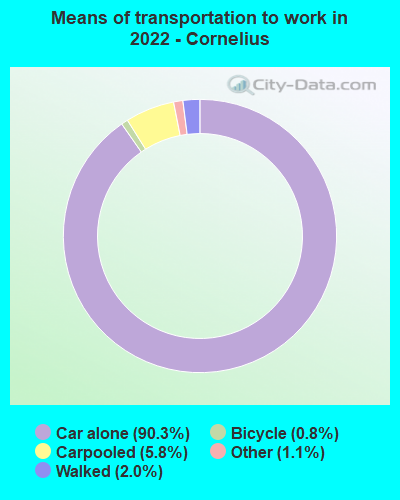
Means of transportation to work:
Drove a car alone: 8,288 (59.7%)Carpooled: 573 (4.1%)Taxi: 88 (0.6%)Bicycle: 100 (0.7%)Walked: 180 (1.3%)Worked at home: 5,442 (39.2%)
Unemployment by race in 2022
Unemployment rate for White non-Hispanic residents 0.9% Males3.3% FemalesUnemployment rate for Black residents 3.4% Males3.0% FemalesUnemployment rate for other race residents 14.7% FemalesUnemployment rate for two or more race residents 5.5% Males2.1% FemalesUnemployment rate for Hispanic or Latino residents 8.8% Females
Year of entry for the foreign-born population in Cornelius, North Carolina
1,328 2010 or later 507 2000 to 2009 365 1990 to 1999 68 1980 to 1989 93 1970 to 1979 96 Before 1970
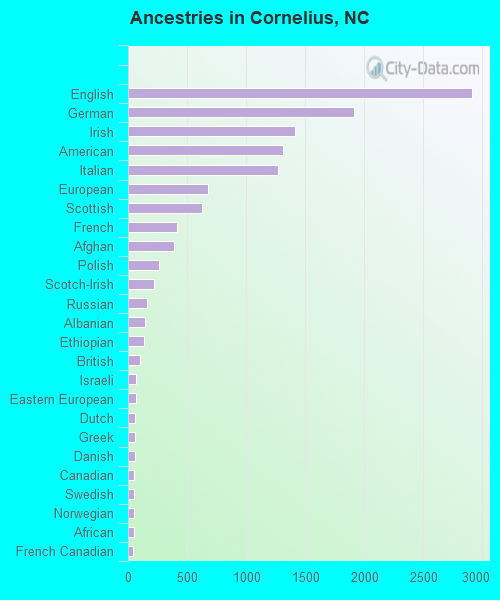
First ancestries reported:
English: 2,913 (18.2%)
German: 1,913 (12.0%)
Irish: 1,418 (8.9%)
American: 1,310 (8.2%)
Italian: 1,269 (7.9%)
European: 681 (4.3%)
Scottish: 625 (3.9%)
French: 413 (2.6%)
Afghan: 393 (2.5%)
Polish: 259 (1.6%)
Scotch-Irish: 219 (1.4%)
Russian: 165 (1.0%)
Albanian: 140 (0.9%)
Ethiopian: 139 (0.9%)
British: 98 (0.6%)
Israeli: 71 (0.4%)
Eastern European: 64 (0.4%)
Dutch: 62 (0.4%)
Greek: 62 (0.4%)
Danish: 61 (0.4%)
Canadian: 53 (0.3%)
Swedish: 52 (0.3%)
Norwegian: 50 (0.3%)
African: 49 (0.3%)
French Canadian: 44 (0.3%)
Northern European: 42 (0.3%)
Romanian: 39 (0.2%)
Armenian: 35 (0.2%)
Slovak: 32 (0.2%)
Ukrainian: 30 (0.2%)
Palestinian: 27 (0.2%)
Czech: 27 (0.2%)
Lebanese: 26 (0.2%)
Macedonian: 25 (0.2%)
Croatian: 23 (0.1%)
Yugoslavian: 22 (0.1%)
Czechoslovakian: 19 (0.1%)
Scandinavian: 19 (0.1%)
Turkish: 18 (0.1%)
Finnish: 17 (0.1%)
Arab: 15 (0.09%)
Austrian: 15 (0.09%)
Portuguese: 14 (0.09%)
South African: 12 (0.08%)
Hungarian: 10 (0.06%)
Welsh: 6 (0.04%)
Serbian: 3 (0.02%)
Most common places of birth for foreign-born residents (%): Afghanistan Cornelius:
15.5% (449)North Carolina:
0.2% (1,745)
India Cornelius:
8.2% (238)North Carolina:
9.3% (80,594)
Mexico Cornelius:
7.7% (224)North Carolina:
24.7% (214,776)
Guatemala Cornelius:
6.1% (177)North Carolina:
2.6% (22,964)
Canada Cornelius:
6.0% (173)North Carolina:
2.1% (18,105)
United Kingdom, excluding England and Scotland Cornelius:
4.8% (139)North Carolina:
1.1% (9,831)
England Cornelius:
4.5% (129)North Carolina:
1.2% (10,140)
Colombia Cornelius:
4.3% (126)North Carolina:
2.1% (18,275)
Russia Cornelius:
4.2% (122)North Carolina:
0.9% (8,067)
Spain Cornelius:
3.6% (103)North Carolina:
0.3% (2,183)
Other Eastern Europe Cornelius:
3.3% (97)North Carolina:
0.2% (1,928)
France Cornelius:
3.1% (91)North Carolina:
0.4% (3,292)
Kuwait Cornelius:
2.5% (72)North Carolina:
0.1% (903)
Netherlands Cornelius:
2.3% (66)North Carolina:
0.2% (1,461)
Ethiopia Cornelius:
2.3% (66)North Carolina:
0.5% (4,296)
Israel Cornelius:
2.2% (65)North Carolina:
0.1% (994)
Ecuador Cornelius:
2.1% (62)North Carolina:
0.9% (7,765)
Germany Cornelius:
2.1% (62)North Carolina:
1.8% (15,534)
Philippines Cornelius:
1.8% (52)North Carolina:
2.4% (20,695)
Place of birth for U.S.-born residents:
This state: 9,845Other state: 19,394Northeast: 6,807Midwest: 4,675South: 6,084West: 1,780 85.2% of Cornelius residents lived in the same house 1 years ago.
Out of people who lived in different houses, 32.5% lived in this county.
Out of people who lived in different counties, 34.7% lived in North Carolina.
Cornelius:
85.2%State average:
87.3%
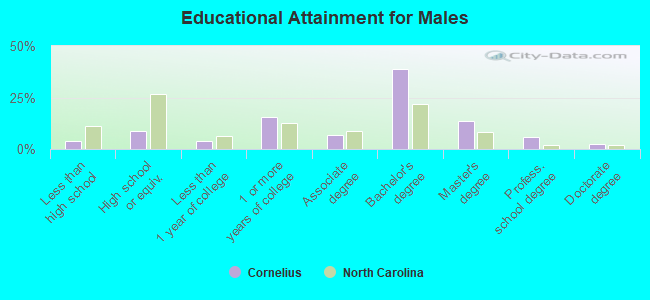
Education attainment for males 25 years and older:
No schooling: 179Nursery to 4th grade: 345th and 6th grade: 07th and 8th grade: 109th grade: 010th grade: 15211th grade: 1212th grade, no diploma: 43High school graduate (or equivalency): 958Less than 1 year of college: 421Some college more than 1 year, no degree: 1,665Associate degree: 760Bachelor's degree: 4,240Master's degree: 1,498Professional school degree: 630Doctorate degree: 266
Education attainment for females 25 years and older:
No schooling: 68Nursery to 4th grade: 225th and 6th grade: 147th and 8th grade: 09th grade: 610th grade: 011th grade: 912th grade, no diploma: 35High school graduate (or equivalency): 1,443Less than 1 year of college: 591Some college more than 1 year, no degree: 1,427Associate degree: 1,381Bachelor's degree: 5,242Master's degree: 1,932Professional school degree: 185Doctorate degree: 219
Housing units in structures:
One, detached: 9,223One, attached: 1,249Two: 2003 or 4: 3965 to 9: 59410 to 19: 1,52720 to 49: 90850 or more: 872Mobile homes: 119Housing units lacking complete plumbing facilities in 2022: 0.4%Housing units lacking complete kitchen facilities in 2022: 0.4%House/condo owner moved in on average 6 years ago
Renter moved in on average 1 years ago
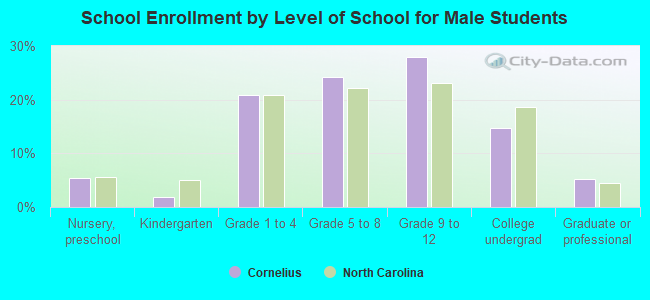
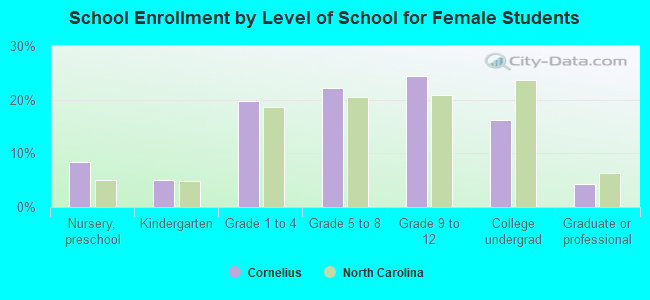
Private vs. public school enrollment:
Students in private schools in grades 1 to 8 (elementary and middle school): 536 Here:
16.0%North Carolina:
13.8%
Students in private schools in grades 9 to 12 (high school): 328 Here:
16.3%North Carolina:
11.9%
Students in private undergraduate colleges: 218 Here:
18.1%North Carolina:
19.3%