Cornville, AZ (Arizona) Houses and Residents
| Cornville: | $372,863 |
| Arizona: | $402,800 |
Mean price in 2022:
Detached houses: $758,542
Here: $758,542 State: $521,408 Mobile homes: $75,731
Here: $75,731 State: $141,516
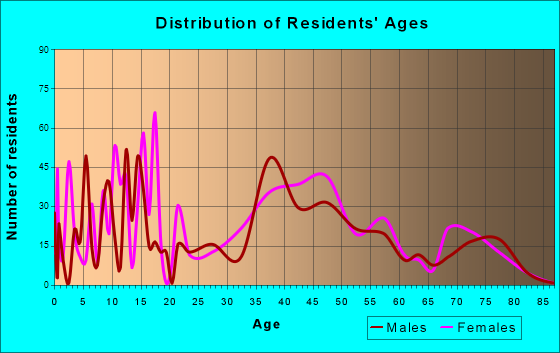
Total population: 3,280 (Urban population: 0, Rural population: 3,572 (all nonfarm))
Houses: 1,722 (1,615 occupied: 1,214 owner occupied, 408 renter occupied)
| % of renters here: | 25% |
| State: | 33% |
Housing density: 130 houses/condos per square mile
Median price asked for vacant for-sale houses and condos in 2022 in this county: $958,178.
Median contract rent in 2022: $1,203 (lower quartile is $1,003, upper quartile is $1,316)
Median rent asked for vacant for-rent units in 2022: $868
Median gross rent in Cornville, AZ in 2022: $1,366
Housing units in Cornville with a mortgage: 798 (44 second mortgage, 0 home equity loan, 18 both second mortgage and home equity loan)
Houses without a mortgage: 21
Median household income for houses/condos with a mortgage: $71,319
Median household income for apartments without a mortgage: $55,309
Median monthly housing costs: $1,303
Compare current foreclosures near Cornville, AZ:
| Photo | Address | Area | Beds / Baths | Price | Details |
|---|---|---|---|---|---|

|
#1
E Circle Dr
Cornville, AZ 86325
|
1,954 sq. feet
|
- baths - beds |
show details | |

|
#2
N Page Ln
Cornville, AZ 86325
|
2,505 sq. feet
|
- baths - beds |
show details | |

|
#3
N Pugh Ln
Cornville, AZ 86325
|
1,344 sq. feet
|
- baths - beds |
show details | |

|
#4
E Circle Dr
Cornville, AZ 86325
|
- sq. feet
|
- baths - beds |
show details | |

|
#5
E Cottontail Run
Cottonwood, AZ 86326
|
1,800 sq. feet
|
2 baths 2 beds |
$475,000
|
show details |

|
#6
S Greaves Pl
Cornville, AZ 86325
|
- sq. feet
|
- baths - beds |
show details | |

|
#7
N Fairway Dr
Rimrock, AZ 86335
|
- sq. feet
|
2 baths 2 beds |
show details | |

|
#8
N Popies Way
Rimrock, AZ 86335
|
- sq. feet
|
2 baths 4 beds |
show details | |

|
#9
W Azure Dr
Camp Verde, AZ 86322
|
1,381 sq. feet
|
2 baths 3 beds |
show details | |

|
#10
S Aspen Way
Camp Verde, AZ 86322
|
1,154 sq. feet
|
2 baths 3 beds |
show details |
| Photo | Address | Area | Beds / Baths | Price | Details |
|---|---|---|---|---|---|

|
#11
Coronado Trl
Sedona, AZ 86336
|
4,524 sq. feet
|
2 baths - beds |
show details | |

|
#12
E Rio Mesa Trl
Cottonwood, AZ 86326
|
1,403 sq. feet
|
- baths - beds |
show details | |

|
#13
E Canyon Dr
Camp Verde, AZ 86322
|
1,128 sq. feet
|
- baths - beds |
show details | |

|
#14
W Stage Coach Dr
Camp Verde, AZ 86322
|
1,056 sq. feet
|
- baths - beds |
show details | |

|
#15
Arturo Circle
Camp Verde, AZ 86322
|
564 sq. feet
|
- baths - beds |
show details | |

|
#16
E Drover Way
Rimrock, AZ 86335
|
1,664 sq. feet
|
- baths - beds |
show details | |

|
#17
Navajo Dr Apt C6
Sedona, AZ 86336
|
- sq. feet
|
- baths - beds |
show details | |

|
#18
Dakota Dr
Camp Verde, AZ 86322
|
1,680 sq. feet
|
- baths - beds |
show details | |

|
#19
S Nichols St
Camp Verde, AZ 86322
|
- sq. feet
|
- baths - beds |
show details | |

|
#20
Feather Way
Sedona, AZ 86336
|
3,069 sq. feet
|
- baths - beds |
show details |
| Photo | Address | Area | Beds / Baths | Price | Details |
|---|---|---|---|---|---|

|
#21
E Valley View Rd
Camp Verde, AZ 86322
|
1,654 sq. feet
|
- baths - beds |
show details | |

|
#22
Kachina Dr
Sedona, AZ 86336
|
1,682 sq. feet
|
- baths - beds |
show details | |

|
#23
Ravens Call Pl
Sedona, AZ 86336
|
- sq. feet
|
- baths - beds |
show details | |

|
#24
Navajo Dr Apt B1
Sedona, AZ 86336
|
- sq. feet
|
- baths - beds |
show details | |

|
#25
E Stolen Blvd
Camp Verde, AZ 86322
|
960 sq. feet
|
- baths - beds |
show details | |

|
#26
Sunset Dr Apt 3
Sedona, AZ 86336
|
- sq. feet
|
- baths - beds |
show details | |

|
#27
Pottery Pl
Sedona, AZ 86336
|
2,596 sq. feet
|
- baths - beds |
show details | |

|
#28
Pottery Pl
Sedona, AZ 86336
|
2,596 sq. feet
|
- baths - beds |
show details | |

|
#29
E Citrus Way
Camp Verde, AZ 86322
|
- sq. feet
|
- baths - beds |
show details | |

|
#30
Rodeo Rd
Sedona, AZ 86336
|
4,200 sq. feet
|
- baths - beds |
show details |
| Photo | Address | Area | Beds / Baths | Price | Details |
|---|---|---|---|---|---|

|
#31
S Lantis Ln
Camp Verde, AZ 86322
|
2,239 sq. feet
|
- baths - beds |
show details | |

|
#32
Navoti Dr
Sedona, AZ 86336
|
- sq. feet
|
- baths - beds |
show details | |

|
#33
Shadow Rock Dr
Sedona, AZ 86336
|
- sq. feet
|
- baths - beds |
show details | |

|
#34
S Cypress Dr
Camp Verde, AZ 86322
|
1,128 sq. feet
|
- baths - beds |
show details | |

|
#35
Coronado Trl
Sedona, AZ 86336
|
4,524 sq. feet
|
- baths - beds |
show details | |

|
#36
Kallof Pl
Sedona, AZ 86336
|
1,284 sq. feet
|
- baths - beds |
show details | |

|
#37
Sugarloaf St Unit A
Sedona, AZ 86351
|
- sq. feet
|
- baths - beds |
show details | |

|
#38
Back O Beyond Cir
Sedona, AZ 86336
|
3,961 sq. feet
|
- baths - beds |
show details | |

|
#39
N Mondale Ln
Camp Verde, AZ 86322
|
1,605 sq. feet
|
- baths - beds |
show details | |

|
#40
S Hillview Cir
Cottonwood, AZ 86326
|
1,410 sq. feet
|
- baths - beds |
show details |
| Photo | Address | Area | Beds / Baths | Price | Details |
|---|---|---|---|---|---|

|
#41
W Center Ln
Camp Verde, AZ 86322
|
868 sq. feet
|
- baths - beds |
show details | |

|
#42
S Main St Ste 487
Cottonwood, AZ 86326
|
- sq. feet
|
- baths - beds |
show details | |

|
#43
E Rio Mesa Trl
Cottonwood, AZ 86326
|
1,403 sq. feet
|
- baths - beds |
show details | |

|
#44
N Verde River Dr
Camp Verde, AZ 86322
|
- sq. feet
|
- baths - beds |
show details | |

|
#45
S Chuckawalla Dr
Cottonwood, AZ 86326
|
2,630 sq. feet
|
- baths - beds |
show details | |

|
#46
N Arturo Cir W
Camp Verde, AZ 86322
|
- sq. feet
|
- baths - beds |
show details | |

|
#47
Arturo Cir
Camp Verde, AZ 86322
|
564 sq. feet
|
- baths - beds |
show details | |

|
#48
Cross Creek Cir
Sedona, AZ 86336
|
9,222 sq. feet
|
- baths - beds |
show details | |

|
#49
E Airport Dr
Rimrock, AZ 86335
|
- sq. feet
|
- baths - beds |
show details | |

|
Check over 1 million property listings on Foreclosure.com!
|
browse all offers | |||

Latest news about housing in Cornville, AZ collected exclusively by city-data.com from local newspapers, TV, and radio stations


Median year apartment built: 1979
Household type by relationship:
Households: 3,707- Male householders: 1,014 (314 living alone), Female householders: 598 (153 living alone)
676 spouses (624 opposite-sex spouses), 299 unmarried partners, (299 opposite-sex unmarried partners), 730 children (617 natural, 0 adopted, 112 stepchildren), 168 grandchildren, 11 brothers or sisters, 73 parents, 0 foster children, 4 other relatives, 114 non-relatives
- In group quarters: 15
Size of family households: 384 2-persons, 272 3-persons, 110 4-persons, 73 5-persons, 33 7-or-more-persons.
Size of nonfamily households: 455 1-person, 243 2-persons.
317 married couples with children.
95 single-parent households (58 men, 37 women).
89.8% of residents of Cornville speak English at home.
5.5% of residents speak Spanish at home (98% speak English very well, 2% speak English well).
3.9% of residents speak other Indo-European language at home (100% speak English very well).
1.0% of residents speak Asian or Pacific Island language at home (100% speak English very well).
Foreign born population: 221 (6.0%)
(23.5% of them are naturalized citizens)
| Here: | 5.8 |
| State: | 6.0 |
| Here: | 3.8 |
| State: | 4.1 |

- Bedrooms in owner-occupied houses and condos in Cornville, Arizona
- 0no bedroom
- 1091 bedroom
- 3992 bedrooms
- 5423 bedrooms
- 1634 bedrooms
- 05+ bedrooms

- Bedrooms in renter-occupied apartments in Cornville, Arizona
- 22no bedroom
- 681 bedroom
- 842 bedrooms
- 2343 bedrooms
- 04 bedrooms
- 05+ bedrooms

- Cars and other vehicles available in Cornville in owner-occupied houses/condos
- 29no vehicle
- 1661 vehicle
- 4502 vehicles
- 3283 vehicles
- 2254 vehicles
- 175+ vehicles

- Cars and other vehicles available in Cornville in renter-occupied apartments
- 0no vehicle
- 2161 vehicle
- 1492 vehicles
- 443 vehicles
- 04 vehicles
- 05+ vehicles

- Rooms in owner-occupied houses in Cornville, Arizona
- 01 room
- 472 rooms
- 1883 rooms
- 1914 rooms
- 985 rooms
- 2576 rooms
- 1377 rooms
- 2548 rooms
- 429+ rooms

- Rooms in renter-occupied apartments in Cornville, Arizona
- 221 room
- 352 rooms
- 1103 rooms
- 834 rooms
- 75 rooms
- 366 rooms
- 937 rooms
- 08 rooms
- 219+ rooms


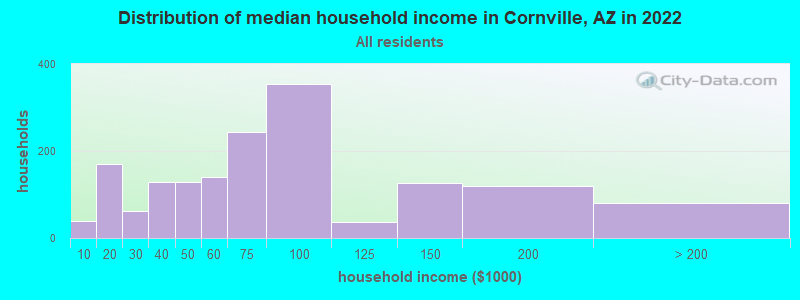
Cornville, AZ household income distribution

- 38Less than $10,000
- 170$10,000 to $19,999
- 63$20,000 to $29,999
- 128$30,000 to $39,999
- 128$40,000 to $49,999
- 141$50,000 to $59,999
- 243$60,000 to $74,999
- 355$75,000 to $99,999
- 37$100,000 to $124,999
- 126$125,000 to $149,999
- 119$150,000 to $199,999
- 81$200,000 or more
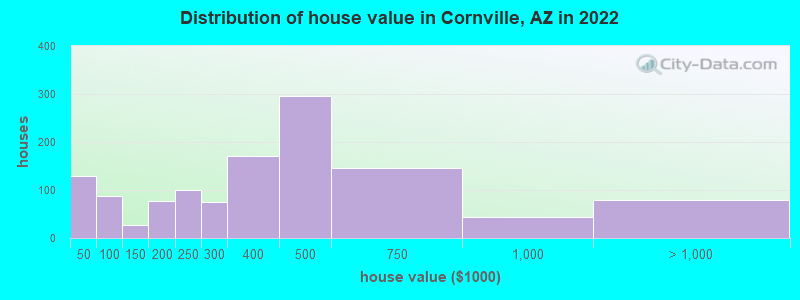
Home value of owner - occupied houses in 2022 in Cornville, AZ
-
- 75Less than $10,000
- 39$10,000 to $14,999
- 15$40,000 to $49,999
- 2$50,000 to $59,999
- 7$60,000 to $69,999
- 62$90,000 to $99,999
- 27$100,000 to $124,999
- 35$150,000 to $174,999
- 42$175,000 to $199,999
- 100$200,000 to $249,999
- 74$250,000 to $299,999
- 170$300,000 to $399,999
- 295$400,000 to $499,999
- 145$500,000 to $749,999
- 42$750,000 to $999,999
- 79$1,000,000 to $1,499,999
Rent paid by renters in 2022 in Cornville, AZ
-
- 47$500 to $549
- 12$700 to $749
- 13$800 to $899
- 201$1,000 to $1,249
- 64$1,250 to $1,499
- 30$1,500 to $1,999
- 16No cash rent


Percentage of workers working in this county: 97.4%
Number of people working at home: 386 (18.6% of all workers)
Travel time to work (commute)
- Less than 5 minutes: 5
- 5 to 9 minutes: 175
- 10 to 14 minutes: 35
- 15 to 19 minutes: 203
- 20 to 24 minutes: 527
- 25 to 29 minutes: 216
- 30 to 34 minutes: 438
- 35 to 39 minutes: 29
- 40 to 44 minutes: 0
- 45 to 59 minutes: 50
- 60 to 89 minutes: 28
- 90 or more minutes: 10
Means of transportation to work:
- Drove a car alone: 1,207 (77.0%)
- Carpooled: 270 (17.2%)
- Walked: 31 (2.0%)
- Other means: 7 (0.4%)
- Worked at home: 53 (3.4%)

- Unemployment by race in 2022
- Unemployment rate for White non-Hispanic residents
- 4.4%Males
- 1.8%Females
- Unemployment rate for Black residents
- 100.0%Males
- Unemployment rate for other race residents
- 23.1%Males
- Unemployment rate for Hispanic or Latino residents
- 13.5%Males

- Year of entry for the foreign-born population in Cornville, Arizona
- 472010 or later
- 322000 to 2009
- 401990 to 1999
- 601980 to 1989
- 351970 to 1979
- 31Before 1970

First ancestries reported:
- Irish: 233 (14.6%)
- English: 198 (12.4%)
- Slavic: 156 (9.7%)
- Polish: 137 (8.6%)
- German: 133 (8.3%)
- American: 111 (6.9%)
- Italian: 82 (5.1%)
- French: 71 (4.4%)
- Scottish: 55 (3.4%)
- Czechoslovakian: 38 (2.4%)
- Swiss: 36 (2.2%)
- Norwegian: 18 (1.1%)
- French Canadian: 16 (1.0%)
- Dutch: 15 (0.9%)
- Russian: 13 (0.8%)
Most common places of birth for foreign-born residents (%):
| Cornville: | 36.9% (82) |
| Arizona: | 53.4% (500,086) |
| Cornville: | 20.3% (45) |
| Arizona: | 0.1% (993) |
| Cornville: | 18.5% (41) |
| Arizona: | 0.2% (2,126) |
| Cornville: | 12.2% (27) |
| Arizona: | 1.5% (14,058) |
| Cornville: | 9.0% (20) |
| Arizona: | 0.4% (3,584) |
| Cornville: | 5.0% (11) |
| Arizona: | 0.4% (4,190) |
Place of birth for U.S.-born residents:
- This state: 1,147
- Other state: 2,272
- Northeast: 538
- Midwest: 575
- South: 216
- West: 946
83.5% of Cornville residents lived in the same house 1 years ago.
Out of people who lived in different houses, 37.5% lived in this county.
Out of people who lived in different counties, 3.2% lived in Arizona.
| Cornville: | 83.5% |
| State average: | 86.0% |
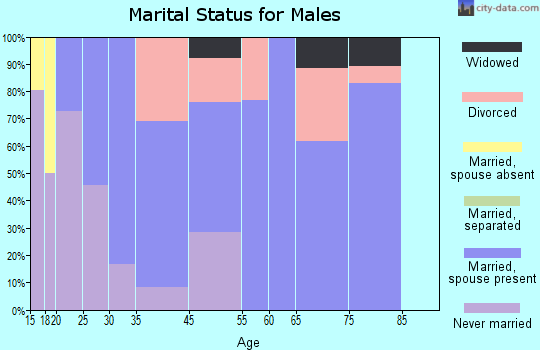
Education attainment for males 25 years and older:
- No schooling: 51
- Nursery to 4th grade: 0
- 5th and 6th grade: 0
- 7th and 8th grade: 0
- 9th grade: 71
- 10th grade: 4
- 11th grade: 5
- 12th grade, no diploma: 0
- High school graduate (or equivalency): 559
- Less than 1 year of college: 84
- Some college more than 1 year, no degree: 216
- Associate degree: 95
- Bachelor's degree: 224
- Master's degree: 93
- Professional school degree: 34
- Doctorate degree: 38

Education attainment for females 25 years and older:
- No schooling: 12
- Nursery to 4th grade: 0
- 5th and 6th grade: 0
- 7th and 8th grade: 0
- 9th grade: 0
- 10th grade: 0
- 11th grade: 43
- 12th grade, no diploma: 0
- High school graduate (or equivalency): 539
- Less than 1 year of college: 104
- Some college more than 1 year, no degree: 155
- Associate degree: 286
- Bachelor's degree: 162
- Master's degree: 107
- Professional school degree: 22
- Doctorate degree: 0

Housing units in structures:
- One, detached: 1,115
- One, attached: 29
- 5 to 9: 50
- 10 to 19: 7
- Mobile homes: 426
- Boats, RVs, vans, etc.: 93
Median worth of mobile homes: $276,472
Housing units lacking complete kitchen facilities in 2022: 3.0%
House/condo owner moved in on average 14 years ago
Renter moved in on average 2 years ago

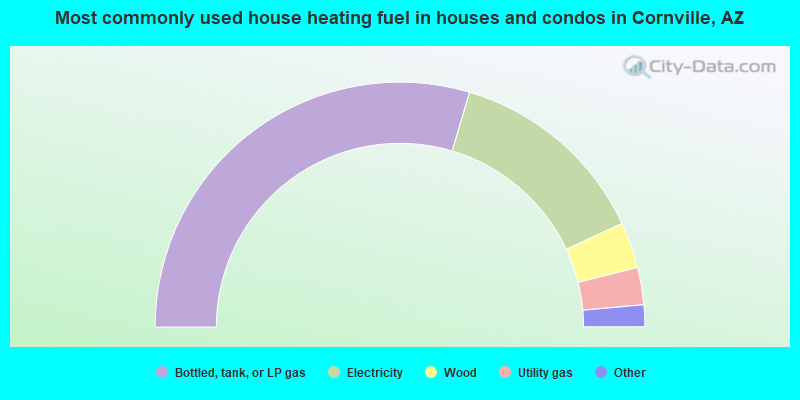
- 59.3%Bottled, tank, or LP gas
- 27.0%Electricity
- 6.1%Wood
- 4.9%Utility gas
- 2.1%Fuel oil, kerosene, etc.
- 0.6%Solar energy
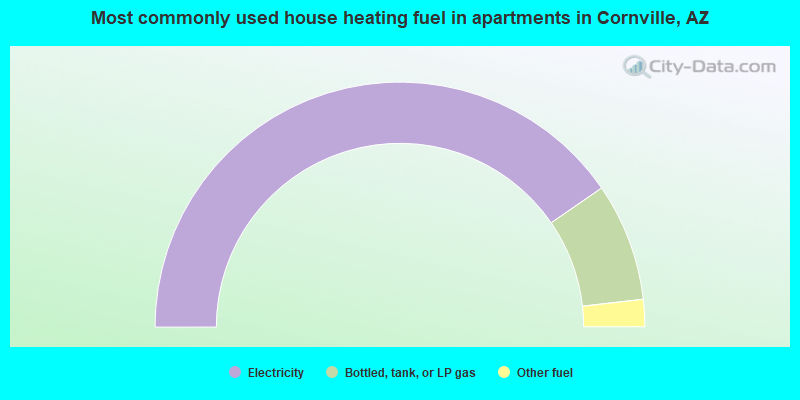
- 80.9%Electricity
- 15.6%Bottled, tank, or LP gas
- 3.6%Other fuel
Private vs. public school enrollment:
| Here: | 0.0% |
| Arizona: | 10.4% |
| Here: | 5.7% |
| Arizona: | 8.8% |
| Here: | 42.3% |
| Arizona: | 13.1% |


