Cutlerville, MI (Michigan) Houses and Residents
| Cutlerville: | $217,692 |
| Michigan: | $224,400 |
Mean price in 2022:
Detached houses: $253,400
Here: $253,400 State: $280,038 Townhouses or other attached units: $231,857
Here: $231,857 State: $239,520 In 3-to-4-unit structures: $213,332
Here: $213,332 State: $207,067 In 5-or-more-unit structures: $105,479
Here: $105,479 State: $192,733 Mobile homes: $26,118
Here: $26,118 State: $72,868
Total population: 14,370 (All urban)
Houses: 7,299 (6,990 occupied: 4,799 owner occupied, 2,188 renter occupied)
| % of renters here: | 31% |
| State: | 27% |
Housing density: 1,220 houses/condos per square mile
Median price asked for vacant for-sale houses and condos in 2022: $350,688.
Median contract rent in 2022: $1,051 (lower quartile is $853, upper quartile is $1,255)
Median rent asked for vacant for-rent units in 2022: $882
Median gross rent in Cutlerville, MI in 2022: $1,179
Housing units in Cutlerville with a mortgage: 2,211 (115 second mortgage, 0 home equity loan, 88 both second mortgage and home equity loan)
Houses without a mortgage: 76
Median household income for houses/condos with a mortgage: $98,069
Median household income for apartments without a mortgage: $59,824
Median monthly housing costs: $1,005
Compare current foreclosures near Cutlerville, MI:
| Photo | Address | Area | Beds / Baths | Price | Details |
|---|---|---|---|---|---|

|
#1
Union Ave SE
Grand Rapids, MI 49548
|
1,467 sq. feet
|
2 baths 3 beds |
$295,000
|
show details |

|
#2
Sabal Pointe Dr SE
Grand Rapids, MI 49546
|
1,745 sq. feet
|
2 baths 2 beds |
show details | |

|
#3
Bates St SE
Grand Rapids, MI 49506
|
1,628 sq. feet
|
1 baths 5 beds |
show details | |

|
#4
Hanchett Ave NW
Grand Rapids, MI 49504
|
1,932 sq. feet
|
2 baths 3 beds |
show details | |

|
#5
Fenwick St NW
Grand Rapids, MI 49534
|
1,260 sq. feet
|
1 baths 3 beds |
show details | |

|
#6
52nd St SE
Grand Rapids, MI 49508
|
877 sq. feet
|
1 baths 2 beds |
show details | |

|
#7
Schoolside Ct
Hudsonville, MI 49426
|
1,609 sq. feet
|
3 baths 4 beds |
show details | |

|
#8
Mccarty St NW # 13
Grand Rapids, MI 49544
|
1,374 sq. feet
|
1 baths 3 beds |
show details | |

|
#9
Edgelawn Dr SE
Grand Rapids, MI 49508
|
1,280 sq. feet
|
2 baths 3 beds |
show details | |

|
#10
W Garbow Rd
Middleville, MI 49333
|
2,521 sq. feet
|
2 baths 3 beds |
show details |
| Photo | Address | Area | Beds / Baths | Price | Details |
|---|---|---|---|---|---|

|
#11
Creek Bluff Pl NW
Grand Rapids, MI 49504
|
1,805 sq. feet
|
1 baths 4 beds |
show details | |

|
#12
Alyssum Dr SE
Grand Rapids, MI 49512
|
1,560 sq. feet
|
2 baths 3 beds |
show details | |

|
#13
Nevada Ridge Dr SW
Byron Center, MI 49315
|
979 sq. feet
|
1 baths 2 beds |
show details | |

|
#14
Byron Center Ave SW
Wyoming, MI 49519
|
1,089 sq. feet
|
4 baths 3 beds |
show details | |

|
#15
Paramount Dr NE
Grand Rapids, MI 49525
|
1,623 sq. feet
|
3 baths 4 beds |
show details | |

|
#16
68th St SE
Caledonia, MI 49316
|
1,177 sq. feet
|
1 baths 3 beds |
show details | |

|
#17
Port Sheldon St
Hudsonville, MI 49426
|
1,025 sq. feet
|
1 baths 3 beds |
show details | |

|
#18
Saint Charles Ave SW
Grand Rapids, MI 49507
|
975 sq. feet
|
1 baths 3 beds |
show details | |

|
#19
Burton St SW
Grand Rapids, MI 49507
|
1,352 sq. feet
|
2 baths 5 beds |
show details | |

|
#20
Fuller Ave NE
Grand Rapids, MI 49503
|
1,550 sq. feet
|
1 baths 3 beds |
show details |
| Photo | Address | Area | Beds / Baths | Price | Details |
|---|---|---|---|---|---|

|
#21
Alger St SE
Grand Rapids, MI 49546
|
2,342 sq. feet
|
2 baths 4 beds |
show details | |

|
#22
E Saxony Dr SE
Grand Rapids, MI 49508
|
1,193 sq. feet
|
1 baths 2 beds |
show details | |

|
#23
Longstreet Ave SW
Wyoming, MI 49509
|
924 sq. feet
|
1 baths 2 beds |
show details | |

|
#24
3rd St NW
Grand Rapids, MI 49504
|
876 sq. feet
|
1 baths 3 beds |
show details | |

|
#25
Margaret Ave SE
Grand Rapids, MI 49507
|
1,278 sq. feet
|
1 baths 3 beds |
show details | |

|
#26
Joan Dr
Dorr, MI 49323
|
864 sq. feet
|
1 baths 3 beds |
show details | |

|
#27
E Town Dr
Hudsonville, MI 49426
|
- sq. feet
|
2 baths 2 beds |
show details | |

|
#28
Cogswell St NW
Grand Rapids, MI 49544
|
- sq. feet
|
2 baths 3 beds |
show details | |

|
#29
Howard St SE
Grand Rapids, MI 49507
|
1,232 sq. feet
|
1 baths - beds |
show details | |

|
#30
Bentbrook St SE
Grand Rapids, MI 49508
|
- sq. feet
|
2 baths 3 beds |
show details |
| Photo | Address | Area | Beds / Baths | Price | Details |
|---|---|---|---|---|---|

|
#31
Nelson Ave SE
Grand Rapids, MI 49507
|
1,088 sq. feet
|
1 baths - beds |
show details | |

|
#32
W Main St
Hopkins, MI 49328
|
1,411 sq. feet
|
1 baths 3 beds |
show details | |

|
#33
W Main St
Hopkins, MI 49328
|
1,086 sq. feet
|
1 baths 3 beds |
show details | |

|
#34
Selby St
Hopkins, MI 49328
|
1,620 sq. feet
|
3 baths 4 beds |
show details | |

|
#35
Hilltop Dr
Middleville, MI 49333
|
1,008 sq. feet
|
1 baths 3 beds |
show details | |

|
#36
Sandy Dr
Dorr, MI 49323
|
1,630 sq. feet
|
2 baths 4 beds |
show details | |

|
#37
Port Sheldon St
Hudsonville, MI 49426
|
- sq. feet
|
2 baths 3 beds |
show details | |

|
#38
Colrain St SE
Grand Rapids, MI 49548
|
- sq. feet
|
3 baths 4 beds |
show details | |

|
#39
Red Pine Dr
Dorr, MI 49323
|
1,140 sq. feet
|
1 baths 2 beds |
show details | |

|
#40
141st Ave
Wayland, MI 49348
|
2,305 sq. feet
|
2 baths - beds |
show details |
| Photo | Address | Area | Beds / Baths | Price | Details |
|---|---|---|---|---|---|

|
#41
21st St
Dorr, MI 49323
|
1,404 sq. feet
|
1 baths - beds |
show details | |

|
#42
N Whitneyville Rd
Middleville, MI 49333
|
1,595 sq. feet
|
2 baths - beds |
show details | |

|
#43
W Parmalee Rd
Middleville, MI 49333
|
1,570 sq. feet
|
2 baths - beds |
show details | |

|
#44
Stratford Ave
Dorr, MI 49323
|
1,008 sq. feet
|
1 baths - beds |
show details | |

|
#45
Litchfield Dr
Dorr, MI 49323
|
900 sq. feet
|
1 baths - beds |
show details | |

|
#46
142nd Ave
Wayland, MI 49348
|
1,496 sq. feet
|
2 baths - beds |
show details | |

|
#47
124th Ave
Shelbyville, MI 49344
|
1,539 sq. feet
|
1 baths - beds |
show details | |

|
#48
Park Dr
Wayland, MI 49348
|
1,486 sq. feet
|
2 baths - beds |
show details | |

|
#49
128th Ave
Shelbyville, MI 49344
|
1,075 sq. feet
|
1 baths - beds |
show details | |

|
Check over 1 million property listings on Foreclosure.com!
|
browse all offers | |||

Latest news about housing in Cutlerville, MI collected exclusively by city-data.com from local newspapers, TV, and radio stations

 | Grand Rapids affordability for the retired? (2 replies) |
| Grand Rapids Beer economy (37 replies) |
| Could Grand Rapids be right for me? (12 replies) |
| Accepted job in Kentwood, MI... looking for a good area to relocate to? (10 replies) |
| Byron Center, MI for culturally open-minded?? (10 replies) |

Median year apartment built: 1992
Household type by relationship:
Households: 19,332- Male householders: 3,617 (881 living alone), Female householders: 3,293 (731 living alone)
2,784 spouses (2,770 opposite-sex spouses), 594 unmarried partners, (594 opposite-sex unmarried partners), 5,904 children (5,364 natural, 167 adopted, 372 stepchildren), 522 grandchildren, 490 brothers or sisters, 247 parents, 0 foster children, 443 other relatives, 1,200 non-relatives
- In group quarters: 233
Size of family households: 1,907 2-persons, 981 3-persons, 680 4-persons, 299 5-persons, 332 6-persons, 298 7-or-more-persons.
Size of nonfamily households: 1,704 1-person, 782 2-persons, 30 3-persons, 25 5-persons, 17 6-persons.
2,833 married couples with children.
1,737 single-parent households (272 men, 1,465 women).
83.4% of residents of Cutlerville speak English at home.
7.9% of residents speak Spanish at home (64% speak English very well, 24% speak English well, 10% speak English not well, 3% don't speak English at all).
4.5% of residents speak other Indo-European language at home (57% speak English very well, 2% speak English well, 41% speak English not well).
3.1% of residents speak Asian or Pacific Island language at home (29% speak English very well, 36% speak English well, 30% speak English not well, 4% don't speak English at all).
1.7% of residents speak other language at home (81% speak English very well, 13% speak English well, 6% speak English not well).
Foreign born population: 1,625 (8.4%)
(30.3% of them are naturalized citizens)
| Here: | 6.0 |
| State: | 6.5 |
| Here: | 4.0 |
| State: | 4.3 |

- Bedrooms in owner-occupied houses and condos in Cutlerville, Michigan
- 45no bedroom
- 1141 bedroom
- 1,4962 bedrooms
- 2,0623 bedrooms
- 8604 bedrooms
- 2235+ bedrooms

- Bedrooms in renter-occupied apartments in Cutlerville, Michigan
- 58no bedroom
- 4661 bedroom
- 9972 bedrooms
- 4963 bedrooms
- 1264 bedrooms
- 475+ bedrooms

- Cars and other vehicles available in Cutlerville in owner-occupied houses/condos
- 151no vehicle
- 1,5891 vehicle
- 2,1272 vehicles
- 6543 vehicles
- 1624 vehicles
- 1175+ vehicles

- Cars and other vehicles available in Cutlerville in renter-occupied apartments
- 68no vehicle
- 1,0881 vehicle
- 8462 vehicles
- 1693 vehicles
- 174 vehicles
- 05+ vehicles

- Rooms in owner-occupied houses in Cutlerville, Michigan
- 451 room
- 62 rooms
- 1873 rooms
- 6824 rooms
- 1,0445 rooms
- 1,0746 rooms
- 5727 rooms
- 6548 rooms
- 5369+ rooms

- Rooms in renter-occupied apartments in Cutlerville, Michigan
- 581 room
- 1442 rooms
- 4283 rooms
- 7384 rooms
- 3685 rooms
- 1426 rooms
- 1427 rooms
- 978 rooms
- 729+ rooms


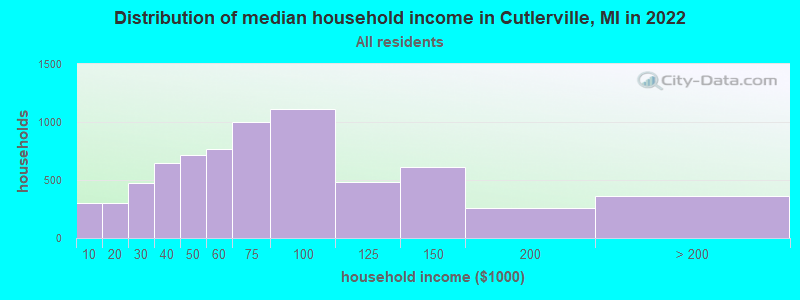
Cutlerville, MI household income distribution

- 301Less than $10,000
- 300$10,000 to $19,999
- 474$20,000 to $29,999
- 648$30,000 to $39,999
- 716$40,000 to $49,999
- 770$50,000 to $59,999
- 998$60,000 to $74,999
- 1,116$75,000 to $99,999
- 483$100,000 to $124,999
- 610$125,000 to $149,999
- 258$150,000 to $199,999
- 363$200,000 or more
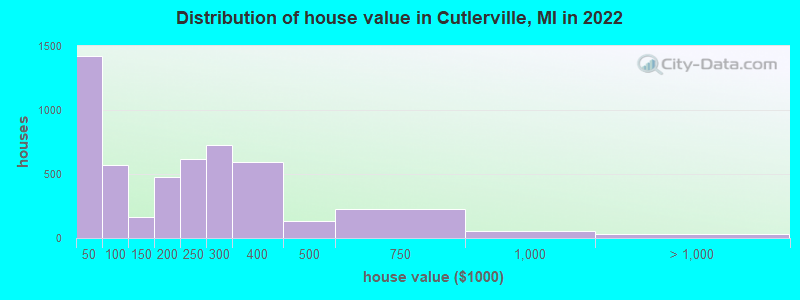
Home value of owner - occupied houses in 2022 in Cutlerville, MI
-
- 548Less than $10,000
- 155$10,000 to $14,999
- 68$15,000 to $19,999
- 57$20,000 to $24,999
- 51$25,000 to $29,999
- 108$30,000 to $34,999
- 427$40,000 to $49,999
- 24$50,000 to $59,999
- 54$60,000 to $69,999
- 16$70,000 to $79,999
- 24$80,000 to $89,999
- 26$90,000 to $99,999
- 81$100,000 to $124,999
- 81$125,000 to $149,999
- 196$150,000 to $174,999
- 282$175,000 to $199,999
- 621$200,000 to $249,999
- 722$250,000 to $299,999
- 594$300,000 to $399,999
- 132$400,000 to $499,999
- 229$500,000 to $749,999
- 57$750,000 to $999,999
- 27$1,000,000 to $1,499,999
Rent paid by renters in 2022 in Cutlerville, MI
-
- 13$250 to $299
- 9$350 to $399
- 53$500 to $549
- 40$550 to $599
- 28$600 to $649
- 99$650 to $699
- 54$700 to $749
- 159$750 to $799
- 259$800 to $899
- 326$900 to $999
- 664$1,000 to $1,249
- 248$1,250 to $1,499
- 181$1,500 to $1,999
- 54No cash rent


Percentage of workers working in this county: 93.7%
Number of people working at home: 752 (7.4% of all workers)
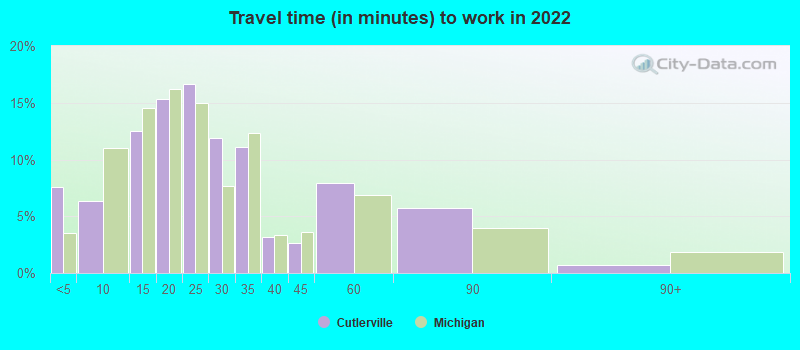
Travel time to work (commute)
- Less than 5 minutes: 724
- 5 to 9 minutes: 858
- 10 to 14 minutes: 1,693
- 15 to 19 minutes: 2,064
- 20 to 24 minutes: 1,471
- 25 to 29 minutes: 557
- 30 to 34 minutes: 1,098
- 35 to 39 minutes: 101
- 40 to 44 minutes: 50
- 45 to 59 minutes: 310
- 60 to 89 minutes: 345
- 90 or more minutes: 129
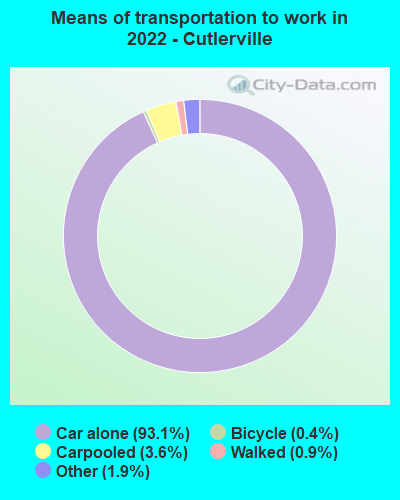
Means of transportation to work:
- Drove a car alone: 4,902 (81.4%)
- Carpooled: 196 (3.3%)
- Taxi: 143 (2.4%)
- Bicycle: 22 (0.4%)
- Walked: 47 (0.8%)
- Worked at home: 752 (12.5%)

- Unemployment by race in 2022
- Unemployment rate for White non-Hispanic residents
- 2.6%Males
- 1.0%Females
- Unemployment rate for Black residents
- 8.4%Males
- 9.2%Females
- Unemployment rate for Asian residents
- 2.3%Males
- 5.8%Females
- Unemployment rate for other race residents
- 10.1%Males
- Unemployment rate for two or more race residents
- 3.2%Males
- Unemployment rate for Hispanic or Latino residents
- 8.7%Males

- Year of entry for the foreign-born population in Cutlerville, Michigan
- 8762010 or later
- 3572000 to 2009
- 2461990 to 1999
- 1531980 to 1989
- 1161970 to 1979
- 152Before 1970

First ancestries reported:
- Dutch: 1,569 (16.3%)
- English: 886 (9.2%)
- German: 873 (9.1%)
- American: 736 (7.7%)
- African: 381 (4.0%)
- Irish: 270 (2.8%)
- European: 169 (1.8%)
- Polish: 164 (1.7%)
- German Russian: 156 (1.6%)
- Italian: 70 (0.7%)
- French: 59 (0.6%)
- Hungarian: 40 (0.4%)
- Czech: 32 (0.3%)
- Greek: 32 (0.3%)
- Swedish: 31 (0.3%)
- Yugoslavian: 31 (0.3%)
- Liberian: 27 (0.3%)
- Scottish: 25 (0.3%)
- Norwegian: 22 (0.2%)
- French Canadian: 19 (0.2%)
- Latvian: 17 (0.2%)
- Lithuanian: 15 (0.2%)
- Canadian: 12 (0.1%)
- Croatian: 12 (0.1%)
- Finnish: 12 (0.1%)
- Celtic: 9 (0.09%)
- Danish: 9 (0.09%)
- Scotch-Irish: 8 (0.08%)
- British: 7 (0.07%)
- Portuguese: 3 (0.03%)
Most common places of birth for foreign-born residents (%):
| Cutlerville: | 22.2% (346) |
| Michigan: | 1.8% (12,679) |
| Cutlerville: | 18.4% (287) |
| Michigan: | 0.2% (1,416) |
| Cutlerville: | 10.6% (166) |
| Michigan: | 10.9% (75,965) |
| Cutlerville: | 6.4% (100) |
| Michigan: | 1.0% (7,097) |
| Cutlerville: | 5.9% (92) |
| Michigan: | 0.6% (4,087) |
| Cutlerville: | 5.3% (83) |
| Michigan: | 4.9% (34,295) |
| Cutlerville: | 4.2% (66) |
| Michigan: | 0.1% (825) |
| Cutlerville: | 4.2% (66) |
| Michigan: | 0.1% (963) |
| Cutlerville: | 4.2% (65) |
| Michigan: | 0.5% (3,798) |
| Cutlerville: | 3.8% (60) |
| Michigan: | 0.4% (2,853) |
| Cutlerville: | 3.5% (54) |
| Michigan: | 0.1% (918) |
| Cutlerville: | 2.4% (37) |
| Michigan: | 0.1% (547) |
| Cutlerville: | 2.4% (37) |
| Michigan: | 5.0% (35,052) |
| Cutlerville: | 2.0% (32) |
| Michigan: | 0.9% (6,009) |
| Cutlerville: | 1.7% (26) |
| Michigan: | 0.2% (1,679) |
| Cutlerville: | 1.5% (24) |
| Michigan: | 0.9% (6,481) |
Place of birth for U.S.-born residents:
- This state: 14,662
- Other state: 2,692
- Northeast: 327
- Midwest: 1,207
- South: 745
- West: 388
85.6% of Cutlerville residents lived in the same house 1 years ago.
Out of people who lived in different houses, 42.4% lived in this county.
Out of people who lived in different counties, 72.0% lived in Michigan.
| Cutlerville: | 85.6% |
| State average: | 88.4% |
Education attainment for males 25 years and older:
- No schooling: 185
- Nursery to 4th grade: 15
- 5th and 6th grade: 17
- 7th and 8th grade: 29
- 9th grade: 78
- 10th grade: 109
- 11th grade: 253
- 12th grade, no diploma: 232
- High school graduate (or equivalency): 2,559
- Less than 1 year of college: 407
- Some college more than 1 year, no degree: 712
- Associate degree: 464
- Bachelor's degree: 1,106
- Master's degree: 117
- Professional school degree: 30
- Doctorate degree: 41

Education attainment for females 25 years and older:
- No schooling: 304
- Nursery to 4th grade: 78
- 5th and 6th grade: 33
- 7th and 8th grade: 2
- 9th grade: 0
- 10th grade: 70
- 11th grade: 0
- 12th grade, no diploma: 93
- High school graduate (or equivalency): 2,367
- Less than 1 year of college: 505
- Some college more than 1 year, no degree: 669
- Associate degree: 629
- Bachelor's degree: 1,057
- Master's degree: 310
- Professional school degree: 12
- Doctorate degree: 113


Housing units in structures:
- One, detached: 2,551
- One, attached: 1,484
- Two: 61
- 3 or 4: 130
- 5 to 9: 298
- 10 to 19: 570
- 20 to 49: 248
- 50 or more: 32
- Mobile homes: 1,920
Median worth of mobile homes: $13,280
House/condo owner moved in on average 9 years ago
Renter moved in on average 3 years ago

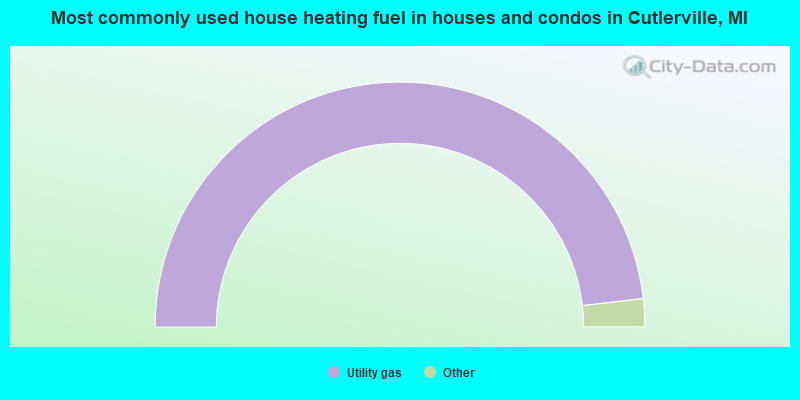
- 96.3%Utility gas
- 3.0%Electricity
- 0.4%Wood
- 0.3%Bottled, tank, or LP gas
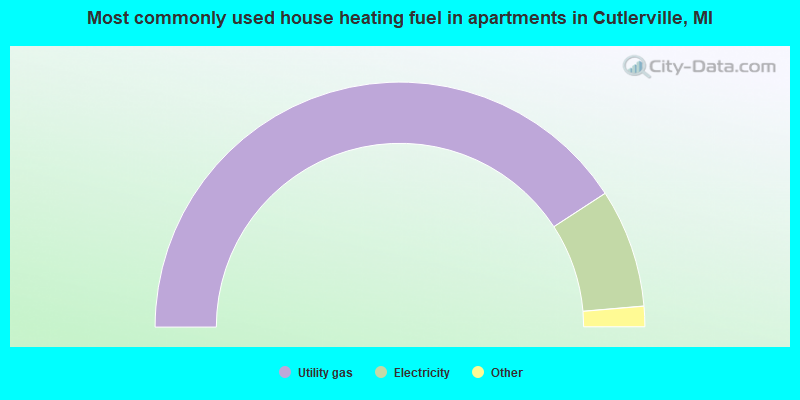
- 81.8%Utility gas
- 15.7%Electricity
- 1.5%No fuel used
- 1.1%Bottled, tank, or LP gas
Private vs. public school enrollment:
| Here: | 13.7% |
| Michigan: | 12.4% |
| Here: | 14.9% |
| Michigan: | 9.8% |
| Here: | 25.2% |
| Michigan: | 14.9% |


