Danvers, IL (Illinois) Houses and Residents
| Danvers: | $155,674 |
| Illinois: | $251,600 |
Mean price in 2022:
Detached houses: $160,128
Here: $160,128 State: $310,164
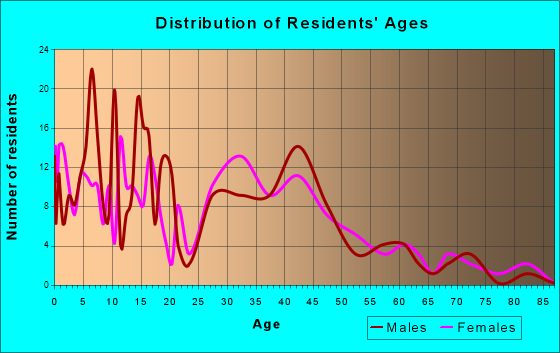
Total population: 1,147 (Urban population: 0, Rural population: 1,193 (12 farm, 1,181 nonfarm))
Houses: 425 (405 occupied: 352 owner occupied, 52 renter occupied)
| % of renters here: | 13% |
| State: | 33% |
Housing density: 492 houses/condos per square mile
Median price asked for vacant for-sale houses and condos in 2022 in this county: $84,845.
Median contract rent in 2022: $675 (lower quartile is $600, upper quartile is $807)
Median rent asked for vacant for-rent units in 2022: $626
Median gross rent in Danvers, IL in 2022: $1,119
Housing units in Danvers with a mortgage: 266 (12 second mortgage, 0 home equity loan, 11 both second mortgage and home equity loan)
Houses without a mortgage: 33
Median household income for houses/condos with a mortgage: $77,253
Median household income for apartments without a mortgage: $56,338
Median monthly housing costs: $1,222
Compare current foreclosures near Danvers, IL:
| Photo | Address | Area | Beds / Baths | Price | Details |
|---|---|---|---|---|---|

|
#1
E 1st St
El Paso, IL 61738
|
1,930 sq. feet
|
3 baths 6 beds |
show details | |

|
#2
S Prairie St
Bloomington, IL 61701
|
1,544 sq. feet
|
1 baths 3 beds |
show details | |

|
#3
Us Highway 150
Goodfield, IL 61742
|
2,300 sq. feet
|
2 baths 5 beds |
show details | |

|
#4
Rowe Dr
Bloomington, IL 61701
|
1,188 sq. feet
|
3 baths 3 beds |
show details | |

|
#5
W Oakland Ave
Bloomington, IL 61701
|
924 sq. feet
|
1 baths 2 beds |
show details | |

|
#6
S East St
Bloomington, IL 61701
|
1,868 sq. feet
|
2 baths 3 beds |
show details | |

|
#7
Walnut St
Washington, IL 61571
|
2,350 sq. feet
|
2 baths 5 beds |
show details | |

|
#8
North St
Armington, IL 61721
|
1,120 sq. feet
|
1 baths 3 beds |
show details | |

|
#9
N Jackson St
Deer Creek, IL 61733
|
1,800 sq. feet
|
2 baths 3 beds |
show details | |

|
#10
E Washington St
Bloomington, IL 61704
|
1,215 sq. feet
|
2 baths 4 beds |
show details |
| Photo | Address | Area | Beds / Baths | Price | Details |
|---|---|---|---|---|---|

|
#11
W Monroe St
Towanda, IL 61776
|
1,163 sq. feet
|
1 baths - beds |
show details | |

|
#12
S Monroe St
Armington, IL 61721
|
1,075 sq. feet
|
1 baths 3 beds |
show details | |

|
#13
S Indiana Ave
Morton, IL 61550
|
1,384 sq. feet
|
2 baths 3 beds |
show details | |

|
#14
W Wick St
Morton, IL 61550
|
1,267 sq. feet
|
2 baths 2 beds |
show details | |

|
#15
Yorkshire Dr
Mackinaw, IL 61755
|
1,479 sq. feet
|
3 baths 3 beds |
show details | |

|
#16
Ivy Ln
Tremont, IL 61568
|
1,232 sq. feet
|
2 baths 3 beds |
show details | |

|
#17
Bradford Dr
Mackinaw, IL 61755
|
1,544 sq. feet
|
1 baths 3 beds |
show details | |

|
#18
N Morton Ave
Morton, IL 61550
|
1,584 sq. feet
|
1 baths 3 beds |
show details | |

|
#19
Wilshire Wood Dr
Mackinaw, IL 61755
|
1,320 sq. feet
|
2 baths 3 beds |
show details | |

|
#20
S Fell Ave
Normal, IL 61761
|
1,930 sq. feet
|
- baths 3 beds |
show details |
| Photo | Address | Area | Beds / Baths | Price | Details |
|---|---|---|---|---|---|

|
#21
E Sycamore St
Normal, IL 61761
|
2,884 sq. feet
|
- baths 4 beds |
show details | |

|
#22
N Linden St
Normal, IL 61761
|
1,524 sq. feet
|
- baths 3 beds |
show details | |

|
#23
Labrador Ln
Normal, IL 61761
|
2,243 sq. feet
|
- baths 5 beds |
show details | |

|
#24
S Linden St
Normal, IL 61761
|
804 sq. feet
|
- baths 2 beds |
show details | |

|
#25
Partridge Pt
Normal, IL 61761
|
1,856 sq. feet
|
- baths 3 beds |
show details | |

|
#26
Ironwood Cc Dr
Normal, IL 61761
|
2,971 sq. feet
|
- baths 4 beds |
show details | |

|
#27
Fieldcrest Ct
Normal, IL 61761
|
1,326 sq. feet
|
- baths 2 beds |
show details | |

|
#28
Bull St
Normal, IL 61761
|
1,086 sq. feet
|
- baths 3 beds |
show details | |

|
#29
Abercorn St
Normal, IL 61761
|
2,069 sq. feet
|
- baths 4 beds |
show details | |

|
#30
S Division St
Stanford, IL 61774
|
1,385 sq. feet
|
1 baths - beds |
show details |
| Photo | Address | Area | Beds / Baths | Price | Details |
|---|---|---|---|---|---|

|
#31
Walton Pl
Normal, IL 61761
|
2,170 sq. feet
|
- baths 3 beds |
show details | |

|
#32
N East St
Hudson, IL 61748
|
1,294 sq. feet
|
1 baths - beds |
show details | |

|
#33
Corrigan Way
Normal, IL 61761
|
2,018 sq. feet
|
- baths 3 beds |
show details | |

|
#34
Currie Ct
Bloomington, IL 61704
|
3,177 sq. feet
|
3 baths - beds |
show details | |

|
#35
East St
Mc Lean, IL 61754
|
868 sq. feet
|
1 baths - beds |
show details | |

|
#36
Hovey Ave
Normal, IL 61761
|
1,013 sq. feet
|
- baths 3 beds |
show details | |

|
#37
Surrey Cir
Bloomington, IL 61705
|
2,029 sq. feet
|
1 baths - beds |
show details | |

|
#38
Parktrail Rd
Normal, IL 61761
|
1,344 sq. feet
|
- baths 3 beds |
show details | |

|
#39
Belview Ave
Normal, IL 61761
|
1,020 sq. feet
|
- baths 4 beds |
show details | |

|
#40
N Grove St
Normal, IL 61761
|
1,514 sq. feet
|
- baths 3 beds |
show details |
| Photo | Address | Area | Beds / Baths | Price | Details |
|---|---|---|---|---|---|

|
#41
Rebecca Ln
Normal, IL 61761
|
1,074 sq. feet
|
- baths 3 beds |
show details | |

|
#42
E Jefferson St # 8
Bloomington, IL 61701
|
- sq. feet
|
- baths - beds |
show details | |

|
#43
Orlando Ave
Normal, IL 61761
|
- sq. feet
|
- baths - beds |
show details | |

|
#44
Yotzonot Dr Apt 303
Bloomington, IL 61704
|
- sq. feet
|
- baths - beds |
show details | |

|
#45
Orlando Ave Apt D
Normal, IL 61761
|
- sq. feet
|
- baths - beds |
show details | |

|
#46
Hall Ct
Bloomington, IL 61704
|
- sq. feet
|
- baths - beds |
show details | |

|
#47
Pine Cone Ct Apt 173
Bloomington, IL 61704
|
- sq. feet
|
- baths - beds |
show details | |

|
#48
Sassafras St
Bloomington, IL 61705
|
- sq. feet
|
- baths - beds |
show details | |

|
#49
Rainbow Ave
Bloomington, IL 61704
|
- sq. feet
|
- baths - beds |
show details | |

|
Check over 1 million property listings on Foreclosure.com!
|
browse all offers | |||

Latest news about housing in Danvers, IL collected exclusively by city-data.com from local newspapers, TV, and radio stations

Median year apartment built: 1976
Household type by relationship:
Households: 1,038- Male householders: 197 (30 living alone), Female householders: 204 (61 living alone)
248 spouses (238 opposite-sex spouses), 15 unmarried partners, (15 opposite-sex unmarried partners), 352 children (333 natural, 0 adopted, 18 stepchildren), 13 grandchildren, 0 brothers or sisters, 0 parents, 0 foster children, 0 other relatives, 3 non-relatives
Size of family households: 156 2-persons, 43 3-persons, 51 4-persons, 11 5-persons, 12 6-persons, 5 7-or-more-persons.
Size of nonfamily households: 103 1-person, 16 2-persons.
244 married couples with children.
36 single-parent households (14 men, 22 women).
97.9% of residents of Danvers speak English at home.
1.3% of residents speak Spanish at home (62% speak English very well, 38% speak English well).
Foreign born population: 9 (0.9%)
(44.4% of them are naturalized citizens)
| Here: | 6.6 |
| State: | 6.4 |
| Here: | 3.9 |
| State: | 4.1 |

- Bedrooms in owner-occupied houses and condos in Danvers, Illinois
- 0no bedroom
- 111 bedroom
- 462 bedrooms
- 1923 bedrooms
- 944 bedrooms
- 105+ bedrooms

- Bedrooms in renter-occupied apartments in Danvers, Illinois
- 0no bedroom
- 81 bedroom
- 282 bedrooms
- 133 bedrooms
- 34 bedrooms
- 05+ bedrooms

- Cars and other vehicles available in Danvers in owner-occupied houses/condos
- 3no vehicle
- 1081 vehicle
- 1422 vehicles
- 963 vehicles
- 54 vehicles
- 05+ vehicles

- Cars and other vehicles available in Danvers in renter-occupied apartments
- 0no vehicle
- 411 vehicle
- 112 vehicles
- 03 vehicles
- 04 vehicles
- 05+ vehicles

- Rooms in owner-occupied houses in Danvers, Illinois
- 01 room
- 02 rooms
- 03 rooms
- 234 rooms
- 375 rooms
- 956 rooms
- 687 rooms
- 718 rooms
- 589+ rooms

- Rooms in renter-occupied apartments in Danvers, Illinois
- 01 room
- 22 rooms
- 73 rooms
- 274 rooms
- 95 rooms
- 46 rooms
- 07 rooms
- 08 rooms
- 39+ rooms


Danvers, IL household income distribution

- 12Less than $10,000
- 22$10,000 to $19,999
- 24$20,000 to $29,999
- 35$30,000 to $39,999
- 49$40,000 to $49,999
- 24$50,000 to $59,999
- 56$60,000 to $74,999
- 54$75,000 to $99,999
- 37$100,000 to $124,999
- 15$125,000 to $149,999
- 21$150,000 to $199,999
- 51$200,000 or more

Home value of owner - occupied houses in 2022 in Danvers, IL
-
- 2Less than $10,000
- 1$10,000 to $14,999
- 3$50,000 to $59,999
- 1$60,000 to $69,999
- 3$70,000 to $79,999
- 23$80,000 to $89,999
- 2$90,000 to $99,999
- 62$100,000 to $124,999
- 60$125,000 to $149,999
- 79$150,000 to $174,999
- 49$175,000 to $199,999
- 34$200,000 to $249,999
- 6$250,000 to $299,999
- 8$300,000 to $399,999

Rent paid by renters in 2022 in Danvers, IL
-
- 1$300 to $349
- 3$350 to $399
- 6$550 to $599
- 3$600 to $649
- 9$650 to $699
- 15$800 to $899
- 3$900 to $999
- 2$1,000 to $1,249


Percentage of workers working in this county: 83.9%
Number of people working at home: 83 (17.8% of all workers)
Travel time to work (commute)
- Less than 5 minutes: 35
- 5 to 9 minutes: 32
- 10 to 14 minutes: 19
- 15 to 19 minutes: 27
- 20 to 24 minutes: 74
- 25 to 29 minutes: 42
- 30 to 34 minutes: 98
- 35 to 39 minutes: 5
- 40 to 44 minutes: 8
- 45 to 59 minutes: 8
- 60 to 89 minutes: 36
- 90 or more minutes: 26
Means of transportation to work:
- Drove a car alone: 513 (84.2%)
- Carpooled: 66 (10.8%)
- Walked: 11 (1.8%)
- Worked at home: 19 (3.1%)

- Unemployment by race in 2022
- Unemployment rate for White non-Hispanic residents
- 6.3%Males
- 4.0%Females

- Year of entry for the foreign-born population in Danvers, Illinois
- 02010 or later
- 02000 to 2009
- 01990 to 1999
- 11980 to 1989
- 51970 to 1979
- 6Before 1970

First ancestries reported:
- German: 154 (37.3%)
- English: 69 (16.7%)
- Irish: 61 (14.8%)
- American: 30 (7.3%)
- European: 27 (6.5%)
- Italian: 18 (4.4%)
- Slovak: 9 (2.2%)
- Ethiopian: 6 (1.5%)
- Polish: 5 (1.2%)
- Scottish: 5 (1.2%)
- Norwegian: 4 (1.0%)
- Scotch-Irish: 3 (0.7%)
- British: 1 (0.2%)
- French: 1 (0.2%)
Most common places of birth for foreign-born residents (%):
| Danvers: | 54.5% (6) |
| Illinois: | 0.3% (4,775) |
| Danvers: | 36.4% (4) |
| Illinois: | 34.7% (626,958) |
Place of birth for U.S.-born residents:
- This state: 840
- Other state: 181
- Northeast: 46
- Midwest: 102
- South: 21
- West: 17
98.7% of Danvers residents lived in the same house 1 years ago.
Out of people who lived in different houses, 22.7% lived in this county.
Out of people who lived in different counties, 57.1% lived in Illinois.
| Danvers: | 98.7% |
| State average: | 88.3% |
Education attainment for males 25 years and older:
- No schooling: 0
- Nursery to 4th grade: 0
- 5th and 6th grade: 1
- 7th and 8th grade: 7
- 9th grade: 2
- 10th grade: 6
- 11th grade: 0
- 12th grade, no diploma: 0
- High school graduate (or equivalency): 62
- Less than 1 year of college: 16
- Some college more than 1 year, no degree: 54
- Associate degree: 46
- Bachelor's degree: 95
- Master's degree: 0
- Professional school degree: 2
- Doctorate degree: 15

Education attainment for females 25 years and older:
- No schooling: 0
- Nursery to 4th grade: 0
- 5th and 6th grade: 0
- 7th and 8th grade: 0
- 9th grade: 4
- 10th grade: 0
- 11th grade: 0
- 12th grade, no diploma: 4
- High school graduate (or equivalency): 77
- Less than 1 year of college: 11
- Some college more than 1 year, no degree: 56
- Associate degree: 43
- Bachelor's degree: 87
- Master's degree: 64
- Professional school degree: 0
- Doctorate degree: 10

Housing units in structures:
- One, detached: 385
- Two: 3
- 3 or 4: 37
House/condo owner moved in on average 14 years ago
Renter moved in on average 5 years ago


Private vs. public school enrollment:
| Here: | 0.0% |
| Illinois: | 13.3% |
| Here: | 4.8% |
| Illinois: | 9.9% |
| Here: | 0.0% |
| Illinois: | 27.4% |


