Daytona Beach, FL (Florida) Houses and Residents
| Daytona Beach: | $258,500 |
| Florida: | $354,100 |
Mean price in 2022:
Detached houses: $313,131
Here: $313,131 State: $500,941 Townhouses or other attached units: $296,504
Here: $296,504 State: $370,869 In 2-unit structures: $571,056
Here: $571,056 State: $423,188 In 3-to-4-unit structures: $206,621
Here: $206,621 State: $309,944 In 5-or-more-unit structures: $361,277
Here: $361,277 State: $447,145 Mobile homes: $77,025
Here: $77,025 State: $113,202
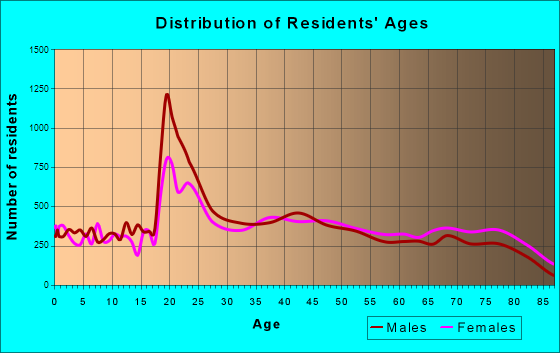
Total population: 63,011 (All urban)
Houses: 41,417 (33,732 occupied: 16,818 owner occupied, 16,914 renter occupied)
| % of renters here: | 50% |
| State: | 33% |
Housing density: 706 houses/condos per square mile
Median price asked for vacant for-sale houses and condos in 2022: $155,886.
Median contract rent in 2022: $1,114 (lower quartile is $759, upper quartile is $1,482)
Median rent asked for vacant for-rent units in 2022: $1,854
Median gross rent in Daytona Beach, FL in 2022: $1,211
Housing units in Daytona Beach with a mortgage: 7,243 (322 second mortgage, 13 home equity loan, 213 both second mortgage and home equity loan)
Houses without a mortgage: 239
Median household income for houses/condos with a mortgage: $78,361
Median household income for apartments without a mortgage: $46,816
Median monthly housing costs: $1,138
Compare current foreclosures in Daytona Beach, FL:
| Photo | Address | Area | Beds / Baths | Price | Details |
|---|---|---|---|---|---|

|
#1
Silver Beach Ave
Daytona Beach, FL 32118
|
1,125 sq. feet
|
2 baths 2 beds |
$194,750
|
show details |

|
#2
Alamanda St
Daytona Beach, FL 32114
|
1,633 sq. feet
|
2 baths 3 beds |
show details | |

|
#3
Sherwood Dr
Daytona Beach, FL 32119
|
1,310 sq. feet
|
2 baths 3 beds |
show details | |

|
#4
Virginia Ave
Daytona Beach, FL 32114
|
1,050 sq. feet
|
1 baths 3 beds |
show details | |

|
#5
Tracy St
Daytona Beach, FL 32117
|
1,539 sq. feet
|
1 baths 4 beds |
show details | |

|
#6
Sherman Rd
Daytona Beach, FL 32119
|
1,426 sq. feet
|
2 baths 3 beds |
show details | |

|
#7
Bryn Mawr Dr
Daytona Beach, FL 32114
|
1,082 sq. feet
|
1 baths 3 beds |
show details | |

|
#8
Margina Ave
Daytona Beach, FL 32114
|
1,100 sq. feet
|
3 baths 3 beds |
show details | |

|
#9
5th St
Daytona Beach, FL 32117
|
1,562 sq. feet
|
1 baths 3 beds |
show details | |

|
#10
N Peninsula Dr
Daytona Beach, FL 32118
|
1,467 sq. feet
|
3 baths 3 beds |
show details |
| Photo | Address | Area | Beds / Baths | Price | Details |
|---|---|---|---|---|---|

|
#11
Orange Ave
Daytona Beach, FL 32114
|
1,126 sq. feet
|
1 baths 3 beds |
show details | |

|
#12
Easy St
Daytona Beach, FL 32117
|
1,464 sq. feet
|
3 baths 3 beds |
show details | |

|
#13
Miami Ave
Daytona Beach, FL 32117
|
782 sq. feet
|
1 baths 2 beds |
show details | |

|
#14
N Libby Ct
Daytona Beach, FL 32117
|
1,792 sq. feet
|
3 baths 3 beds |
show details | |

|
#15
Deskin Dr
Daytona Beach, FL 32119
|
1,796 sq. feet
|
3 baths 3 beds |
show details | |

|
#16
Baywood Dr
Daytona Beach, FL 32117
|
1,899 sq. feet
|
1 baths 3 beds |
show details | |

|
#17
Bartley Rd
Daytona Beach, FL 32114
|
1,293 sq. feet
|
1 baths 3 beds |
show details | |

|
#18
W International Speedway Blvd
Daytona Beach, FL 32114
|
2,873 sq. feet
|
5 baths 5 beds |
show details | |

|
#19
Valencia Ave
Daytona Beach, FL 32117
|
986 sq. feet
|
3 baths 2 beds |
show details | |

|
#20
Pelican Bay Dr
Daytona Beach, FL 32119
|
2,448 sq. feet
|
3 baths 3 beds |
show details |
| Photo | Address | Area | Beds / Baths | Price | Details |
|---|---|---|---|---|---|

|
#21
Magnolia Ave
Daytona Beach, FL 32119
|
1,859 sq. feet
|
3 baths 3 beds |
show details | |

|
#22
Lockhart St
Daytona Beach, FL 32114
|
1,300 sq. feet
|
2 baths 3 beds |
show details | |

|
#23
Florida Blvd
Daytona Beach, FL 32119
|
1,140 sq. feet
|
3 baths 3 beds |
show details | |

|
#24
Bender Ave
Daytona Beach, FL 32117
|
575 sq. feet
|
1 baths 1 beds |
show details | |

|
#25
Berkshire Rd
Daytona Beach, FL 32117
|
1,325 sq. feet
|
1 baths 3 beds |
show details | |

|
#26
Weaver St
Daytona Beach, FL 32114
|
1,188 sq. feet
|
1 baths 2 beds |
show details | |

|
#27
Daytona Ave
Daytona Beach, FL 32117
|
884 sq. feet
|
1 baths 2 beds |
show details | |

|
#28
Peter Rd
Daytona Beach, FL 32114
|
1,757 sq. feet
|
2 baths 3 beds |
show details | |

|
#29
Waterthrush Ct
Daytona Beach, FL 32119
|
1,427 sq. feet
|
2 baths 3 beds |
show details | |

|
#30
Boulder Dr
Daytona Beach, FL 32119
|
920 sq. feet
|
1 baths 2 beds |
show details |
| Photo | Address | Area | Beds / Baths | Price | Details |
|---|---|---|---|---|---|

|
#31
Greene Ave
Daytona Beach, FL 32114
|
1,586 sq. feet
|
3 baths 3 beds |
show details | |

|
#32
N Patrick Cir
Daytona Beach, FL 32117
|
1,026 sq. feet
|
2 baths 3 beds |
show details | |

|
#33
Westwood Dr
Daytona Beach, FL 32119
|
1,504 sq. feet
|
3 baths 2 beds |
show details | |

|
#34
Moore St
Daytona Beach, FL 32114
|
1,606 sq. feet
|
4 baths 3 beds |
show details | |

|
#35
Florida Blvd
Daytona Beach, FL 32119
|
988 sq. feet
|
3 baths 2 beds |
show details | |

|
#36
Old Big Tree Rd
Daytona Beach, FL 32119
|
875 sq. feet
|
1 baths 2 beds |
show details | |

|
#37
Gull Dr S
Daytona Beach, FL 32119
|
2,091 sq. feet
|
3 baths 3 beds |
show details | |

|
#38
S Lanvale Ave
Daytona Beach, FL 32114
|
1,270 sq. feet
|
1 baths 2 beds |
show details | |

|
#39
Jackson Ave
Daytona Beach, FL 32117
|
1,494 sq. feet
|
3 baths 3 beds |
show details | |

|
#40
Sunset Cir
Daytona Beach, FL 32117
|
1,117 sq. feet
|
3 baths 2 beds |
show details |
| Photo | Address | Area | Beds / Baths | Price | Details |
|---|---|---|---|---|---|

|
#41
White St
Daytona Beach, FL 32114
|
1,506 sq. feet
|
1 baths 3 beds |
show details | |

|
#42
Euclid Ave
Daytona Beach, FL 32118
|
1,240 sq. feet
|
3 baths 3 beds |
show details | |

|
#43
Revere Ln
Daytona Beach, FL 32117
|
848 sq. feet
|
1 baths 2 beds |
show details | |

|
#44
Loon Ct
Daytona Beach, FL 32119
|
1,673 sq. feet
|
2 baths 3 beds |
show details | |

|
#45
S Caroline St
Daytona Beach, FL 32114
|
946 sq. feet
|
2 baths 2 beds |
show details | |

|
#46
E Paradise Ln
Daytona Beach, FL 32119
|
2,414 sq. feet
|
3 baths 3 beds |
show details | |

|
#47
Blanche Pl
Daytona Beach, FL 32114
|
1,080 sq. feet
|
3 baths 2 beds |
show details | |

|
#48
Big Tree Rd Apt 304
Daytona Beach, FL 32119
|
864 sq. feet
|
2 baths 2 beds |
show details | |

|
#49
6th St
Daytona Beach, FL 32117
|
836 sq. feet
|
1 baths 3 beds |
show details | |

|
Check over 1 million property listings on Foreclosure.com!
|
browse all offers | |||


 | Daytona Beach New Construction Condos (5 replies) |
| affordable housing and rents just took a major hit here (270 replies) |
| Looking for Indian community apartments in Daytona Beach areas (9 replies) |
| lot rents for modular homes (11 replies) |
| Daytona Beach real estate agent suggenstions needed.... (1 reply) |
| Daytona Beach, Watch out home buyers! (4 replies) |
Median year apartment built: 1984
Household type by relationship:
Households: 77,957- Male householders: 18,975 (8,548 living alone), Female householders: 14,757 (5,264 living alone)
10,435 spouses (10,187 opposite-sex spouses), 3,438 unmarried partners, (2,912 opposite-sex unmarried partners), 15,473 children (14,685 natural, 526 adopted, 262 stepchildren), 782 grandchildren, 663 brothers or sisters, 1,522 parents, 0 foster children, 1,251 other relatives, 2,838 non-relatives
- In group quarters: 7,823
Size of family households: 8,610 2-persons, 3,745 3-persons, 2,464 4-persons, 1,126 5-persons, 196 6-persons, 126 7-or-more-persons.
Size of nonfamily households: 13,086 1-person, 3,966 2-persons, 281 3-persons, 38 4-persons, 15 5-persons, 24 6-persons.
3,395 married couples with children.
6,525 single-parent households (1,111 men, 5,414 women).
87.2% of residents of Daytona Beach speak English at home.
7.1% of residents speak Spanish at home (72% speak English very well, 17% speak English well, 8% speak English not well, 4% don't speak English at all).
2.9% of residents speak other Indo-European language at home (71% speak English very well, 24% speak English well, 4% speak English not well, 1% don't speak English at all).
2.3% of residents speak Asian or Pacific Island language at home (52% speak English very well, 30% speak English well, 18% speak English not well).
0.8% of residents speak other language at home (71% speak English very well, 22% speak English well, 6% speak English not well).
Foreign born population: 9,370 (12.0%)
(56.4% of them are naturalized citizens)
| Here: | 5.4 |
| State: | 5.9 |
| Here: | 4.0 |
| State: | 4.2 |

- Bedrooms in owner-occupied houses and condos in Daytona Beach, Florida
- 235no bedroom
- 3971 bedroom
- 5,7112 bedrooms
- 8,1183 bedrooms
- 1,9664 bedrooms
- 3915+ bedrooms

- Bedrooms in renter-occupied apartments in Daytona Beach, Florida
- 1,479no bedroom
- 4,6621 bedroom
- 7,7842 bedrooms
- 2,1623 bedrooms
- 5604 bedrooms
- 2675+ bedrooms

- Cars and other vehicles available in Daytona Beach in owner-occupied houses/condos
- 777no vehicle
- 7,8901 vehicle
- 5,5452 vehicles
- 2,4003 vehicles
- 2064 vehicles
- 05+ vehicles

- Cars and other vehicles available in Daytona Beach in renter-occupied apartments
- 2,470no vehicle
- 10,1841 vehicle
- 3,0782 vehicles
- 1,0743 vehicles
- 1084 vehicles
- 05+ vehicles

- Rooms in owner-occupied houses in Daytona Beach, Florida
- 1831 room
- 872 rooms
- 8113 rooms
- 3,1534 rooms
- 4,5715 rooms
- 4,0646 rooms
- 1,7657 rooms
- 8408 rooms
- 1,3449+ rooms

- Rooms in renter-occupied apartments in Daytona Beach, Florida
- 1,3861 room
- 7962 rooms
- 3,4863 rooms
- 5,6854 rooms
- 3,2865 rooms
- 1,0196 rooms
- 6387 rooms
- 4048 rooms
- 2149+ rooms


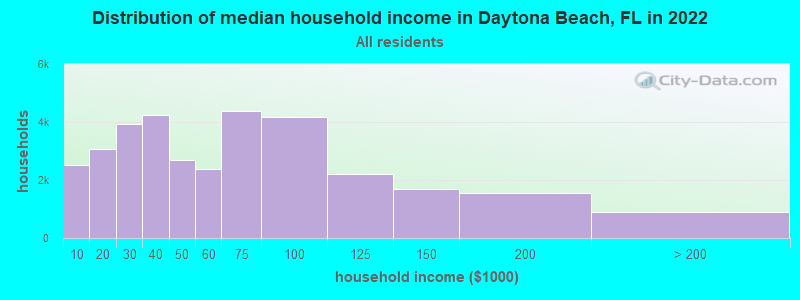
Daytona Beach, FL household income distribution

- 2,532Less than $10,000
- 3,079$10,000 to $19,999
- 3,939$20,000 to $29,999
- 4,242$30,000 to $39,999
- 2,691$40,000 to $49,999
- 2,395$50,000 to $59,999
- 4,370$60,000 to $74,999
- 4,158$75,000 to $99,999
- 2,192$100,000 to $124,999
- 1,677$125,000 to $149,999
- 1,550$150,000 to $199,999
- 907$200,000 or more
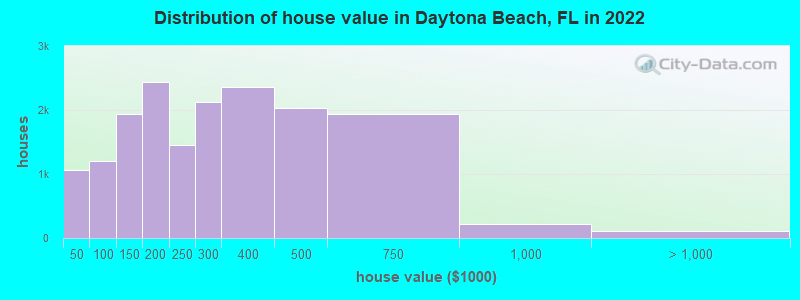
Home value of owner - occupied houses in 2022 in Daytona Beach, FL
-
- 95Less than $10,000
- 164$10,000 to $14,999
- 166$15,000 to $19,999
- 262$20,000 to $24,999
- 35$25,000 to $29,999
- 122$30,000 to $34,999
- 177$35,000 to $39,999
- 48$40,000 to $49,999
- 214$50,000 to $59,999
- 264$60,000 to $69,999
- 269$70,000 to $79,999
- 347$80,000 to $89,999
- 57$90,000 to $99,999
- 903$100,000 to $124,999
- 1,030$125,000 to $149,999
- 1,424$150,000 to $174,999
- 1,014$175,000 to $199,999
- 1,459$200,000 to $249,999
- 2,119$250,000 to $299,999
- 2,353$300,000 to $399,999
- 2,028$400,000 to $499,999
- 1,938$500,000 to $749,999
- 220$750,000 to $999,999
- 110$2,000,000 or more
Rent paid by renters in 2022 in Daytona Beach, FL
-
- 33$100 to $149
- 332$150 to $199
- 181$200 to $249
- 597$250 to $299
- 359$300 to $349
- 225$400 to $449
- 141$550 to $599
- 688$600 to $649
- 702$650 to $699
- 701$700 to $749
- 399$750 to $799
- 383$800 to $899
- 1,645$900 to $999
- 3,672$1,000 to $1,249
- 2,181$1,250 to $1,499
- 3,291$1,500 to $1,999
- 547$2,000 to $2,499
- 35$2,500 to $2,999
- 802No cash rent


Percentage of workers working in this county: 89.4%
Number of people working at home: 3,332 (10.0% of all workers)
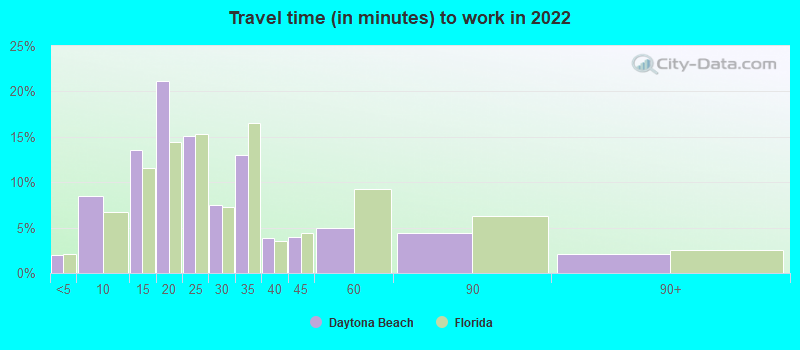
Travel time to work (commute)
- Less than 5 minutes: 934
- 5 to 9 minutes: 3,817
- 10 to 14 minutes: 4,597
- 15 to 19 minutes: 6,433
- 20 to 24 minutes: 4,987
- 25 to 29 minutes: 552
- 30 to 34 minutes: 3,245
- 35 to 39 minutes: 831
- 40 to 44 minutes: 641
- 45 to 59 minutes: 1,517
- 60 to 89 minutes: 1,276
- 90 or more minutes: 477
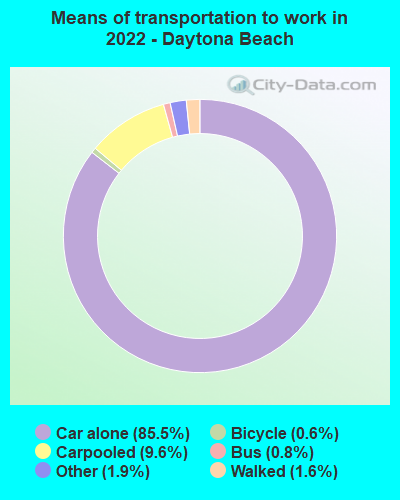
Means of transportation to work:
- Drove a car alone: 45,694 (77.0%)
- Carpooled: 5,666 (9.5%)
- Bus: 314 (0.5%)
- Taxi: 968 (1.6%)
- Bicycle: 342 (0.6%)
- Walked: 774 (1.3%)
- Worked at home: 3,332 (5.6%)

- Unemployment by race in 2022
- Unemployment rate for White non-Hispanic residents
- 3.2%Males
- 1.6%Females
- Unemployment rate for Black residents
- 2.5%Males
- 4.8%Females
- Unemployment rate for American Indian and Alaska Native residents
- 34.6%Males
- Unemployment rate for Asian residents
- 7.3%Males
- Unemployment rate for other race residents
- 11.2%Males
- 2.1%Females
- Unemployment rate for two or more race residents
- 0.9%Males
- 4.4%Females
- Unemployment rate for Hispanic or Latino residents
- 3.7%Males
- 4.6%Females

- Year of entry for the foreign-born population in Daytona Beach, Florida
- 2,9082010 or later
- 1,1412000 to 2009
- 1,0461990 to 1999
- 7301980 to 1989
- 7431970 to 1979
- 1,311Before 1970
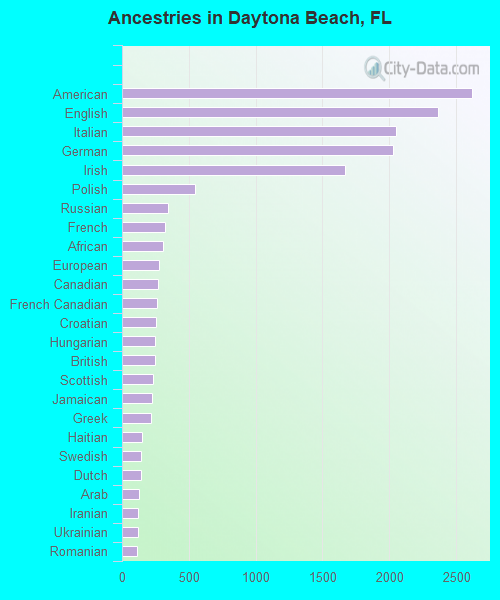
First ancestries reported:
- American: 2,615 (6.5%)
- English: 2,361 (5.9%)
- Italian: 2,050 (5.1%)
- German: 2,024 (5.0%)
- Irish: 1,666 (4.1%)
- Polish: 543 (1.4%)
- Russian: 347 (0.9%)
- French: 319 (0.8%)
- African: 306 (0.8%)
- European: 276 (0.7%)
- Canadian: 269 (0.7%)
- French Canadian: 260 (0.6%)
- Croatian: 252 (0.6%)
- Hungarian: 249 (0.6%)
- British: 246 (0.6%)
- Scottish: 235 (0.6%)
- Jamaican: 225 (0.6%)
- Greek: 215 (0.5%)
- Haitian: 151 (0.4%)
- Swedish: 145 (0.4%)
- Dutch: 140 (0.3%)
- Arab: 124 (0.3%)
- Iranian: 123 (0.3%)
- Ukrainian: 120 (0.3%)
- Romanian: 110 (0.3%)
- Norwegian: 98 (0.2%)
- Portuguese: 97 (0.2%)
- Brazilian: 96 (0.2%)
- Welsh: 93 (0.2%)
- Scotch-Irish: 89 (0.2%)
- Scandinavian: 87 (0.2%)
- Slavic: 74 (0.2%)
- Eastern European: 68 (0.2%)
- Northern European: 64 (0.2%)
- Swiss: 63 (0.2%)
- Guyanese: 62 (0.2%)
- British West Indian: 58 (0.1%)
- Serbian: 52 (0.1%)
- Pennsylvania German: 48 (0.1%)
- West Indian: 43 (0.1%)
- Czech: 42 (0.1%)
- Moroccan: 39 (0.10%)
- Lebanese: 39 (0.10%)
- Egyptian: 39 (0.10%)
- Danish: 37 (0.09%)
- Belizean: 35 (0.09%)
- Barbadian: 32 (0.08%)
- Lithuanian: 24 (0.06%)
- Albanian: 20 (0.05%)
- Slovene: 18 (0.04%)
- Nigerian: 18 (0.04%)
- Armenian: 13 (0.03%)
- Finnish: 10 (0.02%)
- Celtic: 10 (0.02%)
- Latvian: 10 (0.02%)
- Czechoslovakian: 8 (0.02%)
- Austrian: 8 (0.02%)
- Belgian: 8 (0.02%)
- Slovak: 6 (0.01%)
Most common places of birth for foreign-born residents (%):
| Daytona Beach: | 7.5% (537) |
| Florida: | 2.4% (109,132) |
| Daytona Beach: | 5.5% (395) |
| Florida: | 0.1% (4,597) |
| Daytona Beach: | 5.3% (380) |
| Florida: | 5.0% (227,319) |
| Daytona Beach: | 4.8% (347) |
| Florida: | 2.1% (94,349) |
| Daytona Beach: | 4.8% (345) |
| Florida: | 1.3% (60,604) |
| Daytona Beach: | 4.5% (324) |
| Florida: | 5.7% (262,042) |
| Daytona Beach: | 4.3% (311) |
| Florida: | 22.0% (1,006,576) |
| Daytona Beach: | 4.2% (298) |
| Florida: | 1.8% (84,403) |
| Daytona Beach: | 3.3% (238) |
| Florida: | 5.6% (257,152) |
| Daytona Beach: | 3.2% (231) |
| Florida: | 0.4% (19,445) |
| Daytona Beach: | 2.9% (209) |
| Florida: | 0.7% (31,076) |
| Daytona Beach: | 2.9% (209) |
| Florida: | 1.2% (54,272) |
| Daytona Beach: | 2.6% (183) |
| Florida: | 0.1% (3,756) |
| Daytona Beach: | 2.5% (182) |
| Florida: | 2.7% (122,906) |
| Daytona Beach: | 2.4% (172) |
| Florida: | 0.5% (21,886) |
| Daytona Beach: | 2.3% (165) |
| Florida: | 0.2% (9,122) |
| Daytona Beach: | 2.3% (164) |
| Florida: | 6.5% (298,669) |
| Daytona Beach: | 2.1% (153) |
| Florida: | 2.1% (96,693) |
| Daytona Beach: | 1.8% (129) |
| Florida: | 0.7% (34,227) |
| Daytona Beach: | 1.7% (123) |
| Florida: | 0.2% (11,000) |
| Daytona Beach: | 1.5% (111) |
| Florida: | 0.6% (25,219) |
| Daytona Beach: | 1.5% (109) |
| Florida: | 2.3% (105,066) |
Place of birth for U.S.-born residents:
- This state: 31,588
- Other state: 34,637
- Northeast: 12,575
- Midwest: 9,777
- South: 9,835
- West: 2,450
83.5% of Daytona Beach residents lived in the same house 1 years ago.
Out of people who lived in different houses, 35.6% lived in this county.
Out of people who lived in different counties, 38.4% lived in Florida.
| Daytona Beach: | 83.5% |
| State average: | 86.3% |
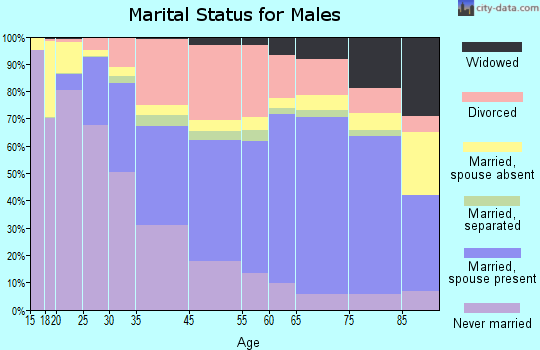
Education attainment for males 25 years and older:
- No schooling: 336
- Nursery to 4th grade: 0
- 5th and 6th grade: 0
- 7th and 8th grade: 405
- 9th grade: 359
- 10th grade: 453
- 11th grade: 322
- 12th grade, no diploma: 426
- High school graduate (or equivalency): 8,210
- Less than 1 year of college: 4,007
- Some college more than 1 year, no degree: 4,958
- Associate degree: 2,127
- Bachelor's degree: 3,195
- Master's degree: 1,887
- Professional school degree: 468
- Doctorate degree: 368

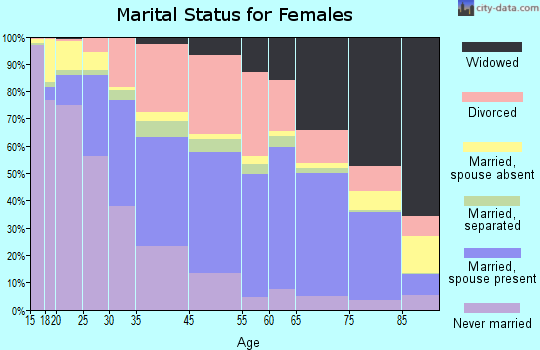
Education attainment for females 25 years and older:
- No schooling: 322
- Nursery to 4th grade: 0
- 5th and 6th grade: 124
- 7th and 8th grade: 131
- 9th grade: 244
- 10th grade: 354
- 11th grade: 547
- 12th grade, no diploma: 164
- High school graduate (or equivalency): 7,115
- Less than 1 year of college: 1,633
- Some college more than 1 year, no degree: 3,937
- Associate degree: 3,727
- Bachelor's degree: 6,016
- Master's degree: 2,263
- Professional school degree: 368
- Doctorate degree: 200

Housing units in structures:
- One, detached: 18,197
- One, attached: 3,678
- Two: 1,610
- 3 or 4: 2,307
- 5 to 9: 3,152
- 10 to 19: 4,003
- 20 to 49: 2,764
- 50 or more: 4,129
- Mobile homes: 1,577
Median worth of mobile homes: $24,815
Housing units lacking complete kitchen facilities in 2022: 4.2%
House/condo owner moved in on average 9 years ago
Renter moved in on average 2 years ago

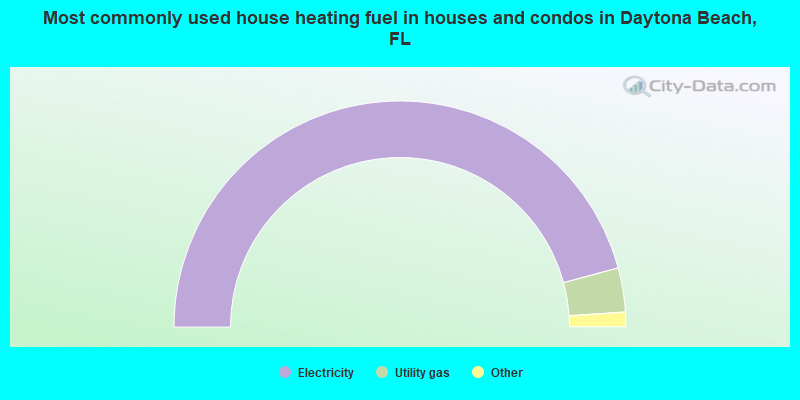
- 91.7%Electricity
- 6.3%Utility gas
- 0.7%Fuel oil, kerosene, etc.
- 0.6%Solar energy
- 0.4%No fuel used
- 0.3%Bottled, tank, or LP gas
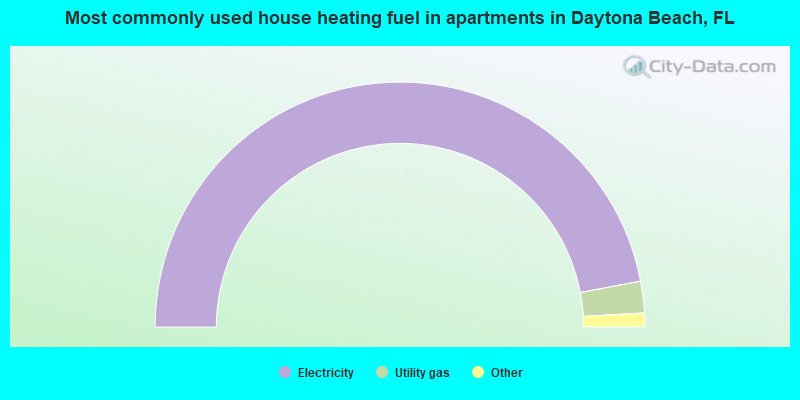
- 94.0%Electricity
- 4.2%Utility gas
- 1.2%No fuel used
- 0.5%Fuel oil, kerosene, etc.
Private vs. public school enrollment:
| Here: | 34.3% |
| Florida: | 15.8% |
| Here: | 16.3% |
| Florida: | 12.9% |
| Here: | 75.2% |
| Florida: | 23.6% |


