Dearborn Heights, MI (Michigan) Houses and Residents
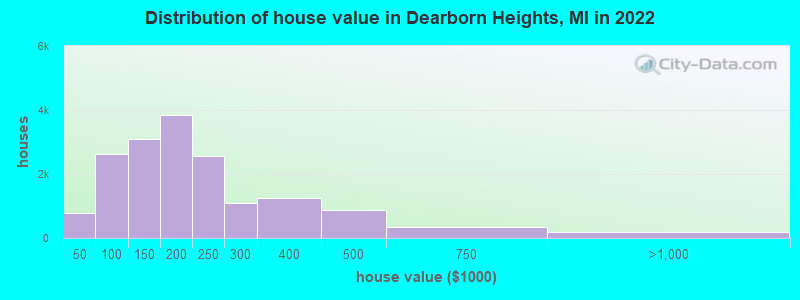
Estimated median house or condo value in 2022: $176,344 (it was $110,200 in 2000 )
Dearborn Heights:
$176,344Michigan:
$224,400
Lower value quartile - upper value quartile: $124,209 - $256,047Mean price in 2022: Detached houses: $219,753 Here:
$219,753State:
$280,038
Townhouses or other attached units: $170,417 Here:
$170,417State:
$239,520
In 2-unit structures: $182,622 Here:
$182,622State:
$219,481
In 3-to-4-unit structures: $65,030 Here:
$65,030State:
$207,067
In 5-or-more-unit structures: $145,736 Here:
$145,736State:
$192,733
Mobile homes: $53,729 Here:
$53,729State:
$72,868
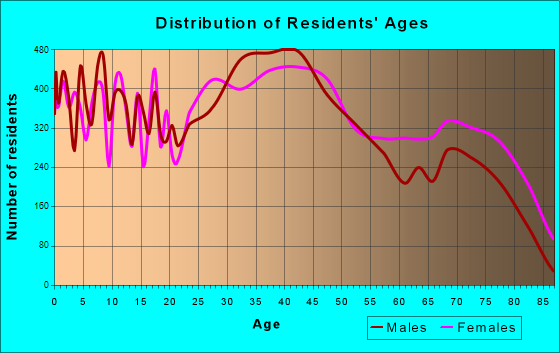
Total population: 56,415 (All urban)
Houses: 23,399 (22,036 occupied: 15,910 owner occupied, 6,253 renter occupied )
% of renters here:
28%State:
27%
Housing density: 1,997 houses/condos per square mile
Median price asked for vacant for-sale houses and condos in 2022: $170,674.
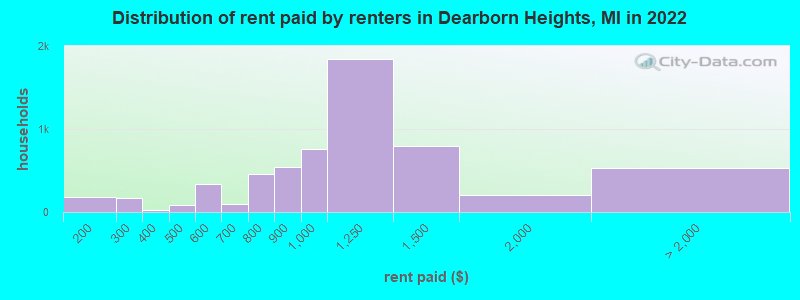
Median contract rent in 2022: $976 (lower quartile is $801, upper quartile is $1,243)
Median rent asked for vacant for-rent units in 2022: $1,293
Median gross rent in Dearborn Heights, MI in 2022: $1,209
Housing units in Dearborn Heights with a mortgage: 8,283 (757 second mortgage, 7 home equity loan, 648 both second mortgage and home equity loan )Houses without a mortgage: 322
Median household income for houses/condos with a mortgage: $75,865
Median household income for apartments without a mortgage: $54,010
Median monthly housing costs: $1,016
Data:
Median house or condo value ($)
Median house or condo value ($ change since 2000)
Median house or condo value ($) - White
Median house or condo value ($) - Black or African American
Median house or condo value ($) - Asian
Median house or condo value ($) - Hispanic or Latino
Median house or condo value ($) - American Indian and Alaska Native
Median house or condo value ($) - Multirace
Median house or condo value ($) - Other Race
Median price asked for mobile homes ($)
Household density (households per square mile)
Mean house or condo value by units in structure - 1, detached ($)
Mean house or condo value by units in structure - 1, attached ($)
Mean house or condo value by units in structure - 2 ($)
Mean house or condo value by units in structure by units in structure - 3 or 4 ($)
Mean house or condo value by units in structure - 5 or more ($)
Mean house or condo value by units in structure - Boat, RV, van, etc. ($)
Mean house or condo value by units in structure - Mobile home ($)
Median contract rent ($)
Median contract rent - Lower quartile ($)
Median contract rent - Upper quartile ($)
Median gross rent ($)
Urban houses (%)
Rural houses (%)
Houses occupied (%)
Houses occupied (% change since 2000)
Houses owner occupied (%)
Houses owner occupied (% change since 2000)
Houses renter occupied (%)
Houses renter occupied (% change since 2000)
Vacant housing units - For rent (%)
Vacant housing units - For rent (% change since 2000)
Vacant housing units - For sale only (%)
Vacant housing units - For sale only (% change since 2000)
Vacant housing units - Rented or sold, not occupied (%)
Vacant housing units - Rented or sold, not occupied (% change since 2000)
Vacant housing units - For seasonal, recreational, or occasional use (%)
Vacant housing units - For seasonal, recreational, or occasional use (% change since 2000)
Vacant housing units - For migrant workers (%)
Vacant housing units - For migrant workers (% change since 2000)
Vacant housing units - Other vacant (%)
Vacant housing units - Other vacant (% change since 2000)
Median monthly housing costs ($)
Median household income for houses/condos with a mortgage ($)
Median household income for houses/condos without a mortgage ($)
Median household income ($)
Median household income ($) - White
Median household income ($) - Black or African American
Median household income ($) - Asian
Median household income ($) - Hispanic or Latino
Median household income ($) - American Indian and Alaska Native
Median household income ($) - Multirace
Median household income ($) - Other Race
Mortgage status - with mortgage (%)
Mortgage status - with second mortgage (%)
Mortgage status - with home equity loan (%)
Mortgage status - with both second mortgage and home equity loan (%)
Mortgage status - without a mortgage (%)
Median year house/condo built
Median year apartment built
Household type by relationship - Male householder living alone (%)
Household type by relationship - Male householder not living alone (%)
Household type by relationship - Female householder living alone (%)
Household type by relationship - Female householder not living alone (%)
Household type by relationship - Opposite-Sex spouse (%)
Household type by relationship - Same-Sex spouse (%)
Household type by relationship - Opposite-Sex unmarried partner (%)
Household type by relationship - Same-Sex unmarried partner (%)
Household type by relationship - In group quarters (%)
Size of family households - 2-person household (%)
Size of family households - 3-person household (%)
Size of family households - 4-person household (%)
Size of family households - 5-person household (%)
Size of family households - 6-person household (%)
Size of family households - 7-or-more-person household (%)
Size of nonfamily households - 1-person household (%)
Size of nonfamily households - 2-person household (%)
Size of nonfamily households - 3-person household (%)
Size of nonfamily households - 4-person household (%)
Size of nonfamily households - 5-person household (%)
Size of nonfamily households - 6-person household (%)
Size of nonfamily households - 7-or-moreperson household (%)
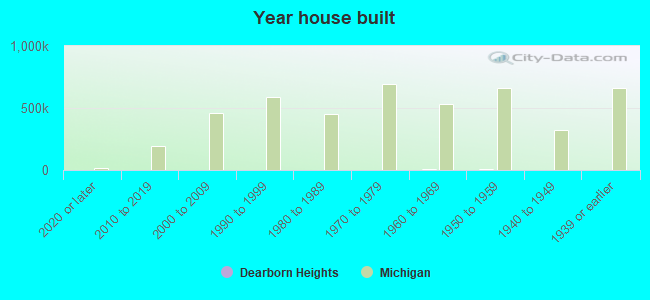
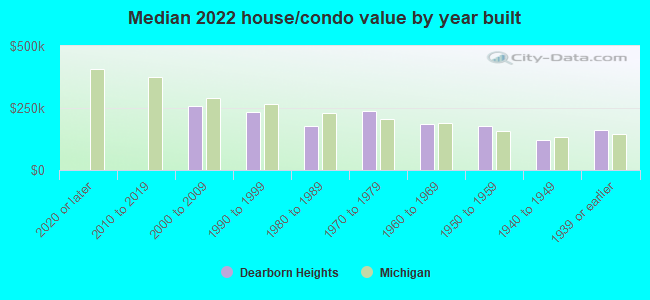
Year house built - Built 2010 or later (%)
Year house built - Built 2000 to 2009 (%)
Year house built - Built 1990 to 1999 (%)
Year house built - Built 1980 to 1989 (%)
Year house built - Built 1970 to 1979 (%)
Year house built - Built 1960 to 1969 (%)
Year house built - Built 1950 to 1959 (%)
Year house built - Built 1940 to 1949 (%)
Year house built - Built 1939 or earlier (%)
Median number of rooms in houses and condos
Median number of rooms in apartments
Median number of bedrooms in owner occupied houses
Mean number of bedrooms in owner occupied houses
Median number of bedrooms in renter occupied houses
Mean number of bedrooms in renter occupied houses
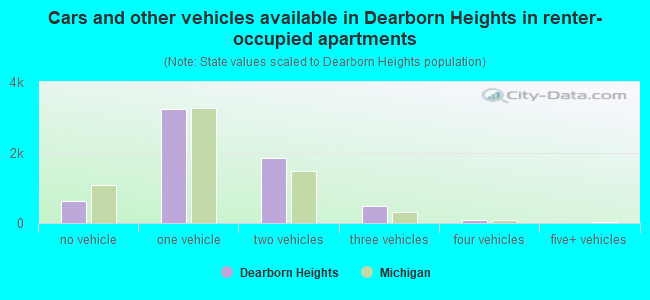
Median number of vehichles in owner occupied houses
Mean number of vehichles in owner occupied houses
Median number of vehichles in renter occupied houses
Mean number of vehichles in renter occupied houses
Rooms in owner-occupied houses - 1 room (%)
Rooms in owner-occupied houses - 2 rooms (%)
Rooms in owner-occupied houses - 3 rooms (%)
Rooms in owner-occupied houses - 4 rooms (%)
Rooms in owner-occupied houses - 5 rooms (%)
Rooms in owner-occupied houses - 6 rooms (%)
Rooms in owner-occupied houses - 7 rooms (%)
Rooms in owner-occupied houses - 8 rooms (%)
Rooms in owner-occupied houses - 9+ rooms (%)
Rooms in renter-occupied houses - 1 room (%)
Rooms in renter-occupied houses - 2 rooms (%)
Rooms in renter-occupied houses - 3 rooms (%)
Rooms in renter-occupied houses - 4 rooms (%)
Rooms in renter-occupied houses - 5 rooms (%)
Rooms in renter-occupied houses - 6 rooms (%)
Rooms in renter-occupied houses - 7 rooms (%)
Rooms in renter-occupied houses - 8 rooms (%)
Rooms in renter-occupied houses - 9+ rooms (%)
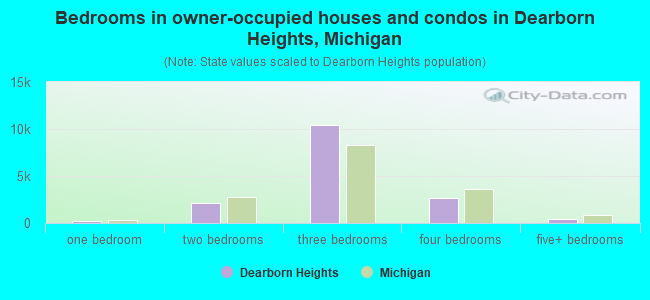
Bedrooms in owner-occupied houses - no bedrooms (%)
Bedrooms in owner-occupied houses - 1 bedroom (%)
Bedrooms in owner-occupied houses - 2 bedrooms (%)
Bedrooms in owner-occupied houses - 3 bedrooms (%)
Bedrooms in owner-occupied houses - 4 bedrooms (%)
Bedrooms in owner-occupied houses - 5+ bedrooms (%)
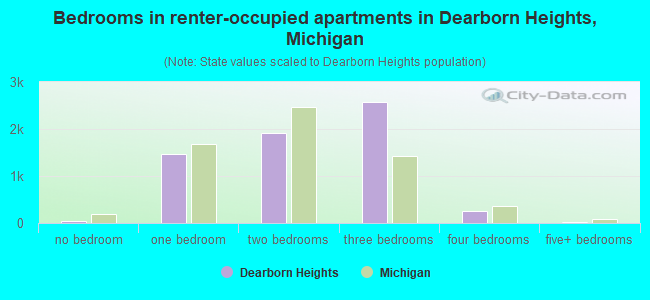
Bedrooms in renter-occupied houses - no bedrooms (%)
Bedrooms in renter-occupied houses - 1 bedroom (%)
Bedrooms in renter-occupied houses - 2 bedrooms (%)
Bedrooms in renter-occupied houses - 3 bedrooms (%)
Bedrooms in renter-occupied houses - 4 bedrooms (%)
Bedrooms in renter-occupied houses - 5+ bedrooms (%)
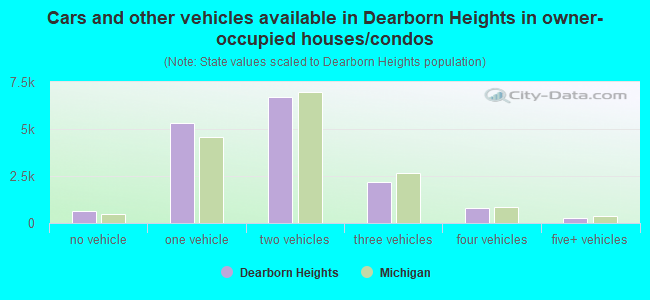
Vehicles available in owner-occupied houses - no vehicle available (%)
Vehicles available in owner-occupied houses - 1 vehicle available(%)
Vehicles available in owner-occupied houses - 2 Vehicles available (%)
Vehicles available in owner-occupied houses - 3 Vehicles available (%)
Vehicles available in owner-occupied houses - 4 Vehicles available (%)
Vehicles available in owner-occupied houses - 5+ Vehicles available (%)
Vehicles available in renter-occupied houses - no vehicle available (%)
Vehicles available in renter-occupied houses - 1 vehicle available (%)
Vehicles available in renter-occupied houses - 2 Vehicles available (%)
Vehicles available in renter-occupied houses - 3 Vehicles available (%)
Vehicles available in renter-occupied houses - 4 Vehicles available (%)
Vehicles available in renter-occupied houses - 5+ Vehicles available (%)
Housing units in structures - 1, detached (%)
Housing units in structures - 1, attached (%)
Housing units in structures - 2 (%)
Housing units in structures - 3 or 4 (%)
Housing units in structures - 5 to 9 (%)
Housing units in structures - 10 to 19 (%)
Housing units in structures - 20 to 49 (%)
Housing units in structures - 50 or more (%)
Housing units in structures - Mobile home (%)
Housing units in structures - Boat, RV, van, etc. (%)
Housing units in structures - Owners - 1, detached (%)
Housing units in structures - Owners - 1, attached (%)
Housing units in structures - Owners - 2 (%)
Housing units in structures - Owners - 3 or 4 (%)
Housing units in structures - Owners - 5 to 9 (%)
Housing units in structures - Owners - 10 to 19 (%)
Housing units in structures - Owners - 20 to 49 (%)
Housing units in structures - Owners - 50 or more (%)
Housing units in structures - Owners - Mobile home (%)
Housing units in structures - Owners - Boat, RV, van, etc. (%)
Housing units in structures - Renters - 1, detached (%)
Housing units in structures - Renters - 1, attached (%)
Housing units in structures - Renters - 2 (%)
Housing units in structures - Renters - 3 or 4 (%)
Housing units in structures - Renters - 5 to 9 (%)
Housing units in structures - Renters - 10 to 19 (%)
Housing units in structures - Renters - 20 to 49 (%)
Housing units in structures - Renters - 50 or more (%)
Housing units in structures - Renters - Mobile home (%)
Housing units in structures - Renters - Boat, RV, van, etc. (%)
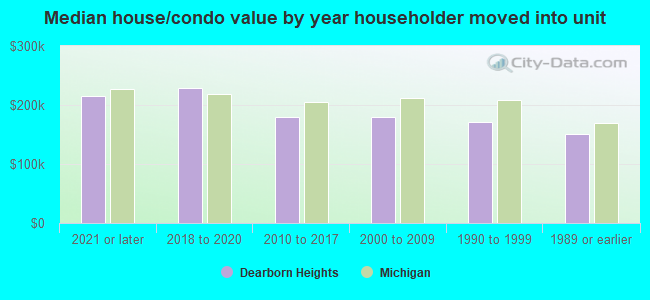
House/condo owner moved in on average (years ago)
Renter moved in on average (years ago)
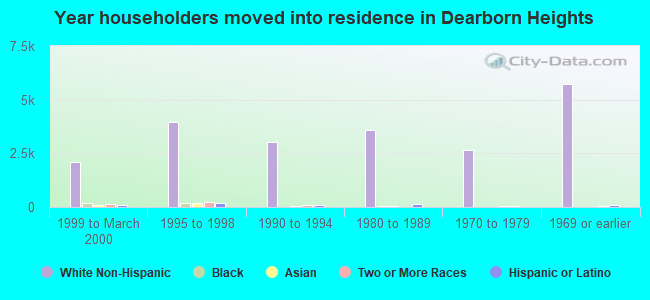
Year householder moved into unit - Moved in 1999 to March 2000 (%)
Year householder moved into unit - Moved in 1999 to March 2000 (%) - White
Year householder moved into unit - Moved in 1999 to March 2000 (%) - Black or African American
Year householder moved into unit - Moved in 1999 to March 2000 (%) - Asian
Year householder moved into unit - Moved in 1999 to March 2000 (%) - Hispanic or Latino
Year householder moved into unit - Moved in 1999 to March 2000 (%) - American Indian and Alaska Native
Year householder moved into unit - Moved in 1999 to March 2000 (%) - Multirace
Year householder moved into unit - Moved in 1999 to March 2000 (%) - Other Race
Year householder moved into unit - Moved in 1995 to 1998 (%)
Year householder moved into unit - Moved in 1995 to 1998 (%) - White
Year householder moved into unit - Moved in 1995 to 1998 (%) - Black or African American
Year householder moved into unit - Moved in 1995 to 1998 (%) - Asian
Year householder moved into unit - Moved in 1995 to 1998 (%) - Hispanic or Latino
Year householder moved into unit - Moved in 1995 to 1998 (%) - American Indian and Alaska Native
Year householder moved into unit - Moved in 1995 to 1998 (%) - Multirace
Year householder moved into unit - Moved in 1995 to 1998 (%) - Other Race
Year householder moved into unit - Moved in 1990 to 1994 (%)
Year householder moved into unit - Moved in 1990 to 1994 (%) - White
Year householder moved into unit - Moved in 1990 to 1994 (%) - Black or African American
Year householder moved into unit - Moved in 1990 to 1994 (%) - Asian
Year householder moved into unit - Moved in 1990 to 1994 (%) - Hispanic or Latino
Year householder moved into unit - Moved in 1990 to 1994 (%) - American Indian and Alaska Native
Year householder moved into unit - Moved in 1990 to 1994 (%) - Multirace
Year householder moved into unit - Moved in 1990 to 1994 (%) - Other Race
Year householder moved into unit - Moved in 1980 to 1989 (%)
Year householder moved into unit - Moved in 1980 to 1989 (%) - White
Year householder moved into unit - Moved in 1980 to 1989 (%) - Black or African American
Year householder moved into unit - Moved in 1980 to 1989 (%) - Asian
Year householder moved into unit - Moved in 1980 to 1989 (%) - Hispanic or Latino
Year householder moved into unit - Moved in 1980 to 1989 (%) - American Indian and Alaska Native
Year householder moved into unit - Moved in 1980 to 1989 (%) - Multirace
Year householder moved into unit - Moved in 1980 to 1989 (%) - Other Race
Year householder moved into unit - Moved in 1970 to 1979 (%)
Year householder moved into unit - Moved in 1970 to 1979 (%) - White
Year householder moved into unit - Moved in 1970 to 1979 (%) - Black or African American
Year householder moved into unit - Moved in 1970 to 1979 (%) - Asian
Year householder moved into unit - Moved in 1970 to 1979 (%) - Hispanic or Latino
Year householder moved into unit - Moved in 1970 to 1979 (%) - American Indian and Alaska Native
Year householder moved into unit - Moved in 1970 to 1979 (%) - Multirace
Year householder moved into unit - Moved in 1970 to 1979 (%) - Other Race
Year householder moved into unit - Moved in 1969 or earlier (%)
Year householder moved into unit - Moved in 1969 or earlier (%) - White
Year householder moved into unit - Moved in 1969 or earlier (%) - Black or African American
Year householder moved into unit - Moved in 1969 or earlier (%) - Asian
Year householder moved into unit - Moved in 1969 or earlier (%) - Hispanic or Latino
Year householder moved into unit - Moved in 1969 or earlier (%) - American Indian and Alaska Native
Year householder moved into unit - Moved in 1969 or earlier (%) - Multirace
Year householder moved into unit - Moved in 1969 or earlier (%) - Other Race
Housing units lacking complete plumbing facilities (%)
Housing units lacking complete kitchen facilities (%)
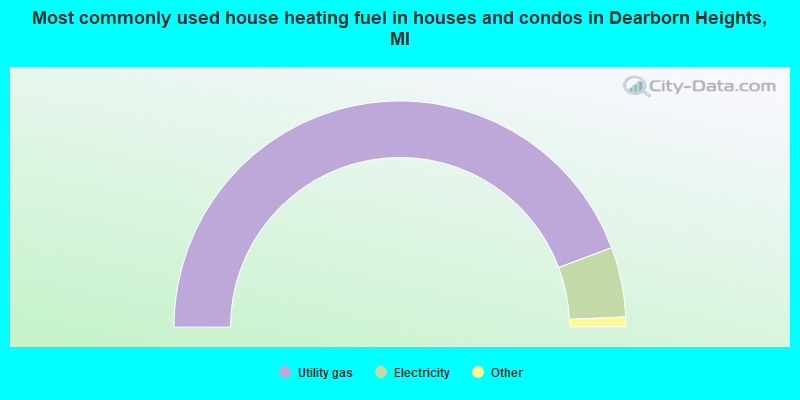
House heating fuel used in houses and condos - Utility gas (%)
House heating fuel used in houses and condos - Bottled, tank, or LP gas (%)
House heating fuel used in houses and condos - Electricity (%)
House heating fuel used in houses and condos - Fuel oil, kerosene, etc. (%)
House heating fuel used in houses and condos - Coal or coke (%)
House heating fuel used in houses and condos - Wood (%)
House heating fuel used in houses and condos - Solar energy (%)
House heating fuel used in houses and condos - Other fuel (%)
House heating fuel used in houses and condos - No fuel used (%)
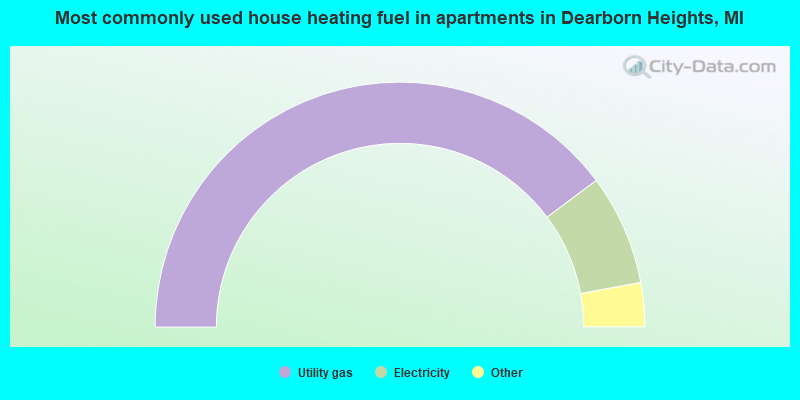
House heating fuel used in apartments - Utility gas (%)
House heating fuel used in apartments - Bottled, tank, or LP gas (%)
House heating fuel used in apartments - Electricity (%)
House heating fuel used in apartments - Fuel oil, kerosene, etc. (%)
House heating fuel used in apartments - Coal or coke (%)
House heating fuel used in apartments - Wood (%)
House heating fuel used in apartments - Solar energy (%)
House heating fuel used in apartments - Other fuel (%)
House heating fuel used in apartments - No fuel used (%)
Median year house/condo built: 1958Median year apartment built: 1961Household type by relationship:
Households: 61,611
Male householders: 11,849 (3,004 living alone ), Female householders: 9,916 (3,208 living alone )10,889 spouses (10,826 opposite-sex spouses ), 1,016 unmarried partners , (1,003 opposite-sex unmarried partners ), 21,926 children (21,297 natural , 187 adopted , 440 stepchildren ), 1,099 grandchildren , 1,156 brothers or sisters , 1,188 parents , 155 foster children , 790 other relatives , 1,116 non-relatives In group quarters: 505
Size of family households: 5,908 2-persons , 3,210 3-persons , 2,895 4-persons , 1,837 5-persons , 922 6-persons , 289 7-or-more-persons .
Size of nonfamily households: 6,437 1-person , 608 2-persons , 5 3-persons , 33 5-persons , 28 7-or-more-persons .
11,514 married couples with children. single-parent households (612 men , 2,102 women ).
60.0% of residents of Dearborn Heights speak English at home. of residents speak Spanish at home (50% speak English very well , 25% speak English well , 23% speak English not well , 2% don't speak English at all ).of residents speak other Indo-European language at home (62% speak English very well , 29% speak English well , 8% speak English not well , 2% don't speak English at all ).of residents speak Asian or Pacific Island language at home (80% speak English very well , 19% speak English well , 1% speak English not well ).of residents speak other language at home (56% speak English very well , 24% speak English well , 15% speak English not well , 5% don't speak English at all ).
Foreign born population: 14,529 (23.6%)of them are naturalized citizens )
Median number of rooms in houses and condos:
Median number of rooms in apartments
Owner-occupied Renter-occupied
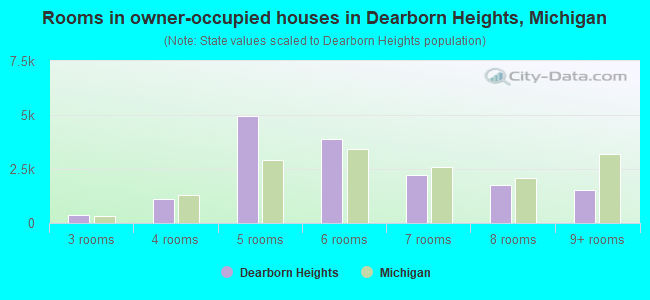
Rooms in owner-occupied houses in Dearborn Heights, Michigan
15 1 room 41 2 rooms 363 3 rooms 1,105 4 rooms 4,967 5 rooms 3,891 6 rooms 2,233 7 rooms 1,773 8 rooms 1,522 9+ rooms
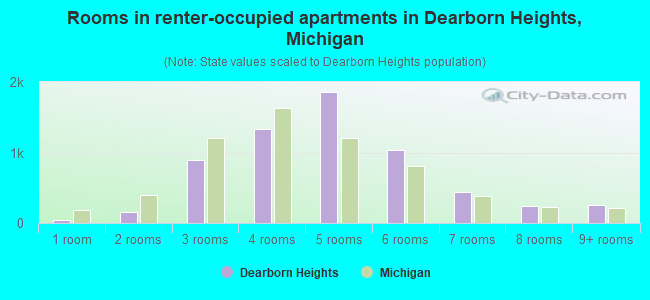
Rooms in renter-occupied apartments in Dearborn Heights, Michigan
45 1 room 152 2 rooms 887 3 rooms 1,334 4 rooms 1,862 5 rooms 1,032 6 rooms 446 7 rooms 247 8 rooms 249 9+ rooms
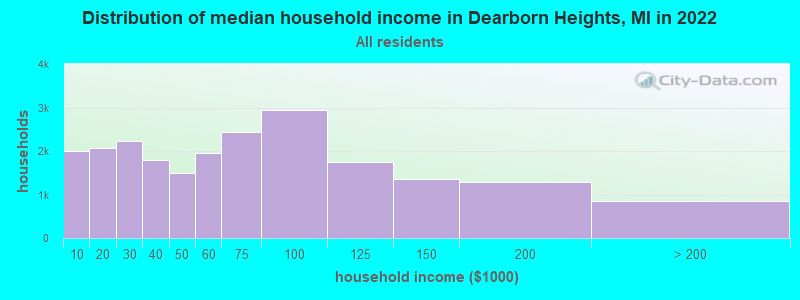
Dearborn Heights, MI household income distribution 2,003 Less than $10,0002,066 $10,000 to $19,9992,232 $20,000 to $29,9991,792 $30,000 to $39,9991,488 $40,000 to $49,9991,955 $50,000 to $59,9992,437 $60,000 to $74,9992,950 $75,000 to $99,9991,740 $100,000 to $124,9991,355 $125,000 to $149,9991,291 $150,000 to $199,999845 $200,000 or more
Home value of owner - occupied houses in 2022 in Dearborn Heights, MI 205 Less than $10,000112 $10,000 to $14,999202 $15,000 to $19,99915 $20,000 to $24,99925 $25,000 to $29,99945 $30,000 to $34,99915 $35,000 to $39,999153 $40,000 to $49,999225 $50,000 to $59,999228 $60,000 to $69,999557 $70,000 to $79,999843 $80,000 to $89,999621 $90,000 to $99,9991,721 $100,000 to $124,9991,387 $125,000 to $149,9992,475 $150,000 to $174,9991,365 $175,000 to $199,9992,576 $200,000 to $249,9991,103 $250,000 to $299,9991,252 $300,000 to $399,999889 $400,000 to $499,999346 $500,000 to $749,999155 $750,000 to $999,99934 $1,000,000 to $1,499,99910 $1,500,000 to $1,999,999Rent paid by renters in 2022 in Dearborn Heights, MI 176 $150 to $19928 $200 to $249140 $250 to $29926 $300 to $3493 $350 to $39949 $400 to $44936 $450 to $499138 $500 to $549198 $550 to $59955 $600 to $64939 $650 to $699203 $700 to $749254 $750 to $799545 $800 to $899761 $900 to $9991,848 $1,000 to $1,249800 $1,250 to $1,499208 $1,500 to $1,99914 $2,500 to $2,999519 No cash rent
Percentage of workers working in this county: 85.6%Number of people working at home: 2,936 (12.1% of all workers )
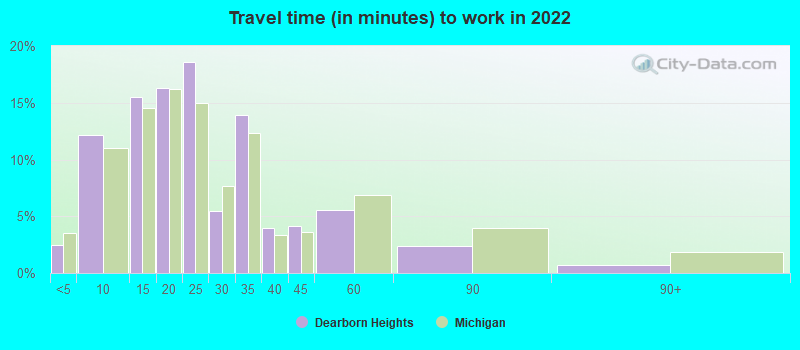
Travel time to work (commute)
Less than 5 minutes: 3055 to 9 minutes: 1,36510 to 14 minutes: 2,60715 to 19 minutes: 3,69820 to 24 minutes: 5,02525 to 29 minutes: 2,08730 to 34 minutes: 3,03135 to 39 minutes: 60740 to 44 minutes: 72445 to 59 minutes: 99860 to 89 minutes: 36490 or more minutes: 424
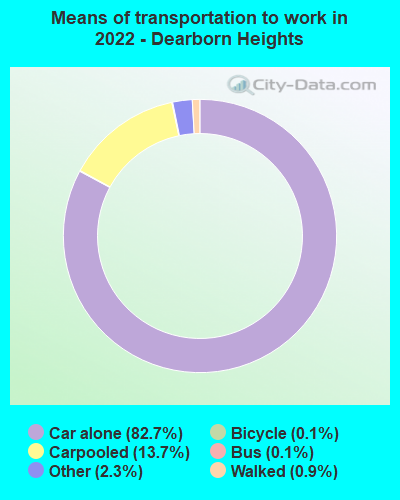
Means of transportation to work:
Drove a car alone: 7,418 (64.6%)Carpooled: 1,217 (10.6%)Bus : 11 (0.1%)Taxi: 227 (2.0%)Bicycle: 12 (0.1%)Walked: 90 (0.8%)Worked at home: 2,936 (25.6%)
Unemployment by race in 2022
Unemployment rate for White non-Hispanic residents 5.6% Males4.4% FemalesUnemployment rate for Black residents 24.7% Males6.4% FemalesUnemployment rate for Asian residents 21.3% FemalesUnemployment rate for other race residents 8.2% MalesUnemployment rate for two or more race residents 23.0% MalesUnemployment rate for Hispanic or Latino residents 18.6% Males1.0% Females
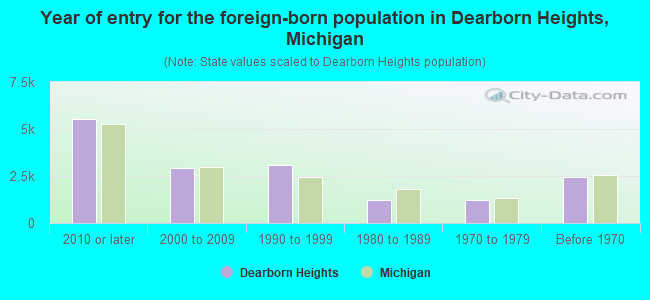
Year of entry for the foreign-born population in Dearborn Heights, Michigan
5,510 2010 or later 2,914 2000 to 2009 3,111 1990 to 1999 1,208 1980 to 1989 1,237 1970 to 1979 2,426 Before 1970
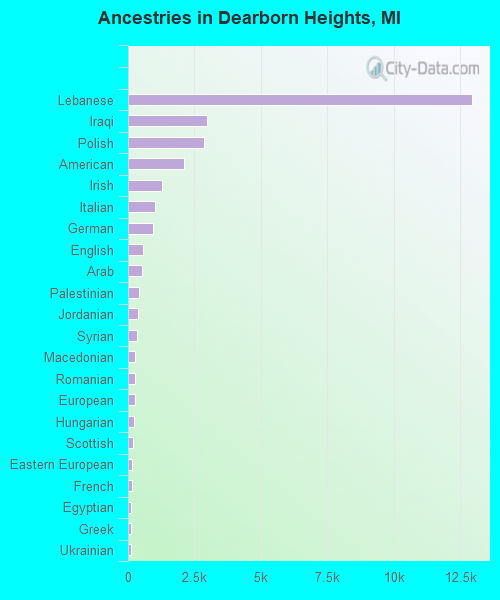
First ancestries reported:
Lebanese: 12,934 (35.9%)
Iraqi: 2,968 (8.2%)
Polish: 2,856 (7.9%)
American: 2,110 (5.9%)
Irish: 1,269 (3.5%)
Italian: 1,006 (2.8%)
German: 952 (2.6%)
English: 547 (1.5%)
Arab: 537 (1.5%)
Palestinian: 418 (1.2%)
Jordanian: 375 (1.0%)
Syrian: 351 (1.0%)
Macedonian: 276 (0.8%)
Romanian: 275 (0.8%)
European: 249 (0.7%)
Hungarian: 229 (0.6%)
Scottish: 171 (0.5%)
Eastern European: 146 (0.4%)
French: 132 (0.4%)
Egyptian: 127 (0.4%)
Greek: 120 (0.3%)
Ukrainian: 119 (0.3%)
Scotch-Irish: 115 (0.3%)
Lithuanian: 115 (0.3%)
Albanian: 109 (0.3%)
African: 108 (0.3%)
Yugoslavian: 105 (0.3%)
Bulgarian: 91 (0.3%)
Finnish: 88 (0.2%)
Moroccan: 79 (0.2%)
Armenian: 76 (0.2%)
French Canadian: 68 (0.2%)
Iranian: 61 (0.2%)
Maltese: 50 (0.1%)
Canadian: 34 (0.09%)
Assyrian: 33 (0.09%)
Russian: 32 (0.09%)
Sierra Leonean: 31 (0.09%)
Serbian: 29 (0.08%)
Dutch: 27 (0.07%)
Slovene: 24 (0.07%)
Nigerian: 24 (0.07%)
Czech: 23 (0.06%)
Slovak: 21 (0.06%)
Norwegian: 18 (0.05%)
West Indian: 18 (0.05%)
Liberian: 18 (0.05%)
Scandinavian: 17 (0.05%)
British: 14 (0.04%)
Austrian: 12 (0.03%)
Ethiopian: 6 (0.02%)
Belgian: 3 (0.01%)
Most common places of birth for foreign-born residents (%): Lebanon Dearborn Heights:
46.5% (6,591)Michigan:
3.7% (25,634)
Iraq Dearborn Heights:
17.2% (2,434)Michigan:
8.1% (55,954)
Mexico Dearborn Heights:
2.6% (369)Michigan:
10.9% (75,965)
Other Northern Africa Dearborn Heights:
2.2% (318)Michigan:
0.2% (1,499)
Jordan Dearborn Heights:
2.1% (297)Michigan:
0.7% (4,939)
Canada Dearborn Heights:
2.0% (289)Michigan:
5.0% (35,052)
Yemen Dearborn Heights:
1.8% (250)Michigan:
3.1% (21,538)
India Dearborn Heights:
1.5% (219)Michigan:
11.1% (77,240)
North Macedonia (Macedonia) Dearborn Heights:
1.5% (218)Michigan:
0.6% (3,931)
Place of birth for U.S.-born residents:
This state: 42,349Other state: 4,149Northeast: 757Midwest: 1,174South: 1,518West: 714 89.0% of Dearborn Heights residents lived in the same house 1 years ago.
Out of people who lived in different houses, 46.1% lived in this county.
Out of people who lived in different counties, 39.6% lived in Michigan.
Dearborn Heights:
89.0%State average:
88.4%
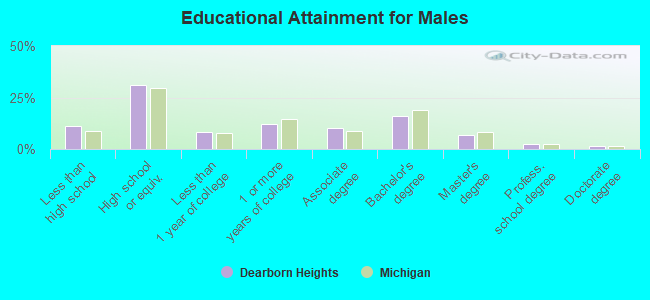
Education attainment for males 25 years and older:
No schooling: 402Nursery to 4th grade: 755th and 6th grade: 1517th and 8th grade: 1879th grade: 33910th grade: 17011th grade: 28912th grade, no diploma: 650High school graduate (or equivalency): 6,245Less than 1 year of college: 1,679Some college more than 1 year, no degree: 2,472Associate degree: 2,025Bachelor's degree: 3,181Master's degree: 1,405Professional school degree: 462Doctorate degree: 293
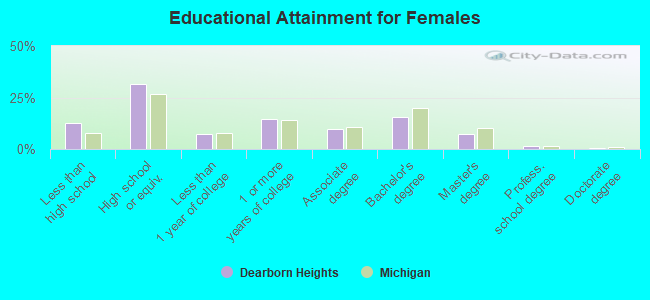
Education attainment for females 25 years and older:
No schooling: 481Nursery to 4th grade: 1065th and 6th grade: 2267th and 8th grade: 2049th grade: 27910th grade: 32911th grade: 33512th grade, no diploma: 714High school graduate (or equivalency): 6,744Less than 1 year of college: 1,546Some college more than 1 year, no degree: 3,129Associate degree: 2,021Bachelor's degree: 3,268Master's degree: 1,540Professional school degree: 288Doctorate degree: 66
Housing units in structures:
One, detached: 20,145One, attached: 424Two: 313 or 4: 9415 to 9: 69710 to 19: 14220 to 49: 14050 or more: 556Mobile homes: 311Boats, RVs, vans, etc.: 6Median worth of mobile homes: $16,446
Housing units lacking complete plumbing facilities in 2022: 0.5%Housing units lacking complete kitchen facilities in 2022: 1.5%House/condo owner moved in on average 15 years ago
Renter moved in on average 3 years ago
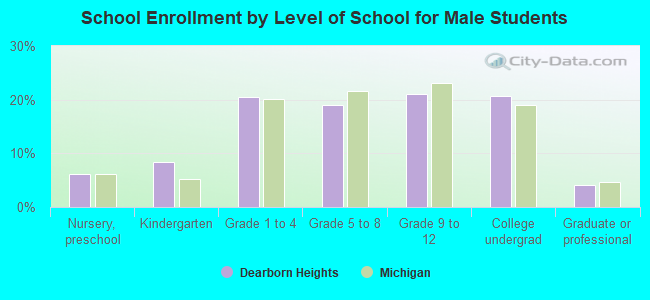
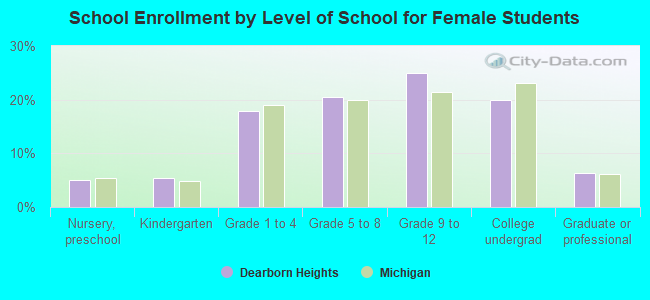
Private vs. public school enrollment:
Students in private schools in grades 1 to 8 (elementary and middle school): 846 Students in private schools in grades 9 to 12 (high school): 322 Students in private undergraduate colleges: 524