Durham, NC (North Carolina) Houses and Residents
Estimated median house or condo value in 2022: $385,900 (it was $125,600 in 2000 )
Durham:
$385,900North Carolina:
$280,600
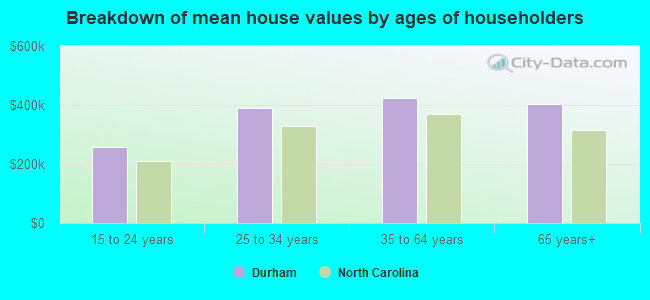
Lower value quartile - upper value quartile: $277,300 - $535,100Mean price in 2022: Detached houses: $434,688 Here:
$434,688State:
$375,326
Townhouses or other attached units: $280,986 Here:
$280,986State:
$317,935
In 2-unit structures: $361,089 Here:
$361,089State:
$250,488
In 3-to-4-unit structures: $378,526 Here:
$378,526State:
$254,939
In 5-or-more-unit structures: $354,970 Here:
$354,970State:
$329,290
Mobile homes: $104,983 Here:
$104,983State:
$124,933
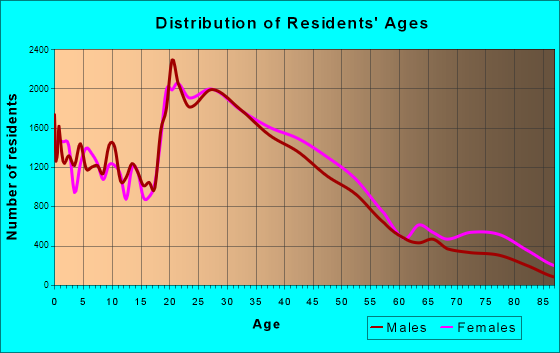
Total population: 251,893 (Urban population: 185,157, Rural population: 2,026 (all nonfarm) )
Houses: 134,423 (124,536 occupied: 64,503 owner occupied, 60,033 renter occupied )
% of renters here:
48%State:
33%
Housing density: 1,420 houses/condos per square mile
Median price asked for vacant for-sale houses and condos in 2022: $506,679.
Median contract rent in 2022: $1,246 (lower quartile is $962, upper quartile is $1,577)
Median rent asked for vacant for-rent units in 2022: $1,517
Median gross rent in Durham, NC in 2022: $1,383
Housing units in Durham with a mortgage: 48,257 (5,020 second mortgage, 81 home equity loan, 3,727 both second mortgage and home equity loan )Houses without a mortgage: 808
Median household income for houses/condos with a mortgage: $111,705
Median household income for apartments without a mortgage: $84,029
Median monthly housing costs: $1,365
Data:
Median house or condo value ($)
Median house or condo value ($ change since 2000)
Median house or condo value ($) - White
Median house or condo value ($) - Black or African American
Median house or condo value ($) - Asian
Median house or condo value ($) - Hispanic or Latino
Median house or condo value ($) - American Indian and Alaska Native
Median house or condo value ($) - Multirace
Median house or condo value ($) - Other Race
Median price asked for mobile homes ($)
Household density (households per square mile)
Mean house or condo value by units in structure - 1, detached ($)
Mean house or condo value by units in structure - 1, attached ($)
Mean house or condo value by units in structure - 2 ($)
Mean house or condo value by units in structure by units in structure - 3 or 4 ($)
Mean house or condo value by units in structure - 5 or more ($)
Mean house or condo value by units in structure - Boat, RV, van, etc. ($)
Mean house or condo value by units in structure - Mobile home ($)
Median contract rent ($)
Median contract rent - Lower quartile ($)
Median contract rent - Upper quartile ($)
Median gross rent ($)
Urban houses (%)
Rural houses (%)
Houses occupied (%)
Houses occupied (% change since 2000)
Houses owner occupied (%)
Houses owner occupied (% change since 2000)
Houses renter occupied (%)
Houses renter occupied (% change since 2000)
Vacant housing units - For rent (%)
Vacant housing units - For rent (% change since 2000)
Vacant housing units - For sale only (%)
Vacant housing units - For sale only (% change since 2000)
Vacant housing units - Rented or sold, not occupied (%)
Vacant housing units - Rented or sold, not occupied (% change since 2000)
Vacant housing units - For seasonal, recreational, or occasional use (%)
Vacant housing units - For seasonal, recreational, or occasional use (% change since 2000)
Vacant housing units - For migrant workers (%)
Vacant housing units - For migrant workers (% change since 2000)
Vacant housing units - Other vacant (%)
Vacant housing units - Other vacant (% change since 2000)
Median monthly housing costs ($)
Median household income for houses/condos with a mortgage ($)
Median household income for houses/condos without a mortgage ($)
Median household income ($)
Median household income ($) - White
Median household income ($) - Black or African American
Median household income ($) - Asian
Median household income ($) - Hispanic or Latino
Median household income ($) - American Indian and Alaska Native
Median household income ($) - Multirace
Median household income ($) - Other Race
Mortgage status - with mortgage (%)
Mortgage status - with second mortgage (%)
Mortgage status - with home equity loan (%)
Mortgage status - with both second mortgage and home equity loan (%)
Mortgage status - without a mortgage (%)
Median year house/condo built
Median year apartment built
Household type by relationship - Male householder living alone (%)
Household type by relationship - Male householder not living alone (%)
Household type by relationship - Female householder living alone (%)
Household type by relationship - Female householder not living alone (%)
Household type by relationship - Opposite-Sex spouse (%)
Household type by relationship - Same-Sex spouse (%)
Household type by relationship - Opposite-Sex unmarried partner (%)
Household type by relationship - Same-Sex unmarried partner (%)
Household type by relationship - In group quarters (%)
Size of family households - 2-person household (%)
Size of family households - 3-person household (%)
Size of family households - 4-person household (%)
Size of family households - 5-person household (%)
Size of family households - 6-person household (%)
Size of family households - 7-or-more-person household (%)
Size of nonfamily households - 1-person household (%)
Size of nonfamily households - 2-person household (%)
Size of nonfamily households - 3-person household (%)
Size of nonfamily households - 4-person household (%)
Size of nonfamily households - 5-person household (%)
Size of nonfamily households - 6-person household (%)
Size of nonfamily households - 7-or-moreperson household (%)
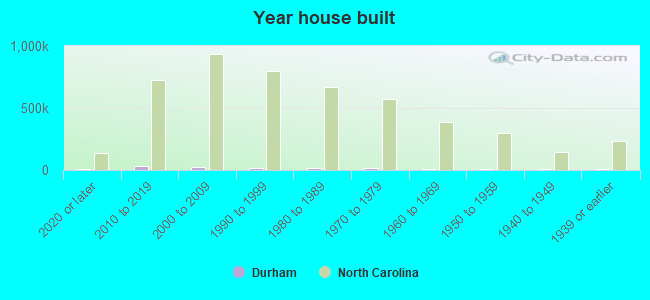
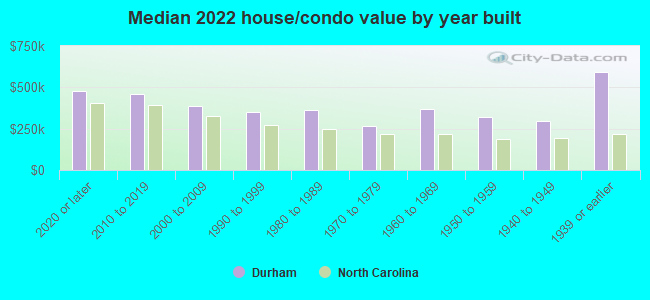
Year house built - Built 2010 or later (%)
Year house built - Built 2000 to 2009 (%)
Year house built - Built 1990 to 1999 (%)
Year house built - Built 1980 to 1989 (%)
Year house built - Built 1970 to 1979 (%)
Year house built - Built 1960 to 1969 (%)
Year house built - Built 1950 to 1959 (%)
Year house built - Built 1940 to 1949 (%)
Year house built - Built 1939 or earlier (%)
Median number of rooms in houses and condos
Median number of rooms in apartments
Median number of bedrooms in owner occupied houses
Mean number of bedrooms in owner occupied houses
Median number of bedrooms in renter occupied houses
Mean number of bedrooms in renter occupied houses
Median number of vehichles in owner occupied houses
Mean number of vehichles in owner occupied houses
Median number of vehichles in renter occupied houses
Mean number of vehichles in renter occupied houses
Rooms in owner-occupied houses - 1 room (%)
Rooms in owner-occupied houses - 2 rooms (%)
Rooms in owner-occupied houses - 3 rooms (%)
Rooms in owner-occupied houses - 4 rooms (%)
Rooms in owner-occupied houses - 5 rooms (%)
Rooms in owner-occupied houses - 6 rooms (%)
Rooms in owner-occupied houses - 7 rooms (%)
Rooms in owner-occupied houses - 8 rooms (%)
Rooms in owner-occupied houses - 9+ rooms (%)
Rooms in renter-occupied houses - 1 room (%)
Rooms in renter-occupied houses - 2 rooms (%)
Rooms in renter-occupied houses - 3 rooms (%)
Rooms in renter-occupied houses - 4 rooms (%)
Rooms in renter-occupied houses - 5 rooms (%)
Rooms in renter-occupied houses - 6 rooms (%)
Rooms in renter-occupied houses - 7 rooms (%)
Rooms in renter-occupied houses - 8 rooms (%)
Rooms in renter-occupied houses - 9+ rooms (%)
Bedrooms in owner-occupied houses - no bedrooms (%)
Bedrooms in owner-occupied houses - 1 bedroom (%)
Bedrooms in owner-occupied houses - 2 bedrooms (%)
Bedrooms in owner-occupied houses - 3 bedrooms (%)
Bedrooms in owner-occupied houses - 4 bedrooms (%)
Bedrooms in owner-occupied houses - 5+ bedrooms (%)
Bedrooms in renter-occupied houses - no bedrooms (%)
Bedrooms in renter-occupied houses - 1 bedroom (%)
Bedrooms in renter-occupied houses - 2 bedrooms (%)
Bedrooms in renter-occupied houses - 3 bedrooms (%)
Bedrooms in renter-occupied houses - 4 bedrooms (%)
Bedrooms in renter-occupied houses - 5+ bedrooms (%)
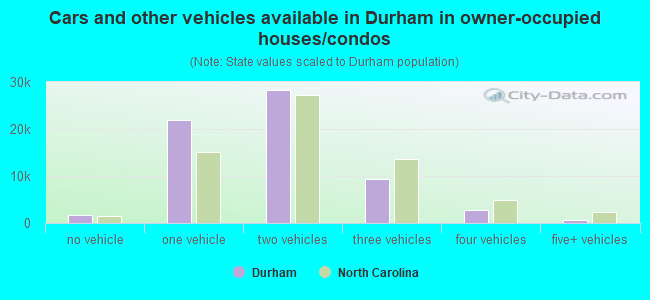
Vehicles available in owner-occupied houses - no vehicle available (%)
Vehicles available in owner-occupied houses - 1 vehicle available(%)
Vehicles available in owner-occupied houses - 2 Vehicles available (%)
Vehicles available in owner-occupied houses - 3 Vehicles available (%)
Vehicles available in owner-occupied houses - 4 Vehicles available (%)
Vehicles available in owner-occupied houses - 5+ Vehicles available (%)
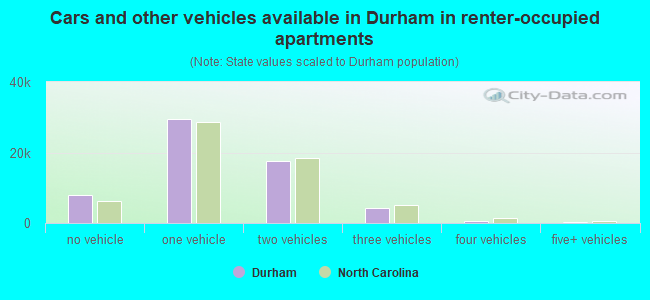
Vehicles available in renter-occupied houses - no vehicle available (%)
Vehicles available in renter-occupied houses - 1 vehicle available (%)
Vehicles available in renter-occupied houses - 2 Vehicles available (%)
Vehicles available in renter-occupied houses - 3 Vehicles available (%)
Vehicles available in renter-occupied houses - 4 Vehicles available (%)
Vehicles available in renter-occupied houses - 5+ Vehicles available (%)
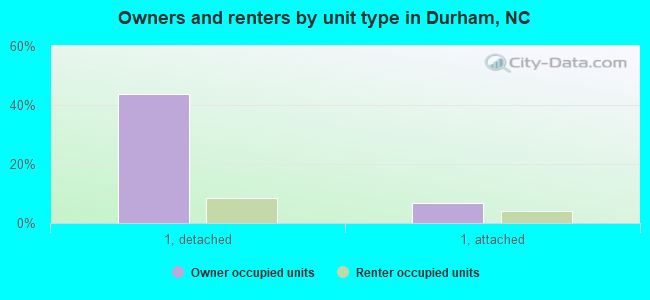
Housing units in structures - 1, detached (%)
Housing units in structures - 1, attached (%)
Housing units in structures - 2 (%)
Housing units in structures - 3 or 4 (%)
Housing units in structures - 5 to 9 (%)
Housing units in structures - 10 to 19 (%)
Housing units in structures - 20 to 49 (%)
Housing units in structures - 50 or more (%)
Housing units in structures - Mobile home (%)
Housing units in structures - Boat, RV, van, etc. (%)
Housing units in structures - Owners - 1, detached (%)
Housing units in structures - Owners - 1, attached (%)
Housing units in structures - Owners - 2 (%)
Housing units in structures - Owners - 3 or 4 (%)
Housing units in structures - Owners - 5 to 9 (%)
Housing units in structures - Owners - 10 to 19 (%)
Housing units in structures - Owners - 20 to 49 (%)
Housing units in structures - Owners - 50 or more (%)
Housing units in structures - Owners - Mobile home (%)
Housing units in structures - Owners - Boat, RV, van, etc. (%)
Housing units in structures - Renters - 1, detached (%)
Housing units in structures - Renters - 1, attached (%)
Housing units in structures - Renters - 2 (%)
Housing units in structures - Renters - 3 or 4 (%)
Housing units in structures - Renters - 5 to 9 (%)
Housing units in structures - Renters - 10 to 19 (%)
Housing units in structures - Renters - 20 to 49 (%)
Housing units in structures - Renters - 50 or more (%)
Housing units in structures - Renters - Mobile home (%)
Housing units in structures - Renters - Boat, RV, van, etc. (%)
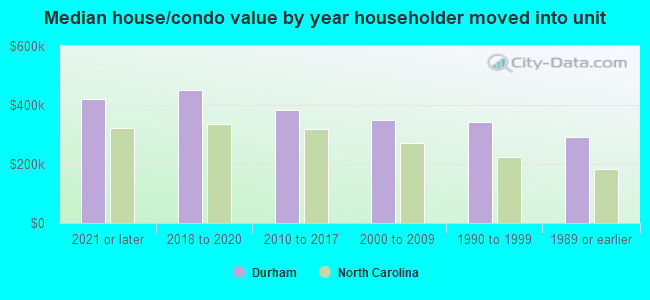
House/condo owner moved in on average (years ago)
Renter moved in on average (years ago)
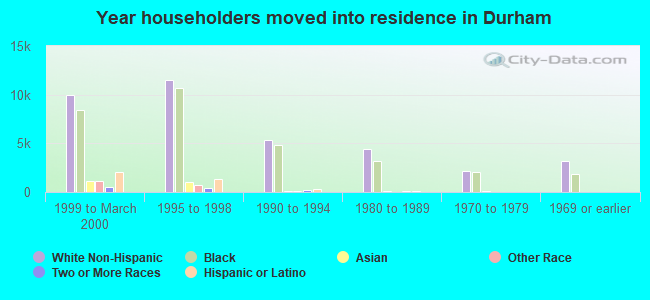
Year householder moved into unit - Moved in 1999 to March 2000 (%)
Year householder moved into unit - Moved in 1999 to March 2000 (%) - White
Year householder moved into unit - Moved in 1999 to March 2000 (%) - Black or African American
Year householder moved into unit - Moved in 1999 to March 2000 (%) - Asian
Year householder moved into unit - Moved in 1999 to March 2000 (%) - Hispanic or Latino
Year householder moved into unit - Moved in 1999 to March 2000 (%) - American Indian and Alaska Native
Year householder moved into unit - Moved in 1999 to March 2000 (%) - Multirace
Year householder moved into unit - Moved in 1999 to March 2000 (%) - Other Race
Year householder moved into unit - Moved in 1995 to 1998 (%)
Year householder moved into unit - Moved in 1995 to 1998 (%) - White
Year householder moved into unit - Moved in 1995 to 1998 (%) - Black or African American
Year householder moved into unit - Moved in 1995 to 1998 (%) - Asian
Year householder moved into unit - Moved in 1995 to 1998 (%) - Hispanic or Latino
Year householder moved into unit - Moved in 1995 to 1998 (%) - American Indian and Alaska Native
Year householder moved into unit - Moved in 1995 to 1998 (%) - Multirace
Year householder moved into unit - Moved in 1995 to 1998 (%) - Other Race
Year householder moved into unit - Moved in 1990 to 1994 (%)
Year householder moved into unit - Moved in 1990 to 1994 (%) - White
Year householder moved into unit - Moved in 1990 to 1994 (%) - Black or African American
Year householder moved into unit - Moved in 1990 to 1994 (%) - Asian
Year householder moved into unit - Moved in 1990 to 1994 (%) - Hispanic or Latino
Year householder moved into unit - Moved in 1990 to 1994 (%) - American Indian and Alaska Native
Year householder moved into unit - Moved in 1990 to 1994 (%) - Multirace
Year householder moved into unit - Moved in 1990 to 1994 (%) - Other Race
Year householder moved into unit - Moved in 1980 to 1989 (%)
Year householder moved into unit - Moved in 1980 to 1989 (%) - White
Year householder moved into unit - Moved in 1980 to 1989 (%) - Black or African American
Year householder moved into unit - Moved in 1980 to 1989 (%) - Asian
Year householder moved into unit - Moved in 1980 to 1989 (%) - Hispanic or Latino
Year householder moved into unit - Moved in 1980 to 1989 (%) - American Indian and Alaska Native
Year householder moved into unit - Moved in 1980 to 1989 (%) - Multirace
Year householder moved into unit - Moved in 1980 to 1989 (%) - Other Race
Year householder moved into unit - Moved in 1970 to 1979 (%)
Year householder moved into unit - Moved in 1970 to 1979 (%) - White
Year householder moved into unit - Moved in 1970 to 1979 (%) - Black or African American
Year householder moved into unit - Moved in 1970 to 1979 (%) - Asian
Year householder moved into unit - Moved in 1970 to 1979 (%) - Hispanic or Latino
Year householder moved into unit - Moved in 1970 to 1979 (%) - American Indian and Alaska Native
Year householder moved into unit - Moved in 1970 to 1979 (%) - Multirace
Year householder moved into unit - Moved in 1970 to 1979 (%) - Other Race
Year householder moved into unit - Moved in 1969 or earlier (%)
Year householder moved into unit - Moved in 1969 or earlier (%) - White
Year householder moved into unit - Moved in 1969 or earlier (%) - Black or African American
Year householder moved into unit - Moved in 1969 or earlier (%) - Asian
Year householder moved into unit - Moved in 1969 or earlier (%) - Hispanic or Latino
Year householder moved into unit - Moved in 1969 or earlier (%) - American Indian and Alaska Native
Year householder moved into unit - Moved in 1969 or earlier (%) - Multirace
Year householder moved into unit - Moved in 1969 or earlier (%) - Other Race
Housing units lacking complete plumbing facilities (%)
Housing units lacking complete kitchen facilities (%)
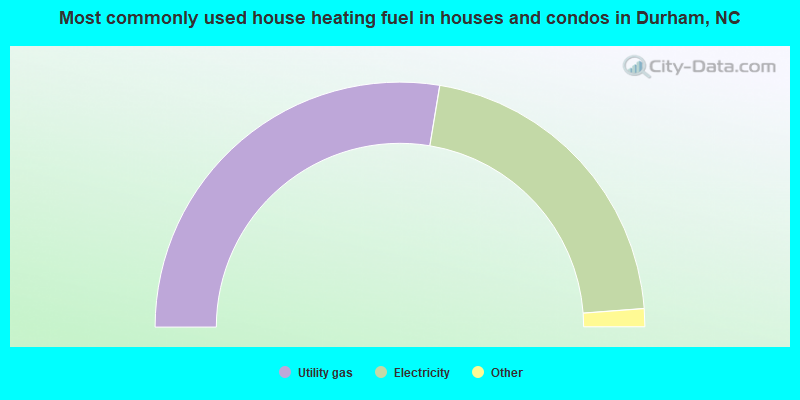
House heating fuel used in houses and condos - Utility gas (%)
House heating fuel used in houses and condos - Bottled, tank, or LP gas (%)
House heating fuel used in houses and condos - Electricity (%)
House heating fuel used in houses and condos - Fuel oil, kerosene, etc. (%)
House heating fuel used in houses and condos - Coal or coke (%)
House heating fuel used in houses and condos - Wood (%)
House heating fuel used in houses and condos - Solar energy (%)
House heating fuel used in houses and condos - Other fuel (%)
House heating fuel used in houses and condos - No fuel used (%)
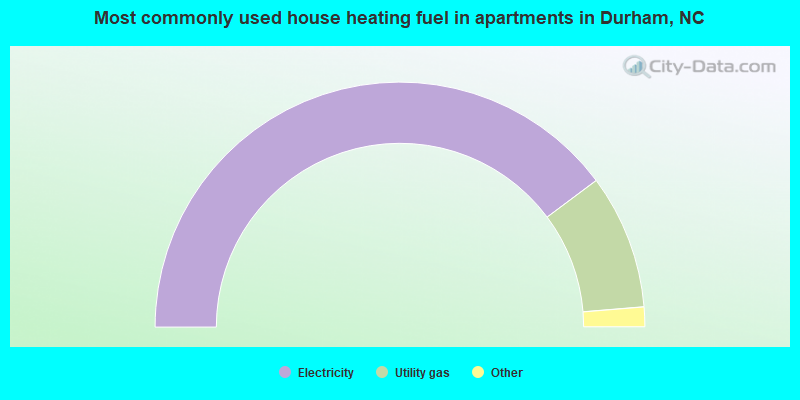
House heating fuel used in apartments - Utility gas (%)
House heating fuel used in apartments - Bottled, tank, or LP gas (%)
House heating fuel used in apartments - Electricity (%)
House heating fuel used in apartments - Fuel oil, kerosene, etc. (%)
House heating fuel used in apartments - Coal or coke (%)
House heating fuel used in apartments - Wood (%)
House heating fuel used in apartments - Solar energy (%)
House heating fuel used in apartments - Other fuel (%)
House heating fuel used in apartments - No fuel used (%)
Latest news about housing in Durham, NC collected exclusively by city-data.com from local newspapers, TV, and radio stations
Median year house/condo built: 1995Median year apartment built: 1997Household type by relationship:
Households: 291,844
Male householders: 52,941 (17,651 living alone ), Female householders: 71,595 (26,406 living alone )45,446 spouses (44,468 opposite-sex spouses ), 9,939 unmarried partners , (9,376 opposite-sex unmarried partners ), 72,694 children (69,198 natural , 2,082 adopted , 1,414 stepchildren ), 5,312 grandchildren , 2,789 brothers or sisters , 3,614 parents , 54 foster children , 4,671 other relatives , 12,420 non-relatives In group quarters: 10,369
Size of family households: 32,952 2-persons , 16,061 3-persons , 11,463 4-persons , 4,239 5-persons , 1,610 6-persons , 841 7-or-more-persons .
Size of nonfamily households: 44,057 1-person , 11,006 2-persons , 1,876 3-persons , 347 4-persons , 84 5-persons .
32,509 married couples with children. single-parent households (3,492 men , 15,262 women ).
80.5% of residents of Durham speak English at home. of residents speak Spanish at home (52% speak English very well , 10% speak English well , 13% speak English not well , 25% don't speak English at all ).of residents speak other Indo-European language at home (86% speak English very well , 8% speak English well , 4% speak English not well , 1% don't speak English at all ).of residents speak Asian or Pacific Island language at home (66% speak English very well , 19% speak English well , 6% speak English not well , 10% don't speak English at all ).of residents speak other language at home (72% speak English very well , 17% speak English well , 5% speak English not well , 5% don't speak English at all ).
Foreign born population: 43,200 (14.8%)of them are naturalized citizens )
Median number of rooms in houses and condos:
Median number of rooms in apartments
Owner-occupied Renter-occupied
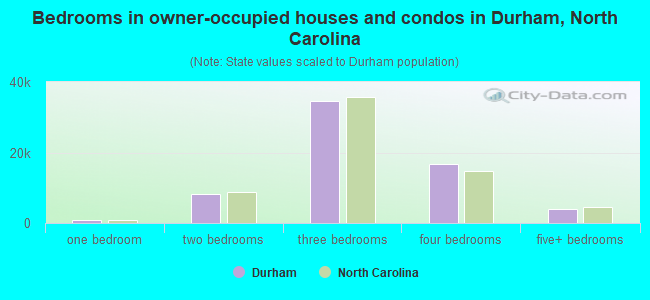
Bedrooms in owner-occupied houses and condos in Durham, North Carolina
0 no bedroom 822 1 bedroom 8,336 2 bedrooms 34,506 3 bedrooms 16,875 4 bedrooms 3,964 5+ bedrooms
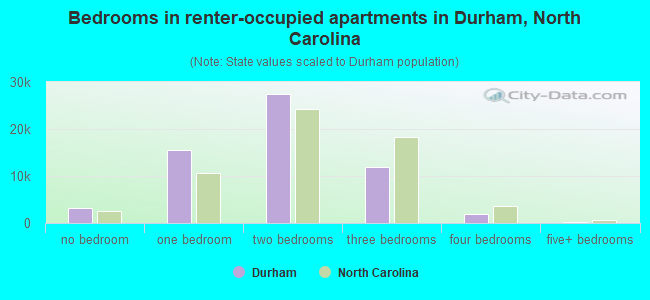
Bedrooms in renter-occupied apartments in Durham, North Carolina
3,116 no bedroom 15,439 1 bedroom 27,414 2 bedrooms 11,985 3 bedrooms 1,824 4 bedrooms 255 5+ bedrooms
Owner-occupied Renter-occupied
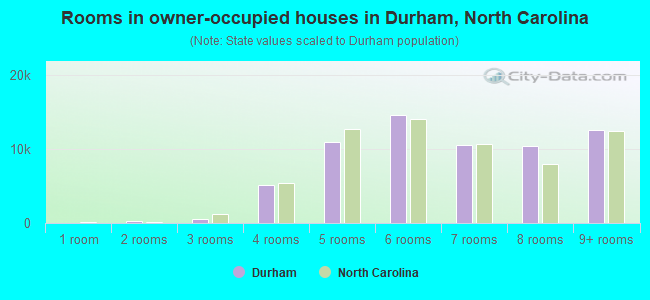
Rooms in owner-occupied houses in Durham, North Carolina
0 1 room 230 2 rooms 495 3 rooms 5,069 4 rooms 10,919 5 rooms 14,548 6 rooms 10,458 7 rooms 10,313 8 rooms 12,471 9+ rooms
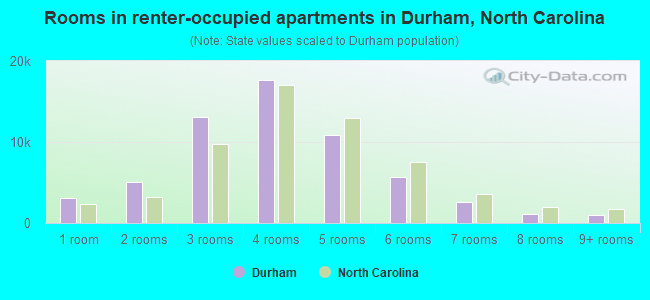
Rooms in renter-occupied apartments in Durham, North Carolina
3,116 1 room 5,076 2 rooms 13,064 3 rooms 17,629 4 rooms 10,811 5 rooms 5,657 6 rooms 2,575 7 rooms 1,062 8 rooms 1,043 9+ rooms
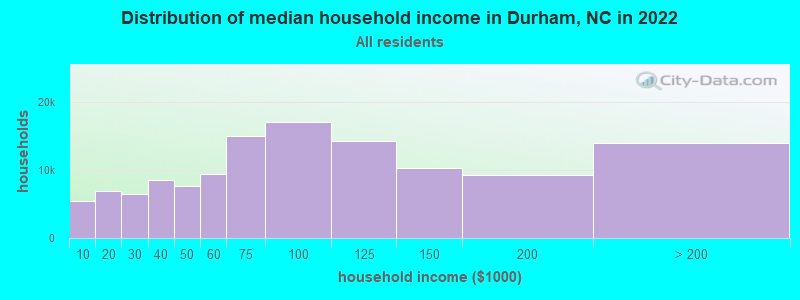
Durham, NC household income distribution 5,404 Less than $10,0006,933 $10,000 to $19,9996,453 $20,000 to $29,9998,613 $30,000 to $39,9997,656 $40,000 to $49,9999,502 $50,000 to $59,99915,074 $60,000 to $74,99917,094 $75,000 to $99,99914,234 $100,000 to $124,99910,312 $125,000 to $149,9999,325 $150,000 to $199,99913,936 $200,000 or more
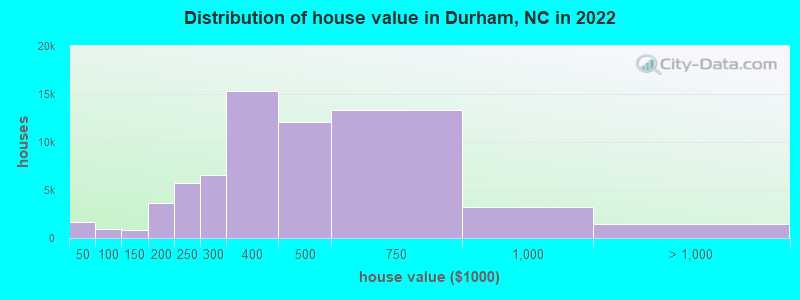
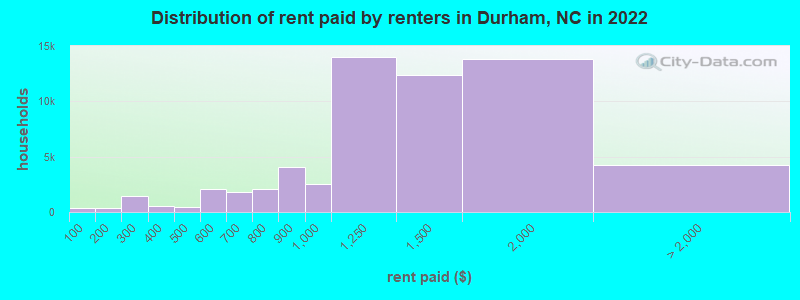
Home value of owner - occupied houses in 2022 in Durham, NC 938 Less than $10,000170 $10,000 to $14,999215 $15,000 to $19,99986 $20,000 to $24,999302 $40,000 to $49,999114 $50,000 to $59,999495 $80,000 to $89,99947 $90,000 to $99,999355 $100,000 to $124,999472 $125,000 to $149,9992,013 $150,000 to $174,9991,618 $175,000 to $199,9995,728 $200,000 to $249,9996,544 $250,000 to $299,99915,319 $300,000 to $399,99912,085 $400,000 to $499,99913,348 $500,000 to $749,9993,232 $750,000 to $999,9991,145 $1,000,000 to $1,499,99996 $1,500,000 to $1,999,999181 $2,000,000 or moreRent paid by renters in 2022 in Durham, NC 341 Less than $100376 $150 to $199780 $200 to $249679 $250 to $299133 $300 to $349389 $350 to $399461 $400 to $449709 $500 to $5491,381 $550 to $5991,204 $600 to $649564 $650 to $6991,149 $700 to $749913 $750 to $7994,071 $800 to $8992,507 $900 to $99913,969 $1,000 to $1,24912,364 $1,250 to $1,49913,793 $1,500 to $1,9991,990 $2,000 to $2,499668 $2,500 to $2,999179 $3,000 to $3,499195 $3,500 or more1,218 No cash rent
Percentage of workers working in this county: 77.0%Number of people working at home: 36,328 (22.5% of all workers )
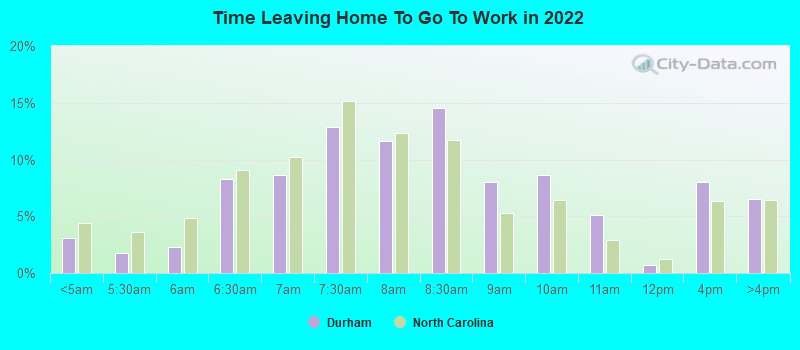
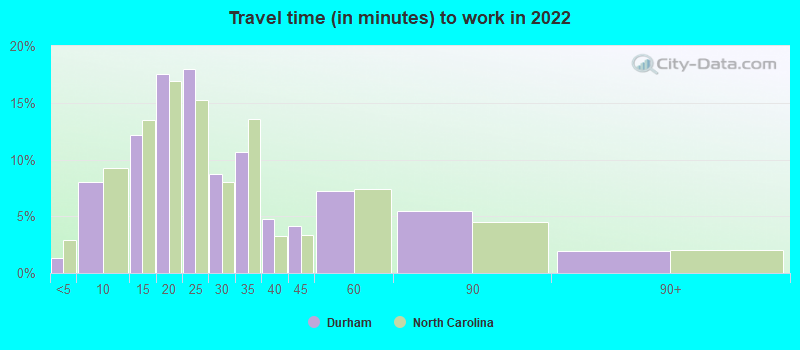
Travel time to work (commute)
Less than 5 minutes: 2,2075 to 9 minutes: 13,43210 to 14 minutes: 20,21215 to 19 minutes: 23,72820 to 24 minutes: 26,19025 to 29 minutes: 8,23830 to 34 minutes: 13,31635 to 39 minutes: 2,77040 to 44 minutes: 3,38445 to 59 minutes: 4,37460 to 89 minutes: 4,17490 or more minutes: 3,287
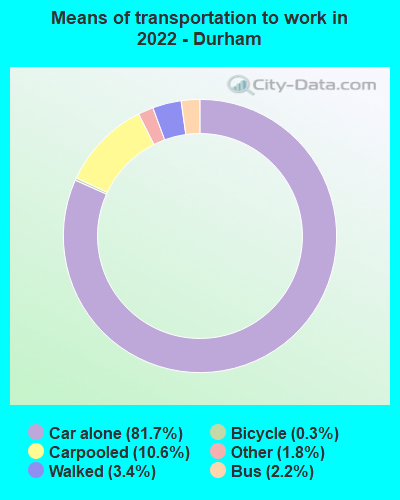
Means of transportation to work:
Drove a car alone: 128,606 (66.4%)Carpooled: 16,627 (8.6%)Bus : 3,418 (1.8%)Taxi: 2,799 (1.4%)Bicycle: 525 (0.3%)Walked: 5,388 (2.8%)Worked at home: 36,328 (18.8%)
Unemployment by race in 2022
Unemployment rate for White non-Hispanic residents 2.1% Males2.4% FemalesUnemployment rate for Black residents 4.8% Males2.7% FemalesUnemployment rate for Asian residents 8.6% Males1.3% FemalesUnemployment rate for other race residents 1.3% Males1.9% FemalesUnemployment rate for two or more race residents 3.5% Males2.2% FemalesUnemployment rate for Hispanic or Latino residents 1.5% Males2.5% Females
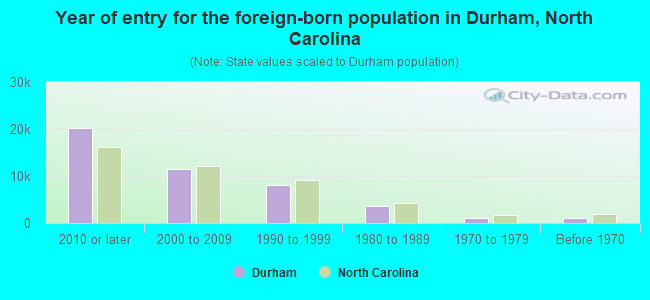
Year of entry for the foreign-born population in Durham, North Carolina
20,153 2010 or later 11,533 2000 to 2009 8,025 1990 to 1999 3,626 1980 to 1989 1,161 1970 to 1979 991 Before 1970
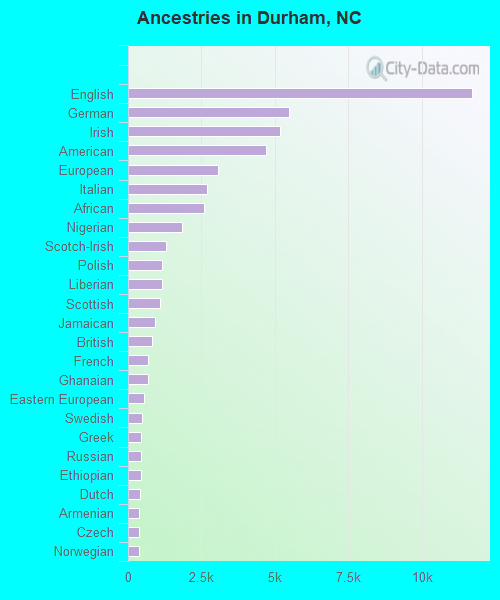
First ancestries reported:
English: 11,704 (6.8%)
German: 5,477 (3.2%)
Irish: 5,158 (3.0%)
American: 4,684 (2.7%)
European: 3,077 (1.8%)
Italian: 2,702 (1.6%)
African: 2,577 (1.5%)
Nigerian: 1,827 (1.1%)
Scotch-Irish: 1,281 (0.7%)
Polish: 1,157 (0.7%)
Liberian: 1,153 (0.7%)
Scottish: 1,088 (0.6%)
Jamaican: 908 (0.5%)
British: 822 (0.5%)
French: 672 (0.4%)
Ghanaian: 670 (0.4%)
Eastern European: 552 (0.3%)
Swedish: 467 (0.3%)
Greek: 441 (0.3%)
Russian: 429 (0.2%)
Ethiopian: 426 (0.2%)
Dutch: 397 (0.2%)
Armenian: 383 (0.2%)
Czech: 372 (0.2%)
Norwegian: 358 (0.2%)
Kenyan: 310 (0.2%)
Arab: 262 (0.2%)
Moroccan: 234 (0.1%)
West Indian: 231 (0.1%)
Welsh: 231 (0.1%)
Lithuanian: 190 (0.1%)
Belizean: 185 (0.1%)
Northern European: 172 (0.1%)
New Zealander: 167 (0.10%)
Ukrainian: 156 (0.09%)
Sierra Leonean: 155 (0.09%)
Lebanese: 139 (0.08%)
Iranian: 138 (0.08%)
Canadian: 132 (0.08%)
Afghan: 131 (0.08%)
Egyptian: 126 (0.07%)
Portuguese: 125 (0.07%)
Hungarian: 123 (0.07%)
French Canadian: 105 (0.06%)
Finnish: 103 (0.06%)
Romanian: 100 (0.06%)
Bahamian: 100 (0.06%)
Palestinian: 98 (0.06%)
Brazilian: 96 (0.06%)
Trinidadian and Tobagonian: 86 (0.05%)
Haitian: 86 (0.05%)
British West Indian: 84 (0.05%)
Scandinavian: 80 (0.05%)
Sudanese: 80 (0.05%)
Israeli: 80 (0.05%)
Swiss: 66 (0.04%)
Danish: 60 (0.03%)
South African: 57 (0.03%)
German Russian: 56 (0.03%)
Slovak: 54 (0.03%)
Latvian: 49 (0.03%)
Albanian: 49 (0.03%)
Slovene: 48 (0.03%)
Belgian: 44 (0.03%)
Austrian: 43 (0.03%)
Icelander: 43 (0.03%)
Australian: 41 (0.02%)
Turkish: 39 (0.02%)
Croatian: 37 (0.02%)
Slavic: 35 (0.02%)
Cajun: 35 (0.02%)
Syrian: 31 (0.02%)
Barbadian: 30 (0.02%)
U.S. Virgin Islander: 28 (0.02%)
Guyanese: 27 (0.02%)
Maltese: 24 (0.01%)
Celtic: 24 (0.01%)
Bulgarian: 22 (0.01%)
Ugandan: 17 (0.01%)
Serbian: 16 (0.01%)
Assyrian: 16 (0.01%)
Macedonian: 13 (0.01%)
Cypriot: 10 (0.01%)
Most common places of birth for foreign-born residents (%): Mexico Durham:
16.8% (7,480)North Carolina:
24.7% (214,776)
Honduras Durham:
13.2% (5,882)North Carolina:
4.7% (40,707)
India Durham:
7.7% (3,424)North Carolina:
9.3% (80,594)
China, excluding Hong Kong and Taiwan Durham:
6.4% (2,855)North Carolina:
3.2% (27,477)
El Salvador Durham:
5.2% (2,305)North Carolina:
3.8% (33,379)
Nigeria Durham:
2.9% (1,293)North Carolina:
1.1% (9,173)
Philippines Durham:
2.5% (1,099)North Carolina:
2.4% (20,695)
Vietnam Durham:
2.3% (1,015)North Carolina:
2.9% (24,965)
Korea Durham:
2.1% (931)North Carolina:
1.8% (15,988)
Colombia Durham:
1.9% (854)North Carolina:
2.1% (18,275)
Guatemala Durham:
1.8% (823)North Carolina:
2.6% (22,964)
Liberia Durham:
1.8% (801)North Carolina:
0.5% (4,475)
Canada Durham:
1.8% (797)North Carolina:
2.1% (18,105)
Jamaica Durham:
1.8% (794)North Carolina:
1.3% (11,419)
Germany Durham:
1.8% (779)North Carolina:
1.8% (15,534)
Cuba Durham:
1.7% (771)North Carolina:
1.0% (9,005)
England Durham:
1.6% (718)North Carolina:
1.2% (10,140)
Place of birth for U.S.-born residents:
This state: 132,598Other state: 111,519Northeast: 38,138Midwest: 18,081South: 42,549West: 12,751 85.1% of Durham residents lived in the same house 1 years ago.
Out of people who lived in different houses, 27.3% lived in this county.
Out of people who lived in different counties, 41.0% lived in North Carolina.
Durham:
85.1%State average:
87.3%
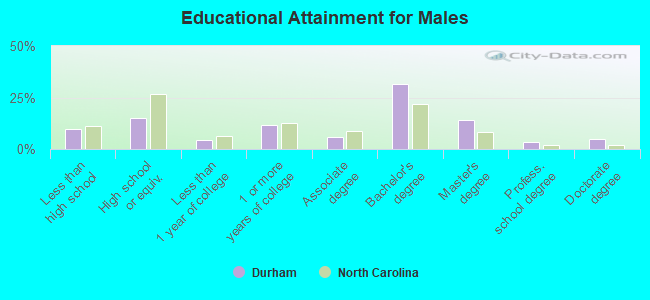
Education attainment for males 25 years and older:
No schooling: 1,413Nursery to 4th grade: 1,1965th and 6th grade: 1,0147th and 8th grade: 1,0229th grade: 59910th grade: 1,31611th grade: 1,16812th grade, no diploma: 1,147High school graduate (or equivalency): 13,728Less than 1 year of college: 3,962Some college more than 1 year, no degree: 10,860Associate degree: 5,292Bachelor's degree: 28,846Master's degree: 12,740Professional school degree: 3,282Doctorate degree: 4,422
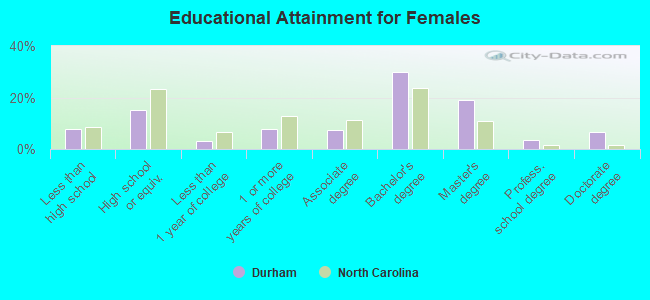
Education attainment for females 25 years and older:
No schooling: 1,724Nursery to 4th grade: 5845th and 6th grade: 8087th and 8th grade: 1,0029th grade: 1,12110th grade: 1,34811th grade: 72712th grade, no diploma: 946High school graduate (or equivalency): 16,376Less than 1 year of college: 3,221Some college more than 1 year, no degree: 8,472Associate degree: 7,902Bachelor's degree: 31,980Master's degree: 20,327Professional school degree: 3,870Doctorate degree: 6,924
Housing units in structures:
One, detached: 68,115One, attached: 14,385Two: 3,3723 or 4: 4,6625 to 9: 7,93910 to 19: 17,28220 to 49: 7,16950 or more: 10,674Mobile homes: 825Housing units lacking complete plumbing facilities in 2022: 0.1%Housing units lacking complete kitchen facilities in 2022: 0.4%House/condo owner moved in on average 9 years ago
Renter moved in on average 2 years ago
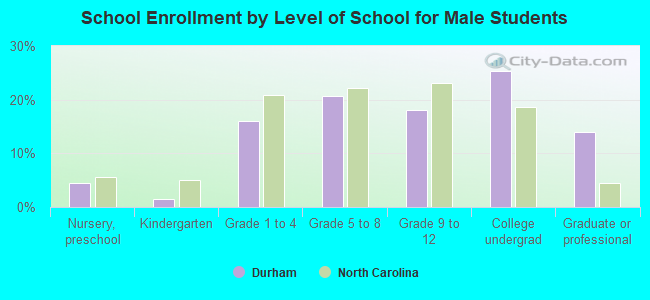
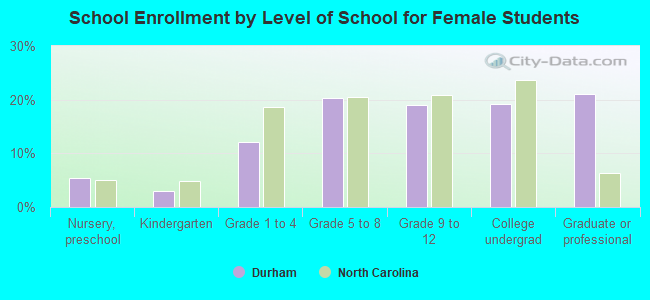
Private vs. public school enrollment:
Students in private schools in grades 1 to 8 (elementary and middle school): 4,130 Here:
16.3%North Carolina:
13.8%
Students in private schools in grades 9 to 12 (high school): 2,403 Here:
17.6%North Carolina:
11.9%
Students in private undergraduate colleges: 8,588 Here:
52.6%North Carolina:
19.3%