Eastford, CT (Connecticut) Houses and Residents
| Eastford: | $307,421 |
| Connecticut: | $347,200 |
Total population: 1,749 (Urban population: 0, Rural population: 1,618 (25 farm, 1,593 nonfarm))
Houses: 705 (618 occupied: 495 owner occupied, 123 renter occupied)
| % of renters here: | 20% |
| State: | 34% |
Housing density: 24 houses/condos per square mile
Median price asked for vacant for-sale houses and condos in 2022 in this county: $282,397.
Median contract rent in 2022: $1,065 (lower quartile is $907, upper quartile is $1,393)
Median rent asked for vacant for-rent units in 2022: $1,132
Median gross rent in Eastford, CT in 2022: $1,332
Housing units in Eastford with a mortgage: 259 (36 second mortgage, 30 home equity loan, 0 both second mortgage and home equity loan)
Houses without a mortgage: 111
Compare current foreclosures near Eastford, CT:
| Photo | Address | Area | Beds / Baths | Price | Details |
|---|---|---|---|---|---|

|
#1
N Society Rd
Canterbury, CT 06331
|
768 sq. feet
|
1 baths 2 beds |
$269,900
|
show details |

|
#2
Mountain Rd
Stafford Springs, CT 06076
|
1,235 sq. feet
|
2 baths 3 beds |
$299,900
|
show details |

|
#3
Round Lake Dr
Pascoag, RI 02859
|
976 sq. feet
|
2 baths 2 beds |
$179,900
|
show details |

|
#4
Tolland Ave
Stafford Springs, CT 06076
|
896 sq. feet
|
1 baths 3 beds |
$100,000
|
show details |

|
#5
Amber Rd
Holland, MA 01521
|
1,363 sq. feet
|
1 baths 3 beds |
show details | |

|
#6
Colburn Rd
Stafford Springs, CT 06076
|
1,114 sq. feet
|
1 baths 2 beds |
show details | |

|
#7
Old Turnpike Road
Thompson, CT 06277
|
1,316 sq. feet
|
1 baths 4 beds |
show details | |

|
#8
Marc Ave
Southbridge, MA 01550
|
960 sq. feet
|
1 baths 3 beds |
show details | |

|
#9
Mansfield Ave
Willimantic, CT 06226
|
920 sq. feet
|
1 baths 3 beds |
show details | |

|
#10
Boys Ave
Rogers, CT 06263
|
- sq. feet
|
2 baths 6 beds |
show details |
| Photo | Address | Area | Beds / Baths | Price | Details |
|---|---|---|---|---|---|

|
#11
Paine District Rd
Woodstock, CT 06281
|
1,092 sq. feet
|
1 baths 2 beds |
show details | |

|
#12
Stafford Rd
Monson, MA 01057
|
1,464 sq. feet
|
1 baths 3 beds |
show details | |

|
#13
Anthony Rd
Tolland, CT 06084
|
1,584 sq. feet
|
3 baths 4 beds |
show details | |

|
#14
Brookfield Rd
Brimfield, MA 01010
|
1,482 sq. feet
|
3 baths 3 beds |
show details | |

|
#15
Circle Dr
Mansfield Center, CT 06250
|
1,152 sq. feet
|
1 baths 3 beds |
show details | |

|
#16
High St
Coventry, CT 06238
|
913 sq. feet
|
1 baths 3 beds |
show details | |

|
#17
Colleen St
Danielson, CT 06239
|
1,714 sq. feet
|
1 baths 3 beds |
show details | |

|
#18
Pine St
Dudley, MA 01571
|
1,383 sq. feet
|
2 baths 3 beds |
show details | |

|
#19
Pine St
Dudley, MA 01571
|
1,118 sq. feet
|
1 baths 2 beds |
show details | |

|
#20
Holbrook Ave
Willimantic, CT 06226
|
1,536 sq. feet
|
2 baths 4 beds |
show details |
| Photo | Address | Area | Beds / Baths | Price | Details |
|---|---|---|---|---|---|

|
#21
Wysocki Dr Apt 58
Dudley, MA 01571
|
984 sq. feet
|
1 baths 2 beds |
show details | |

|
#22
Johnson Rd
Tolland, CT 06084
|
1,056 sq. feet
|
1 baths 1 beds |
show details | |

|
#23
W Park St
Willimantic, CT 06226
|
1,214 sq. feet
|
1 baths 3 beds |
show details | |

|
#24
Highcrest Park
Webster, MA 01570
|
1,536 sq. feet
|
2 baths 2 beds |
show details | |

|
#25
Merrow Rd Apt 146
Coventry, CT 06238
|
1,230 sq. feet
|
1 baths 2 beds |
show details | |

|
#26
Rocky Hill Rd
Woodstock, CT 06281
|
1,682 sq. feet
|
1 baths 3 beds |
show details | |

|
#27
Ramshorn Rd
Dudley, MA 01571
|
1,639 sq. feet
|
1 baths 5 beds |
show details | |

|
#28
Hopyard Rd
Stafford Springs, CT 06076
|
1,792 sq. feet
|
2 baths 3 beds |
show details | |

|
#29
Catherine St
Dudley, MA 01571
|
1,248 sq. feet
|
1 baths 4 beds |
show details | |

|
#30
Lakeside Dr
Thompson, CT 06277
|
954 sq. feet
|
1 baths 3 beds |
show details |
| Photo | Address | Area | Beds / Baths | Price | Details |
|---|---|---|---|---|---|

|
#31
Cricket Dr
Sturbridge, MA 01566
|
816 sq. feet
|
1 baths 2 beds |
show details | |

|
#32
Baxter St
Tolland, CT 06084
|
4,242 sq. feet
|
4 baths 3 beds |
show details | |

|
#33
Warsaw Ave
Dudley, MA 01571
|
1,484 sq. feet
|
2 baths 3 beds |
show details | |

|
#34
Hopyard Rd
Stafford Springs, CT 06076
|
1,908 sq. feet
|
2 baths 4 beds |
show details | |

|
#35
Torrey Rd
Southbridge, MA 01550
|
2,080 sq. feet
|
2 baths 4 beds |
show details | |

|
#36
Perryville Rd
Webster, MA 01570
|
1,424 sq. feet
|
2 baths 3 beds |
show details | |

|
#37
Alton Dr
Dudley, MA 01571
|
1,368 sq. feet
|
1 baths 4 beds |
show details | |

|
#38
Alton Dr
Dudley, MA 01571
|
1,608 sq. feet
|
1 baths 4 beds |
show details | |

|
#39
Quaddick Rd
Thompson, CT 06277
|
864 sq. feet
|
1 baths 2 beds |
show details | |

|
#40
Tuckie Rd
North Windham, CT 06256
|
1,144 sq. feet
|
1 baths 3 beds |
show details |
| Photo | Address | Area | Beds / Baths | Price | Details |
|---|---|---|---|---|---|

|
#41
Mashamoquet Rd
Pomfret Center, CT 06259
|
1,860 sq. feet
|
2 baths 3 beds |
show details | |

|
#42
Thompson Rd
Thompson, CT 06277
|
1,867 sq. feet
|
1 baths 5 beds |
show details | |

|
#43
Ernest St
Webster, MA 01570
|
1,330 sq. feet
|
2 baths 3 beds |
show details | |

|
#44
Pine Knoll Rd
Coventry, CT 06238
|
1,836 sq. feet
|
2 baths 3 beds |
show details | |

|
#45
Sturbridge Rd
Brimfield, MA 01010
|
1,404 sq. feet
|
2 baths 1 beds |
show details | |

|
#46
Lovers Ln
Plainfield, CT 06374
|
1,992 sq. feet
|
2 baths 3 beds |
show details | |

|
#47
Brookfield Rd
Brimfield, MA 01010
|
2,140 sq. feet
|
3 baths 3 beds |
show details | |

|
#48
Ward Ave
Moosup, CT 06354
|
1,808 sq. feet
|
2 baths 3 beds |
show details | |

|
#49
Parker Bridge Rd
Coventry, CT 06238
|
1,382 sq. feet
|
2 baths 2 beds |
show details | |

|
Check over 1 million property listings on Foreclosure.com!
|
browse all offers | |||
Latest news about housing in Eastford, CT collected exclusively by city-data.com from local newspapers, TV, and radio stations

 | 2024 Connecticut Town Tournament VI (Celebrating the 10-Year Anniversary & Dazzleman's Memorial) (705 replies) |
| Motivated and pre-approved buyer looking to buy a home in Windham County! (1 reply) |
| Connecticut TOWN TOURNAMENT V (2022) (831 replies) |
| Connecticut TOWN TOURNAMENT IV (2020) (849 replies) |
| Eversource response to Isaias (164 replies) |
| Retirement Move from Newton, MA to CT (44 replies) |

Household type by relationship:
Households: 113,657- In family households: 94,705 (20,200 male householders, 10,143 female householders)
22,420 spouses, 32,772 children (30,142 natural, 792 adopted, 1,838 stepchildren), 1,953 grandchildren, 839 brothers or sisters, 1,026 parents, foster children, 1,121 other relatives, 3,518 non-relatives
- In nonfamily households: 18,952 (7,012 male householders (5,014 living alone)), 7,455 female householders (6,006 living alone)), 4,485 nonrelatives
- In group quarters: 4,771 (1,565 institutionalized population)
18,008 married couples with children.
7,061 single-parent households (1,662 men, 5,399 women).
94.0% of residents of Eastford speak English at home.
0.5% of residents speak Spanish at home (100% speak English very well).
5.1% of residents speak other Indo-European language at home (60% speak English very well, 21% speak English well, 17% speak English not well, 3% don't speak English at all).
0.1% of residents speak Asian or Pacific Island language at home (100% speak English very well).
0.3% of residents speak other language at home (100% speak English very well).
Foreign born population: 119 (6.1%)
(58.0% of them are naturalized citizens)
| Here: | 7.2 |
| State: | 6.5 |
| Here: | 4.7 |
| State: | 4.0 |

- Bedrooms in owner-occupied houses and condos in Eastford, Connecticut
- 0no bedroom
- 231 bedroom
- 1122 bedrooms
- 2603 bedrooms
- 734 bedrooms
- 275+ bedrooms

- Bedrooms in renter-occupied apartments in Eastford, Connecticut
- 2no bedroom
- 351 bedroom
- 442 bedrooms
- 343 bedrooms
- 84 bedrooms
- 05+ bedrooms

- Cars and other vehicles available in Eastford in owner-occupied houses/condos
- 7no vehicle
- 991 vehicle
- 2672 vehicles
- 793 vehicles
- 354 vehicles
- 85+ vehicles

- Cars and other vehicles available in Eastford in renter-occupied apartments
- 19no vehicle
- 511 vehicle
- 382 vehicles
- 133 vehicles
- 24 vehicles
- 05+ vehicles

- Rooms in owner-occupied houses in Eastford, Connecticut
- 01 room
- 02 rooms
- 213 rooms
- 534 rooms
- 805 rooms
- 1506 rooms
- 867 rooms
- 448 rooms
- 619+ rooms

- Rooms in renter-occupied apartments in Eastford, Connecticut
- 21 room
- 92 rooms
- 343 rooms
- 264 rooms
- 205 rooms
- 196 rooms
- 87 rooms
- 38 rooms
- 29+ rooms


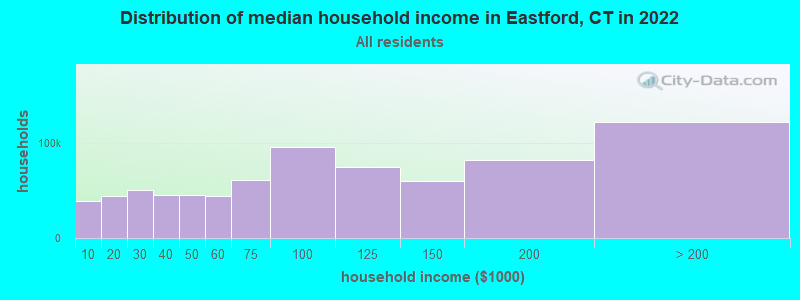
Eastford, CT household income distribution

- 4,324Less than $10,000
- 3,510$10,000 to $19,999
- 5,488$20,000 to $29,999
- 7,077$30,000 to $39,999
- 5,730$40,000 to $49,999
- 6,942$50,000 to $59,999
- 13,436$60,000 to $74,999
- 19,411$75,000 to $99,999
- 18,513$100,000 to $124,999
- 14,923$125,000 to $149,999
- 21,482$150,000 to $199,999
- 39,502$200,000 or more
Percentage of workers working in this county: 59.7%
Number of people working at home: 186 (18.8% of all workers)
Travel time to work (commute)
- Less than 5 minutes: 40
- 5 to 9 minutes: 98
- 10 to 14 minutes: 47
- 15 to 19 minutes: 88
- 20 to 24 minutes: 133
- 25 to 29 minutes: 78
- 30 to 34 minutes: 92
- 35 to 39 minutes: 29
- 40 to 44 minutes: 19
- 45 to 59 minutes: 102
- 60 to 89 minutes: 60
- 90 or more minutes: 15
Means of transportation to work:
- Drove a car alone: 655 (77.4%)
- Carpooled: 94 (11.1%)
- Bus or trolley bus: 7 (0.8%)
- Walked: 36 (4.3%)
- Other means: 9 (1.1%)
- Worked at home: 45 (5.3%)


- Year of entry for the foreign-born population in Eastford, Connecticut
- 161995 to March 2000
- 121990 to 1994
- 41985 to 1989
- 41980 to 1984
- 01975 to 1979
- 21970 to 1974
- 41965 to 1969
- 30Before 1965

First ancestries reported:
- English: 340 (17.1%)
- Irish: 237 (11.9%)
- French: 230 (11.6%)
- Other: 179 (9.0%)
- German: 159 (8.0%)
- Polish: 157 (7.9%)
- Italian: 154 (7.7%)
- French Canadian: 133 (6.7%)
- United States: 95 (4.8%)
- Russian: 49 (2.5%)
- Swedish: 42 (2.1%)
- Scottish: 41 (2.1%)
- Hungarian: 34 (1.7%)
- Czech: 29 (1.5%)
- Ukrainian: 26 (1.3%)
- Portuguese: 17 (0.9%)
- Scotch-Irish: 17 (0.9%)
- Dutch: 13 (0.7%)
- Norwegian: 11 (0.6%)
- Lithuanian: 10 (0.5%)
- Welsh: 5 (0.3%)
- Danish: 4 (0.2%)
- Swiss: 4 (0.2%)
- Slovak: 2 (0.1%)
- Subsaharan African: 2 (0.1%)
Most common places of birth for foreign-born residents (%):
| Eastford: | 23.6% (17) |
| Connecticut: | 1.4% (5,021) |
| Eastford: | 16.7% (12) |
| Connecticut: | 6.9% (25,507) |
| Eastford: | 11.1% (8) |
| Connecticut: | 1.0% (3,822) |
| Eastford: | 11.1% (8) |
| Connecticut: | 2.1% (7,596) |
| Eastford: | 8.3% (6) |
| Connecticut: | 5.2% (19,083) |
| Eastford: | 6.9% (5) |
| Connecticut: | 4.4% (16,395) |
| Eastford: | 5.6% (4) |
| Connecticut: | 0.6% (2,220) |
| Eastford: | 4.2% (3) |
| Connecticut: | 0.4% (1,483) |
| Eastford: | 2.8% (2) |
| Connecticut: | 1.2% (4,344) |
| Eastford: | 2.8% (2) |
| Connecticut: | 3.1% (11,432) |
| Eastford: | 2.8% (2) |
| Connecticut: | 1.5% (5,508) |
| Eastford: | 2.8% (2) |
| Connecticut: | 1.7% (6,247) |
Place of birth for U.S.-born residents:
- This state: 1,093
- Other state: 441
- Northeast: 287
- Midwest: 43
- South: 90
- West: 21
67% of Eastford residents lived in the same house 5 years ago.
Out of people who lived in different houses, 61% lived in this county.
Out of people who lived in different counties, 57% lived in Connecticut.
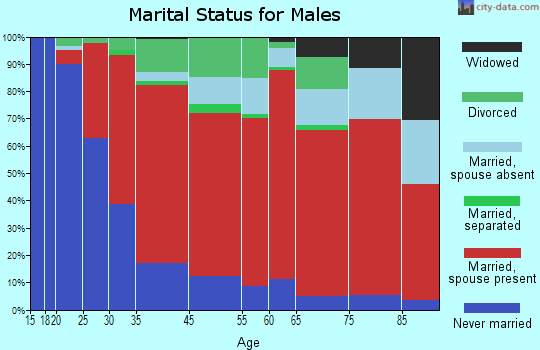
Education attainment for males 25 years and older:
- No schooling: 0
- Nursery to 4th grade: 0
- 5th and 6th grade: 2
- 7th and 8th grade: 12
- 9th grade: 12
- 10th grade: 19
- 11th grade: 13
- 12th grade, no diploma: 24
- High school graduate (or equivalency): 194
- Less than 1 year of college: 17
- Some college more than 1 year, no degree: 77
- Associate degree: 29
- Bachelor's degree: 92
- Master's degree: 34
- Professional school degree: 14
- Doctorate degree: 11

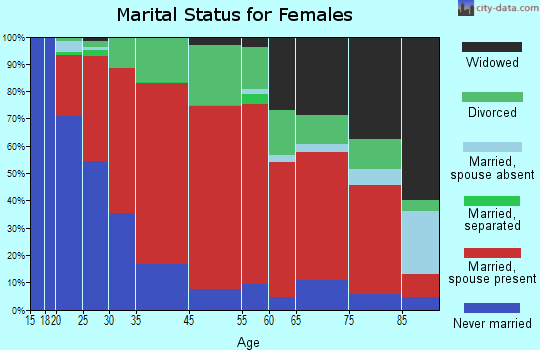
Education attainment for females 25 years and older:
- No schooling: 6
- Nursery to 4th grade: 0
- 5th and 6th grade: 0
- 7th and 8th grade: 13
- 9th grade: 4
- 10th grade: 2
- 11th grade: 3
- 12th grade, no diploma: 21
- High school graduate (or equivalency): 167
- Less than 1 year of college: 25
- Some college more than 1 year, no degree: 78
- Associate degree: 48
- Bachelor's degree: 115
- Master's degree: 57
- Professional school degree: 7
- Doctorate degree: 4

Housing units in structures:
- One, detached: 572
- One, attached: 7
- Two: 21
- 3 or 4: 26
- 5 to 9: 23
- 10 to 19: 3
- Mobile homes: 47
- Boats, RVs, vans, etc.: 6
Median worth of mobile homes: $79,507
Housing units lacking complete kitchen facilities: 2.6%

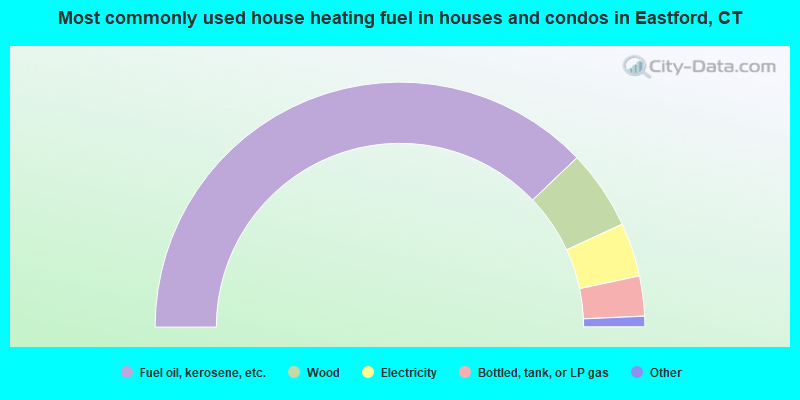
- 75.8%Fuel oil, kerosene, etc.
- 10.5%Wood
- 7.1%Electricity
- 5.3%Bottled, tank, or LP gas
- 0.8%Other fuel
- 0.6%Solar energy
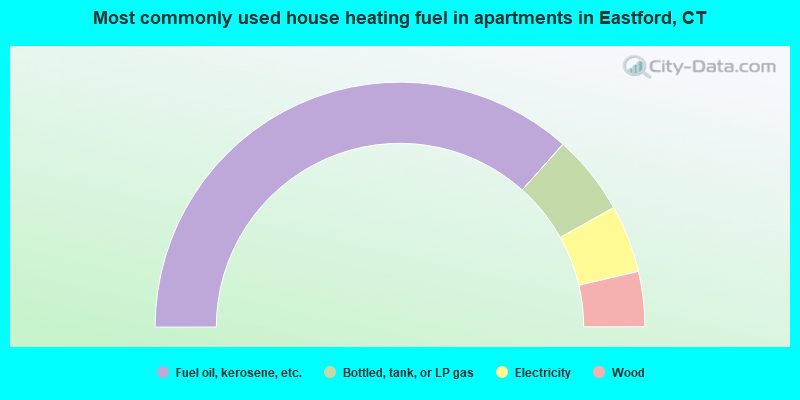
- 73.2%Fuel oil, kerosene, etc.
- 10.6%Bottled, tank, or LP gas
- 8.9%Electricity
- 7.3%Wood
Private vs. public school enrollment:
| Here: | 8.7% |
| Connecticut: | 9.9% |
| Here: | 7.6% |
| Connecticut: | 11.0% |
| Here: | 13.5% |
| Connecticut: | 33.4% |


