Easton, PA (Pennsylvania) Houses and Residents
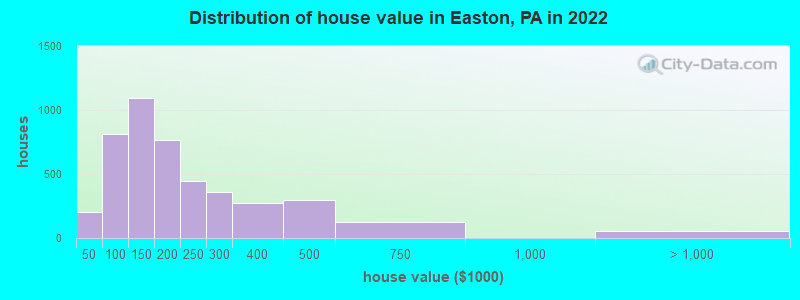
Estimated median house or condo value in 2022: $165,629 (it was $77,500 in 2000 )
Easton:
$165,629Pennsylvania:
$245,500
Lower value quartile - upper value quartile: $119,696 - $251,376Mean price in 2022: Detached houses: $301,886 Here:
$301,886State:
$317,202
Townhouses or other attached units: $175,261 Here:
$175,261State:
$254,369
In 2-unit structures: $186,668 Here:
$186,668State:
$249,182
In 3-to-4-unit structures: $269,362 Here:
$269,362State:
$297,446
In 5-or-more-unit structures: $126,717 Here:
$126,717State:
$320,068
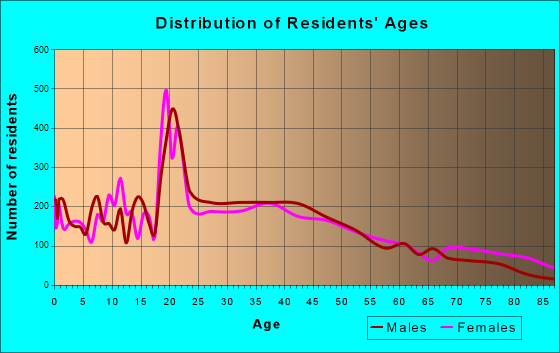
Total population: 27,052 (Urban population: 26,263, Rural population: 0)
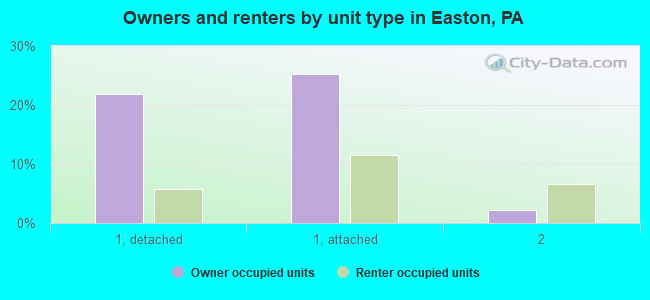
Houses: 11,656 (10,597 occupied: 4,918 owner occupied, 5,633 renter occupied )
% of renters here:
53%State:
31%
Housing density: 2,738 houses/condos per square mile
Median price asked for vacant for-sale houses and condos in 2022: $233,682.
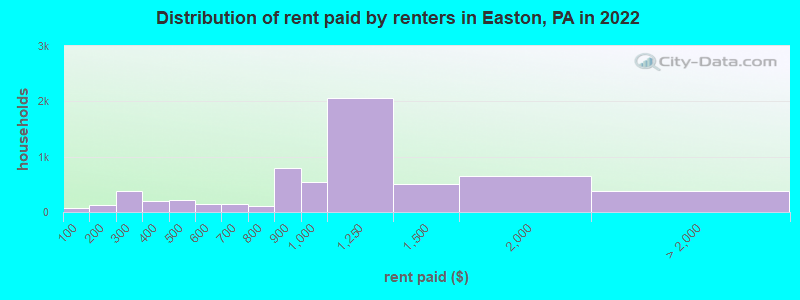
Median contract rent in 2022: $1,045 (lower quartile is $838, upper quartile is $1,269)
Median rent asked for vacant for-rent units in 2022: $1,610
Median gross rent in Easton, PA in 2022: $1,209
Housing units in Easton with a mortgage: 2,811 (123 second mortgage, 0 home equity loan, 115 both second mortgage and home equity loan )Houses without a mortgage: 138
Median household income for houses/condos with a mortgage: $93,857
Median household income for apartments without a mortgage: $59,849
Median monthly housing costs: $1,151
Data:
Median house or condo value ($)
Median house or condo value ($ change since 2000)
Median house or condo value ($) - White
Median house or condo value ($) - Black or African American
Median house or condo value ($) - Asian
Median house or condo value ($) - Hispanic or Latino
Median house or condo value ($) - American Indian and Alaska Native
Median house or condo value ($) - Multirace
Median house or condo value ($) - Other Race
Median price asked for mobile homes ($)
Household density (households per square mile)
Mean house or condo value by units in structure - 1, detached ($)
Mean house or condo value by units in structure - 1, attached ($)
Mean house or condo value by units in structure - 2 ($)
Mean house or condo value by units in structure by units in structure - 3 or 4 ($)
Mean house or condo value by units in structure - 5 or more ($)
Mean house or condo value by units in structure - Boat, RV, van, etc. ($)
Mean house or condo value by units in structure - Mobile home ($)
Median contract rent ($)
Median contract rent - Lower quartile ($)
Median contract rent - Upper quartile ($)
Median gross rent ($)
Urban houses (%)
Rural houses (%)
Houses occupied (%)
Houses occupied (% change since 2000)
Houses owner occupied (%)
Houses owner occupied (% change since 2000)
Houses renter occupied (%)
Houses renter occupied (% change since 2000)
Vacant housing units - For rent (%)
Vacant housing units - For rent (% change since 2000)
Vacant housing units - For sale only (%)
Vacant housing units - For sale only (% change since 2000)
Vacant housing units - Rented or sold, not occupied (%)
Vacant housing units - Rented or sold, not occupied (% change since 2000)
Vacant housing units - For seasonal, recreational, or occasional use (%)
Vacant housing units - For seasonal, recreational, or occasional use (% change since 2000)
Vacant housing units - For migrant workers (%)
Vacant housing units - For migrant workers (% change since 2000)
Vacant housing units - Other vacant (%)
Vacant housing units - Other vacant (% change since 2000)
Median monthly housing costs ($)
Median household income for houses/condos with a mortgage ($)
Median household income for houses/condos without a mortgage ($)
Median household income ($)
Median household income ($) - White
Median household income ($) - Black or African American
Median household income ($) - Asian
Median household income ($) - Hispanic or Latino
Median household income ($) - American Indian and Alaska Native
Median household income ($) - Multirace
Median household income ($) - Other Race
Mortgage status - with mortgage (%)
Mortgage status - with second mortgage (%)
Mortgage status - with home equity loan (%)
Mortgage status - with both second mortgage and home equity loan (%)
Mortgage status - without a mortgage (%)
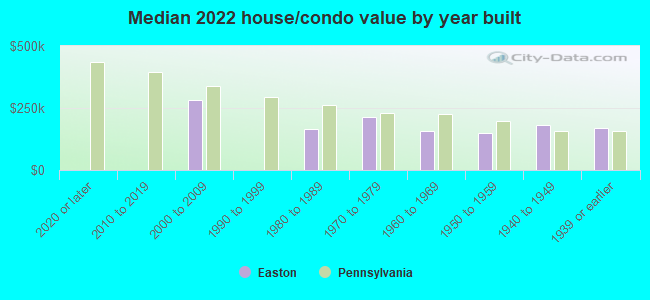
Median year house/condo built
Median year apartment built
Household type by relationship - Male householder living alone (%)
Household type by relationship - Male householder not living alone (%)
Household type by relationship - Female householder living alone (%)
Household type by relationship - Female householder not living alone (%)
Household type by relationship - Opposite-Sex spouse (%)
Household type by relationship - Same-Sex spouse (%)
Household type by relationship - Opposite-Sex unmarried partner (%)
Household type by relationship - Same-Sex unmarried partner (%)
Household type by relationship - In group quarters (%)
Size of family households - 2-person household (%)
Size of family households - 3-person household (%)
Size of family households - 4-person household (%)
Size of family households - 5-person household (%)
Size of family households - 6-person household (%)
Size of family households - 7-or-more-person household (%)
Size of nonfamily households - 1-person household (%)
Size of nonfamily households - 2-person household (%)
Size of nonfamily households - 3-person household (%)
Size of nonfamily households - 4-person household (%)
Size of nonfamily households - 5-person household (%)
Size of nonfamily households - 6-person household (%)
Size of nonfamily households - 7-or-moreperson household (%)
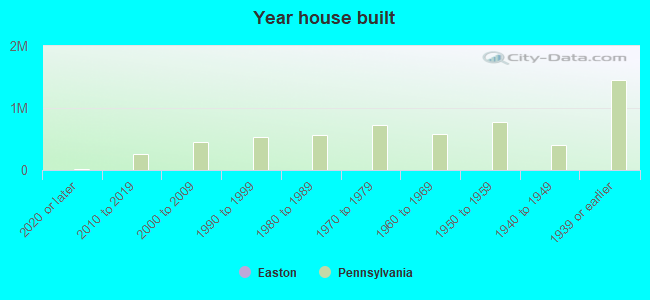
Year house built - Built 2010 or later (%)
Year house built - Built 2000 to 2009 (%)
Year house built - Built 1990 to 1999 (%)
Year house built - Built 1980 to 1989 (%)
Year house built - Built 1970 to 1979 (%)
Year house built - Built 1960 to 1969 (%)
Year house built - Built 1950 to 1959 (%)
Year house built - Built 1940 to 1949 (%)
Year house built - Built 1939 or earlier (%)
Median number of rooms in houses and condos
Median number of rooms in apartments
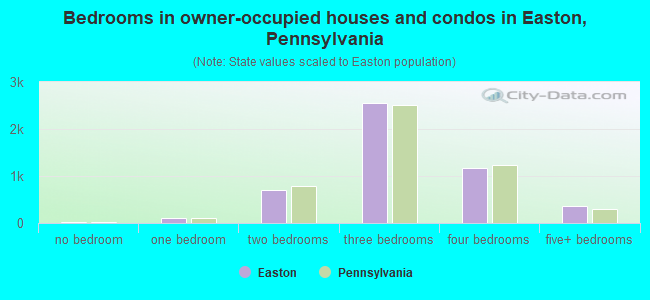
Median number of bedrooms in owner occupied houses
Mean number of bedrooms in owner occupied houses
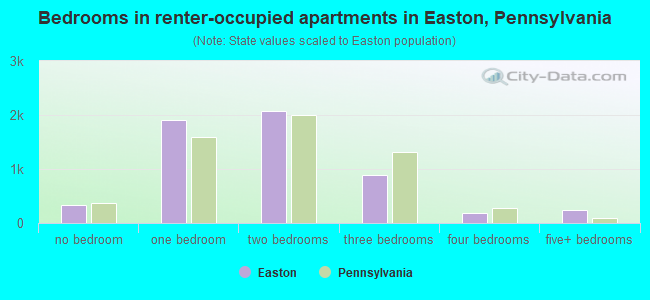
Median number of bedrooms in renter occupied houses
Mean number of bedrooms in renter occupied houses
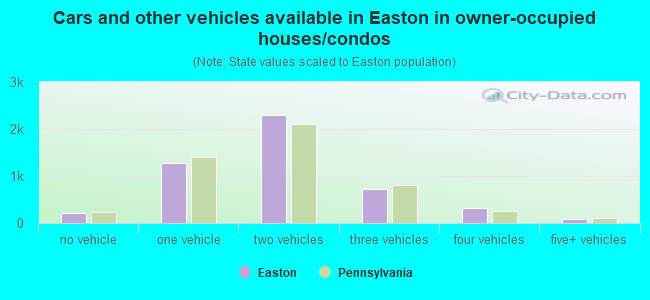
Median number of vehichles in owner occupied houses
Mean number of vehichles in owner occupied houses
Median number of vehichles in renter occupied houses
Mean number of vehichles in renter occupied houses
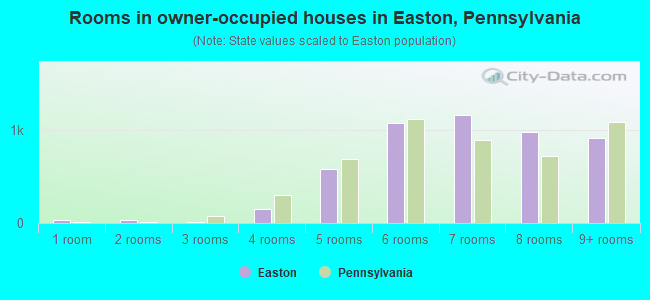
Rooms in owner-occupied houses - 1 room (%)
Rooms in owner-occupied houses - 2 rooms (%)
Rooms in owner-occupied houses - 3 rooms (%)
Rooms in owner-occupied houses - 4 rooms (%)
Rooms in owner-occupied houses - 5 rooms (%)
Rooms in owner-occupied houses - 6 rooms (%)
Rooms in owner-occupied houses - 7 rooms (%)
Rooms in owner-occupied houses - 8 rooms (%)
Rooms in owner-occupied houses - 9+ rooms (%)
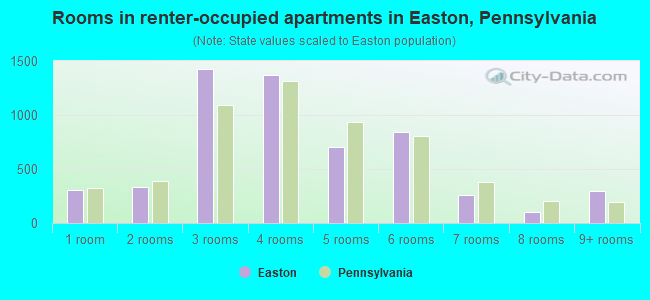
Rooms in renter-occupied houses - 1 room (%)
Rooms in renter-occupied houses - 2 rooms (%)
Rooms in renter-occupied houses - 3 rooms (%)
Rooms in renter-occupied houses - 4 rooms (%)
Rooms in renter-occupied houses - 5 rooms (%)
Rooms in renter-occupied houses - 6 rooms (%)
Rooms in renter-occupied houses - 7 rooms (%)
Rooms in renter-occupied houses - 8 rooms (%)
Rooms in renter-occupied houses - 9+ rooms (%)
Bedrooms in owner-occupied houses - no bedrooms (%)
Bedrooms in owner-occupied houses - 1 bedroom (%)
Bedrooms in owner-occupied houses - 2 bedrooms (%)
Bedrooms in owner-occupied houses - 3 bedrooms (%)
Bedrooms in owner-occupied houses - 4 bedrooms (%)
Bedrooms in owner-occupied houses - 5+ bedrooms (%)
Bedrooms in renter-occupied houses - no bedrooms (%)
Bedrooms in renter-occupied houses - 1 bedroom (%)
Bedrooms in renter-occupied houses - 2 bedrooms (%)
Bedrooms in renter-occupied houses - 3 bedrooms (%)
Bedrooms in renter-occupied houses - 4 bedrooms (%)
Bedrooms in renter-occupied houses - 5+ bedrooms (%)
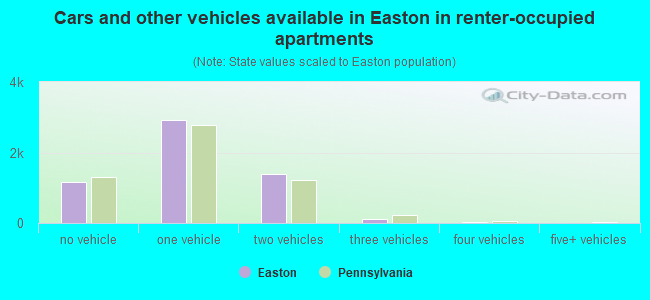
Vehicles available in owner-occupied houses - no vehicle available (%)
Vehicles available in owner-occupied houses - 1 vehicle available(%)
Vehicles available in owner-occupied houses - 2 Vehicles available (%)
Vehicles available in owner-occupied houses - 3 Vehicles available (%)
Vehicles available in owner-occupied houses - 4 Vehicles available (%)
Vehicles available in owner-occupied houses - 5+ Vehicles available (%)
Vehicles available in renter-occupied houses - no vehicle available (%)
Vehicles available in renter-occupied houses - 1 vehicle available (%)
Vehicles available in renter-occupied houses - 2 Vehicles available (%)
Vehicles available in renter-occupied houses - 3 Vehicles available (%)
Vehicles available in renter-occupied houses - 4 Vehicles available (%)
Vehicles available in renter-occupied houses - 5+ Vehicles available (%)
Housing units in structures - 1, detached (%)
Housing units in structures - 1, attached (%)
Housing units in structures - 2 (%)
Housing units in structures - 3 or 4 (%)
Housing units in structures - 5 to 9 (%)
Housing units in structures - 10 to 19 (%)
Housing units in structures - 20 to 49 (%)
Housing units in structures - 50 or more (%)
Housing units in structures - Mobile home (%)
Housing units in structures - Boat, RV, van, etc. (%)
Housing units in structures - Owners - 1, detached (%)
Housing units in structures - Owners - 1, attached (%)
Housing units in structures - Owners - 2 (%)
Housing units in structures - Owners - 3 or 4 (%)
Housing units in structures - Owners - 5 to 9 (%)
Housing units in structures - Owners - 10 to 19 (%)
Housing units in structures - Owners - 20 to 49 (%)
Housing units in structures - Owners - 50 or more (%)
Housing units in structures - Owners - Mobile home (%)
Housing units in structures - Owners - Boat, RV, van, etc. (%)
Housing units in structures - Renters - 1, detached (%)
Housing units in structures - Renters - 1, attached (%)
Housing units in structures - Renters - 2 (%)
Housing units in structures - Renters - 3 or 4 (%)
Housing units in structures - Renters - 5 to 9 (%)
Housing units in structures - Renters - 10 to 19 (%)
Housing units in structures - Renters - 20 to 49 (%)
Housing units in structures - Renters - 50 or more (%)
Housing units in structures - Renters - Mobile home (%)
Housing units in structures - Renters - Boat, RV, van, etc. (%)
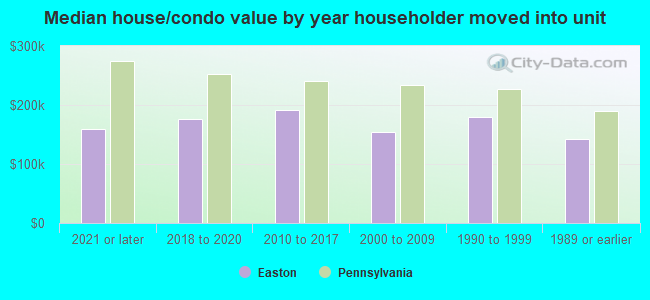
House/condo owner moved in on average (years ago)
Renter moved in on average (years ago)
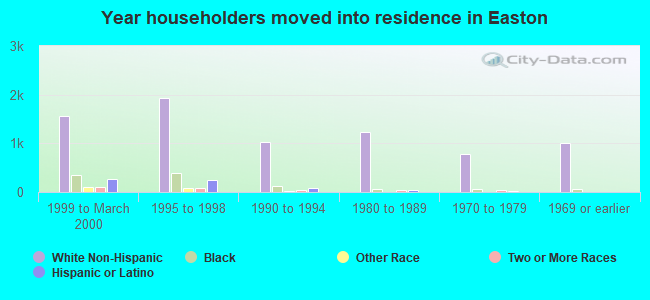
Year householder moved into unit - Moved in 1999 to March 2000 (%)
Year householder moved into unit - Moved in 1999 to March 2000 (%) - White
Year householder moved into unit - Moved in 1999 to March 2000 (%) - Black or African American
Year householder moved into unit - Moved in 1999 to March 2000 (%) - Asian
Year householder moved into unit - Moved in 1999 to March 2000 (%) - Hispanic or Latino
Year householder moved into unit - Moved in 1999 to March 2000 (%) - American Indian and Alaska Native
Year householder moved into unit - Moved in 1999 to March 2000 (%) - Multirace
Year householder moved into unit - Moved in 1999 to March 2000 (%) - Other Race
Year householder moved into unit - Moved in 1995 to 1998 (%)
Year householder moved into unit - Moved in 1995 to 1998 (%) - White
Year householder moved into unit - Moved in 1995 to 1998 (%) - Black or African American
Year householder moved into unit - Moved in 1995 to 1998 (%) - Asian
Year householder moved into unit - Moved in 1995 to 1998 (%) - Hispanic or Latino
Year householder moved into unit - Moved in 1995 to 1998 (%) - American Indian and Alaska Native
Year householder moved into unit - Moved in 1995 to 1998 (%) - Multirace
Year householder moved into unit - Moved in 1995 to 1998 (%) - Other Race
Year householder moved into unit - Moved in 1990 to 1994 (%)
Year householder moved into unit - Moved in 1990 to 1994 (%) - White
Year householder moved into unit - Moved in 1990 to 1994 (%) - Black or African American
Year householder moved into unit - Moved in 1990 to 1994 (%) - Asian
Year householder moved into unit - Moved in 1990 to 1994 (%) - Hispanic or Latino
Year householder moved into unit - Moved in 1990 to 1994 (%) - American Indian and Alaska Native
Year householder moved into unit - Moved in 1990 to 1994 (%) - Multirace
Year householder moved into unit - Moved in 1990 to 1994 (%) - Other Race
Year householder moved into unit - Moved in 1980 to 1989 (%)
Year householder moved into unit - Moved in 1980 to 1989 (%) - White
Year householder moved into unit - Moved in 1980 to 1989 (%) - Black or African American
Year householder moved into unit - Moved in 1980 to 1989 (%) - Asian
Year householder moved into unit - Moved in 1980 to 1989 (%) - Hispanic or Latino
Year householder moved into unit - Moved in 1980 to 1989 (%) - American Indian and Alaska Native
Year householder moved into unit - Moved in 1980 to 1989 (%) - Multirace
Year householder moved into unit - Moved in 1980 to 1989 (%) - Other Race
Year householder moved into unit - Moved in 1970 to 1979 (%)
Year householder moved into unit - Moved in 1970 to 1979 (%) - White
Year householder moved into unit - Moved in 1970 to 1979 (%) - Black or African American
Year householder moved into unit - Moved in 1970 to 1979 (%) - Asian
Year householder moved into unit - Moved in 1970 to 1979 (%) - Hispanic or Latino
Year householder moved into unit - Moved in 1970 to 1979 (%) - American Indian and Alaska Native
Year householder moved into unit - Moved in 1970 to 1979 (%) - Multirace
Year householder moved into unit - Moved in 1970 to 1979 (%) - Other Race
Year householder moved into unit - Moved in 1969 or earlier (%)
Year householder moved into unit - Moved in 1969 or earlier (%) - White
Year householder moved into unit - Moved in 1969 or earlier (%) - Black or African American
Year householder moved into unit - Moved in 1969 or earlier (%) - Asian
Year householder moved into unit - Moved in 1969 or earlier (%) - Hispanic or Latino
Year householder moved into unit - Moved in 1969 or earlier (%) - American Indian and Alaska Native
Year householder moved into unit - Moved in 1969 or earlier (%) - Multirace
Year householder moved into unit - Moved in 1969 or earlier (%) - Other Race
Housing units lacking complete plumbing facilities (%)
Housing units lacking complete kitchen facilities (%)
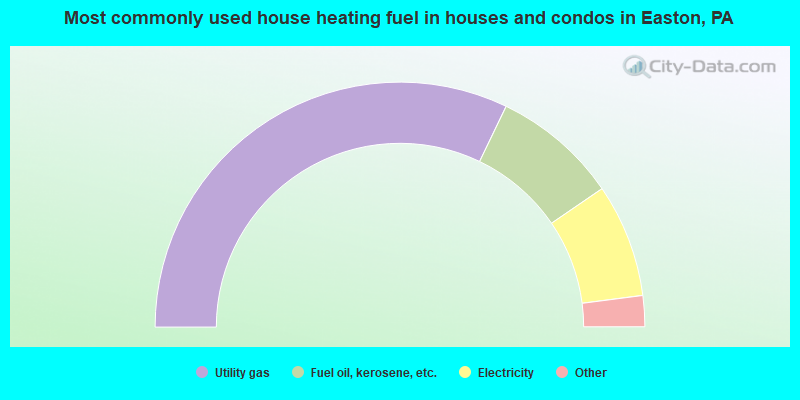
House heating fuel used in houses and condos - Utility gas (%)
House heating fuel used in houses and condos - Bottled, tank, or LP gas (%)
House heating fuel used in houses and condos - Electricity (%)
House heating fuel used in houses and condos - Fuel oil, kerosene, etc. (%)
House heating fuel used in houses and condos - Coal or coke (%)
House heating fuel used in houses and condos - Wood (%)
House heating fuel used in houses and condos - Solar energy (%)
House heating fuel used in houses and condos - Other fuel (%)
House heating fuel used in houses and condos - No fuel used (%)
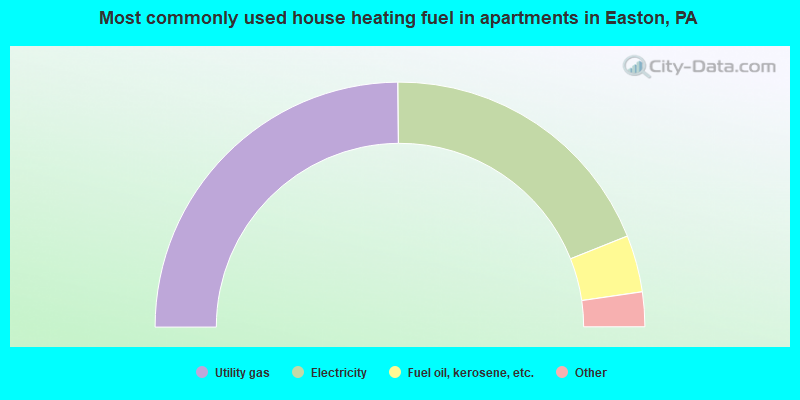
House heating fuel used in apartments - Utility gas (%)
House heating fuel used in apartments - Bottled, tank, or LP gas (%)
House heating fuel used in apartments - Electricity (%)
House heating fuel used in apartments - Fuel oil, kerosene, etc. (%)
House heating fuel used in apartments - Coal or coke (%)
House heating fuel used in apartments - Wood (%)
House heating fuel used in apartments - Solar energy (%)
House heating fuel used in apartments - Other fuel (%)
House heating fuel used in apartments - No fuel used (%)
Latest news about housing in Easton, PA collected exclusively by city-data.com from local newspapers, TV, and radio stations
Median year house/condo built: 1938Median year apartment built: 1938Household type by relationship:
Households: 29,271
Male householders: 5,047 (1,806 living alone ), Female householders: 5,534 (1,560 living alone )3,647 spouses (3,514 opposite-sex spouses ), 883 unmarried partners , (849 opposite-sex unmarried partners ), 7,296 children (6,642 natural , 109 adopted , 545 stepchildren ), 987 grandchildren , 294 brothers or sisters , 342 parents , 27 foster children , 709 other relatives , 599 non-relatives In group quarters: 3,899
Size of family households: 2,278 2-persons , 1,507 3-persons , 1,082 4-persons , 566 5-persons , 277 6-persons , 295 7-or-more-persons .
Size of nonfamily households: 3,853 1-person , 954 2-persons , 7 3-persons .
1,968 married couples with children. single-parent households (476 men , 1,939 women ).
79.0% of residents of Easton speak English at home. of residents speak Spanish at home (55% speak English very well , 22% speak English well , 18% speak English not well , 5% don't speak English at all ).of residents speak other Indo-European language at home (55% speak English very well , 40% speak English well , 5% speak English not well ).of residents speak Asian or Pacific Island language at home (63% speak English very well , 37% speak English well ).of residents speak other language at home (95% speak English very well , 5% speak English well ).
Foreign born population: 4,512 (15.4%)of them are naturalized citizens )
Median number of rooms in houses and condos:
Median number of rooms in apartments
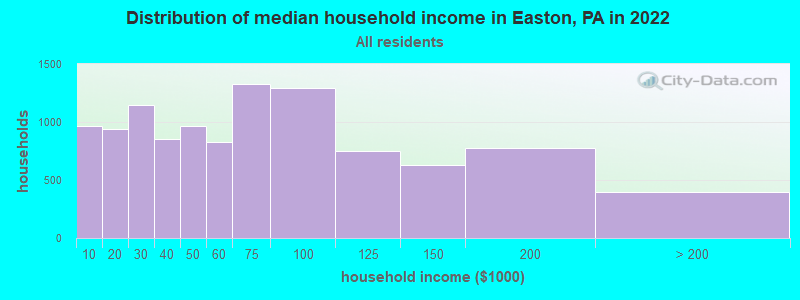
Easton, PA household income distribution 967 Less than $10,000940 $10,000 to $19,9991,146 $20,000 to $29,999854 $30,000 to $39,999968 $40,000 to $49,999828 $50,000 to $59,9991,327 $60,000 to $74,9991,292 $75,000 to $99,999746 $100,000 to $124,999629 $125,000 to $149,999775 $150,000 to $199,999398 $200,000 or more
Home value of owner - occupied houses in 2022 in Easton, PA 87 Less than $10,00016 $10,000 to $14,99915 $15,000 to $19,99942 $20,000 to $24,99911 $35,000 to $39,99928 $40,000 to $49,9994 $50,000 to $59,999215 $60,000 to $69,999291 $70,000 to $79,999197 $80,000 to $89,99973 $90,000 to $99,999477 $100,000 to $124,999614 $125,000 to $149,999540 $150,000 to $174,999225 $175,000 to $199,999441 $200,000 to $249,999355 $250,000 to $299,999270 $300,000 to $399,999293 $400,000 to $499,999128 $500,000 to $749,99950 $1,000,000 to $1,499,999Rent paid by renters in 2022 in Easton, PA 71 Less than $100129 $150 to $19932 $200 to $249341 $250 to $29976 $300 to $349117 $350 to $399123 $400 to $44990 $450 to $499109 $500 to $54938 $550 to $599138 $600 to $64939 $700 to $74977 $750 to $799798 $800 to $899536 $900 to $9992,058 $1,000 to $1,249513 $1,250 to $1,499657 $1,500 to $1,99933 $2,000 to $2,49964 $2,500 to $2,999286 No cash rent
Percentage of workers working in this county: 73.5%Number of people working at home: 1,825 (12.9% of all workers )
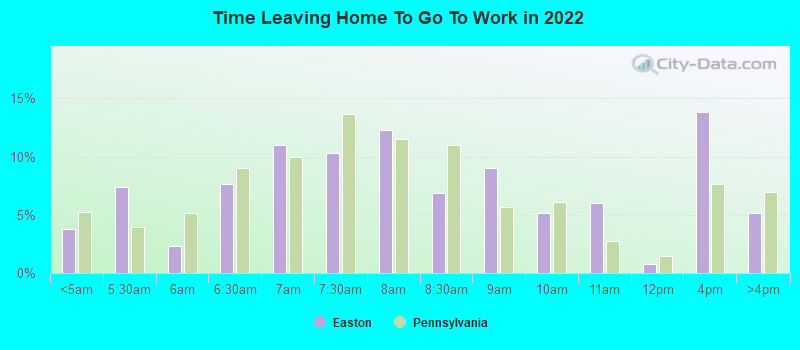
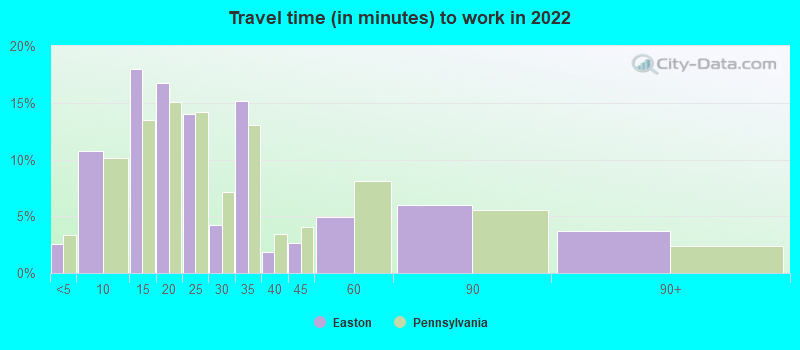
Travel time to work (commute)
Less than 5 minutes: 2945 to 9 minutes: 1,41310 to 14 minutes: 2,02015 to 19 minutes: 2,06620 to 24 minutes: 1,80725 to 29 minutes: 53530 to 34 minutes: 1,51835 to 39 minutes: 15740 to 44 minutes: 38845 to 59 minutes: 51960 to 89 minutes: 50690 or more minutes: 1,231
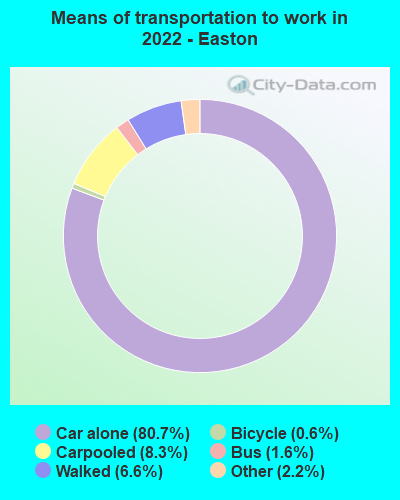
Means of transportation to work:
Drove a car alone: 10,235 (70.3%)Carpooled: 1,052 (7.2%)Bus : 318 (2.2%)Taxi: 273 (1.9%)Bicycle: 101 (0.7%)Walked: 687 (4.7%)Worked at home: 1,825 (12.5%)
Unemployment by race in 2022
Unemployment rate for White non-Hispanic residents 4.8% Males1.6% FemalesUnemployment rate for Black residents 4.4% Males1.1% FemalesUnemployment rate for Asian residents 6.5% FemalesUnemployment rate for other race residents 3.0% FemalesUnemployment rate for two or more race residents 17.1% Males4.0% FemalesUnemployment rate for Hispanic or Latino residents 16.1% Males3.3% Females
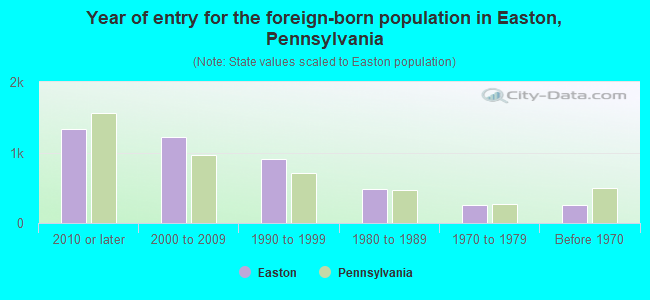
Year of entry for the foreign-born population in Easton, Pennsylvania
1,334 2010 or later 1,217 2000 to 2009 903 1990 to 1999 487 1980 to 1989 258 1970 to 1979 259 Before 1970
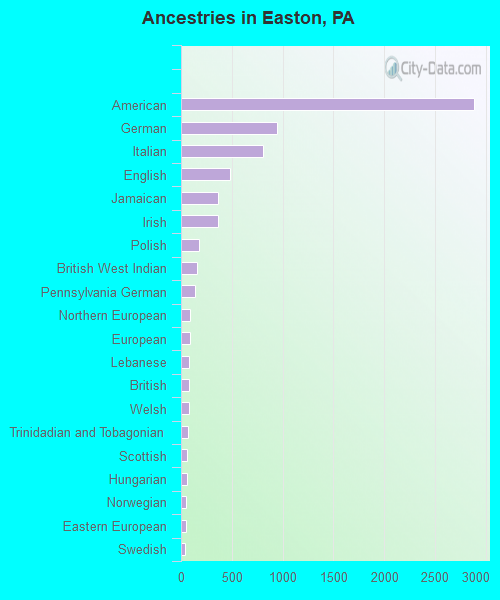
First ancestries reported:
American: 2,888 (19.7%)
German: 950 (6.5%)
Italian: 810 (5.5%)
English: 484 (3.3%)
Jamaican: 362 (2.5%)
Irish: 360 (2.5%)
Polish: 176 (1.2%)
British West Indian: 153 (1.0%)
Pennsylvania German: 141 (1.0%)
Northern European: 87 (0.6%)
European: 87 (0.6%)
Lebanese: 81 (0.6%)
British: 76 (0.5%)
Welsh: 76 (0.5%)
Trinidadian and Tobagonian: 66 (0.5%)
Scottish: 62 (0.4%)
Hungarian: 58 (0.4%)
Norwegian: 51 (0.3%)
Eastern European: 48 (0.3%)
Swedish: 44 (0.3%)
Portuguese: 26 (0.2%)
Lithuanian: 25 (0.2%)
Scotch-Irish: 25 (0.2%)
Canadian: 21 (0.1%)
Dutch: 17 (0.1%)
French: 15 (0.1%)
Haitian: 15 (0.1%)
Arab: 14 (0.10%)
Slavic: 12 (0.08%)
Russian: 11 (0.08%)
Australian: 10 (0.07%)
Ethiopian: 10 (0.07%)
Moroccan: 9 (0.06%)
Armenian: 9 (0.06%)
Scandinavian: 8 (0.05%)
Albanian: 6 (0.04%)
Liberian: 4 (0.03%)
Slovak: 1 (0.01%)
Turkish: 1 (0.01%) Most common places of birth for foreign-born residents (%): Dominican Republic Easton:
24.1% (984)Pennsylvania:
9.2% (86,544)
Jamaica Easton:
12.3% (504)Pennsylvania:
2.4% (22,612)
Mexico Easton:
9.7% (397)Pennsylvania:
5.8% (54,190)
Ecuador Easton:
7.0% (286)Pennsylvania:
1.1% (10,035)
El Salvador Easton:
5.8% (235)Pennsylvania:
0.8% (7,727)
Guatemala Easton:
5.1% (210)Pennsylvania:
1.4% (13,268)
Peru Easton:
3.8% (157)Pennsylvania:
0.7% (6,690)
China, excluding Hong Kong and Taiwan Easton:
3.8% (156)Pennsylvania:
7.2% (67,704)
Poland Easton:
3.2% (129)Pennsylvania:
1.3% (12,172)
Grenada Easton:
3.0% (123)Pennsylvania:
0.1% (842)
Costa Rica Easton:
2.9% (120)Pennsylvania:
0.3% (3,132)
Venezuela Easton:
2.7% (110)Pennsylvania:
0.6% (5,742)
Canada Easton:
2.3% (93)Pennsylvania:
1.8% (17,032)
Colombia Easton:
2.0% (81)Pennsylvania:
1.5% (13,823)
Trinidad and Tobago Easton:
2.0% (81)Pennsylvania:
0.8% (7,224)
Place of birth for U.S.-born residents:
This state: 13,024Other state: 10,929Northeast: 7,816Midwest: 430South: 1,734West: 1,041 84.2% of Easton residents lived in the same house 1 years ago.
Out of people who lived in different houses, 25.2% lived in this county.
Out of people who lived in different counties, 41.0% lived in Pennsylvania.
Easton:
84.2%State average:
89.3%
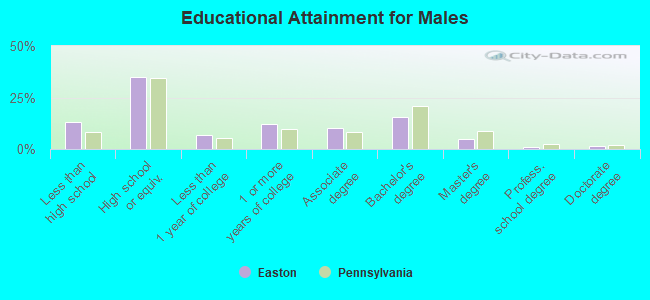
Education attainment for males 25 years and older:
No schooling: 173Nursery to 4th grade: 145th and 6th grade: 1317th and 8th grade: 2429th grade: 2710th grade: 22011th grade: 25312th grade, no diploma: 144High school graduate (or equivalency): 3,226Less than 1 year of college: 615Some college more than 1 year, no degree: 1,111Associate degree: 925Bachelor's degree: 1,426Master's degree: 468Professional school degree: 102Doctorate degree: 142
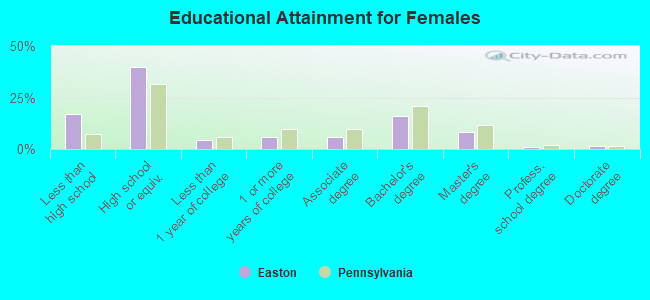
Education attainment for females 25 years and older:
No schooling: 70Nursery to 4th grade: 155th and 6th grade: 307th and 8th grade: 1269th grade: 20610th grade: 48011th grade: 56312th grade, no diploma: 66High school graduate (or equivalency): 3,689Less than 1 year of college: 424Some college more than 1 year, no degree: 547Associate degree: 550Bachelor's degree: 1,478Master's degree: 784Professional school degree: 95Doctorate degree: 119
Housing units in structures:
One, detached: 3,129One, attached: 3,878Two: 1,5443 or 4: 6965 to 9: 83310 to 19: 68120 to 49: 65950 or more: 199Mobile homes: 32Housing units lacking complete plumbing facilities in 2022: 2.6%Housing units lacking complete kitchen facilities in 2022: 2.8%House/condo owner moved in on average 13 years ago
Renter moved in on average 1 years ago
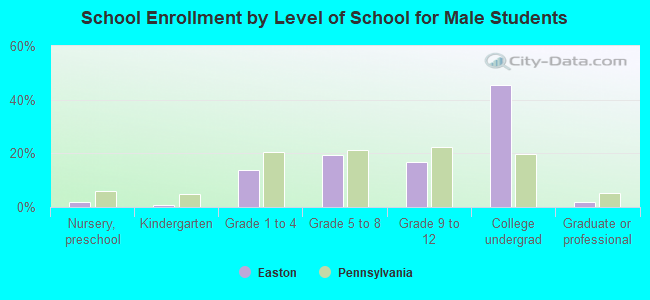
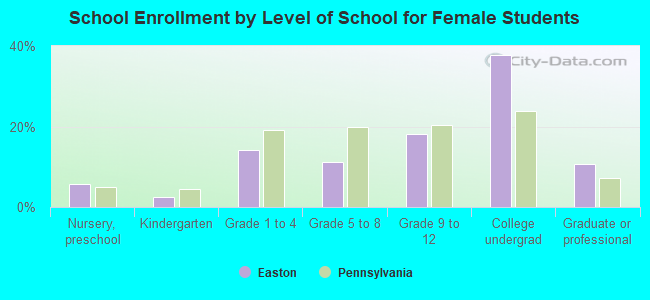
Private vs. public school enrollment:
Students in private schools in grades 1 to 8 (elementary and middle school): 214 Here:
8.4%Pennsylvania:
15.7%
Students in private schools in grades 9 to 12 (high school): 17 Here:
1.1%Pennsylvania:
13.4%
Students in private undergraduate colleges: 2,634 Here:
74.7%Pennsylvania:
39.8%