Edinburg, TX (Texas) Houses and Residents
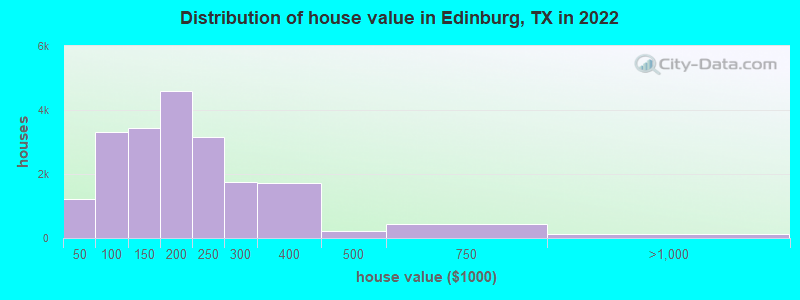
Estimated median house or condo value in 2022: $176,800 (it was $57,100 in 2000 )
Edinburg:
$176,800Texas:
$275,400
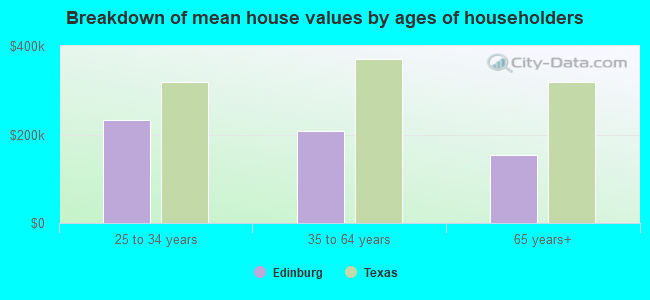
Lower value quartile - upper value quartile: $92,600 - $244,200Mean price in 2022: Detached houses: $236,274 Here:
$236,274State:
$369,058
Townhouses or other attached units: $141,720 Here:
$141,720State:
$327,631
In 2-unit structures: $428,083 Here:
$428,083State:
$374,947
In 3-to-4-unit structures: $349,327 Here:
$349,327State:
$209,652
Mobile homes: $78,530 Here:
$78,530State:
$124,413
Occupied boats, RVs, vans, etc.: $46,318 Here:
$46,318State:
$73,921
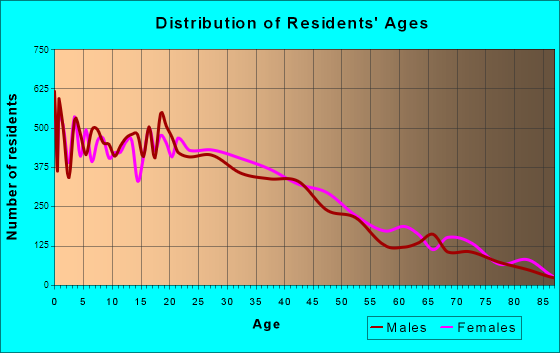
Total population: 83,014 (Urban population: 47,145, Rural population: 1,718 (43 farm, 1,675 nonfarm ))
Houses: 35,023 (32,462 occupied: 17,956 owner occupied, 14,506 renter occupied )
% of renters here:
45%State:
38%
Housing density: 937 houses/condos per square mile
Median price asked for vacant for-sale houses and condos in 2022: $230,028.
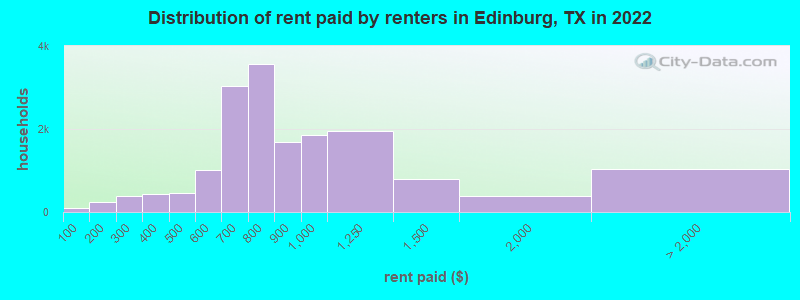
Median contract rent in 2022: $757 (lower quartile is $612, upper quartile is $929)
Median rent asked for vacant for-rent units in 2022: $558
Median gross rent in Edinburg, TX in 2022: $895
Housing units in Edinburg with a mortgage: 9,861 (259 second mortgage, 28 home equity loan, 217 both second mortgage and home equity loan )Houses without a mortgage: 164
Median household income for houses/condos with a mortgage: $83,670
Median household income for apartments without a mortgage: $70,644
Median monthly housing costs: $896
Data:
Median house or condo value ($)
Median house or condo value ($ change since 2000)
Median house or condo value ($) - White
Median house or condo value ($) - Black or African American
Median house or condo value ($) - Asian
Median house or condo value ($) - Hispanic or Latino
Median house or condo value ($) - American Indian and Alaska Native
Median house or condo value ($) - Multirace
Median house or condo value ($) - Other Race
Median price asked for mobile homes ($)
Household density (households per square mile)
Mean house or condo value by units in structure - 1, detached ($)
Mean house or condo value by units in structure - 1, attached ($)
Mean house or condo value by units in structure - 2 ($)
Mean house or condo value by units in structure by units in structure - 3 or 4 ($)
Mean house or condo value by units in structure - 5 or more ($)
Mean house or condo value by units in structure - Boat, RV, van, etc. ($)
Mean house or condo value by units in structure - Mobile home ($)
Median contract rent ($)
Median contract rent - Lower quartile ($)
Median contract rent - Upper quartile ($)
Median gross rent ($)
Urban houses (%)
Rural houses (%)
Houses occupied (%)
Houses occupied (% change since 2000)
Houses owner occupied (%)
Houses owner occupied (% change since 2000)
Houses renter occupied (%)
Houses renter occupied (% change since 2000)
Vacant housing units - For rent (%)
Vacant housing units - For rent (% change since 2000)
Vacant housing units - For sale only (%)
Vacant housing units - For sale only (% change since 2000)
Vacant housing units - Rented or sold, not occupied (%)
Vacant housing units - Rented or sold, not occupied (% change since 2000)
Vacant housing units - For seasonal, recreational, or occasional use (%)
Vacant housing units - For seasonal, recreational, or occasional use (% change since 2000)
Vacant housing units - For migrant workers (%)
Vacant housing units - For migrant workers (% change since 2000)
Vacant housing units - Other vacant (%)
Vacant housing units - Other vacant (% change since 2000)
Median monthly housing costs ($)
Median household income for houses/condos with a mortgage ($)
Median household income for houses/condos without a mortgage ($)
Median household income ($)
Median household income ($) - White
Median household income ($) - Black or African American
Median household income ($) - Asian
Median household income ($) - Hispanic or Latino
Median household income ($) - American Indian and Alaska Native
Median household income ($) - Multirace
Median household income ($) - Other Race
Mortgage status - with mortgage (%)
Mortgage status - with second mortgage (%)
Mortgage status - with home equity loan (%)
Mortgage status - with both second mortgage and home equity loan (%)
Mortgage status - without a mortgage (%)
Median year house/condo built
Median year apartment built
Household type by relationship - Male householder living alone (%)
Household type by relationship - Male householder not living alone (%)
Household type by relationship - Female householder living alone (%)
Household type by relationship - Female householder not living alone (%)
Household type by relationship - Opposite-Sex spouse (%)
Household type by relationship - Same-Sex spouse (%)
Household type by relationship - Opposite-Sex unmarried partner (%)
Household type by relationship - Same-Sex unmarried partner (%)
Household type by relationship - In group quarters (%)
Size of family households - 2-person household (%)
Size of family households - 3-person household (%)
Size of family households - 4-person household (%)
Size of family households - 5-person household (%)
Size of family households - 6-person household (%)
Size of family households - 7-or-more-person household (%)
Size of nonfamily households - 1-person household (%)
Size of nonfamily households - 2-person household (%)
Size of nonfamily households - 3-person household (%)
Size of nonfamily households - 4-person household (%)
Size of nonfamily households - 5-person household (%)
Size of nonfamily households - 6-person household (%)
Size of nonfamily households - 7-or-moreperson household (%)
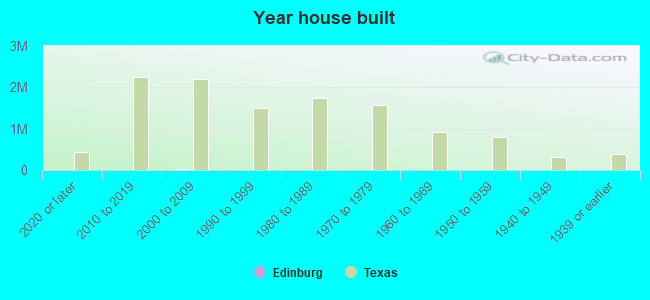
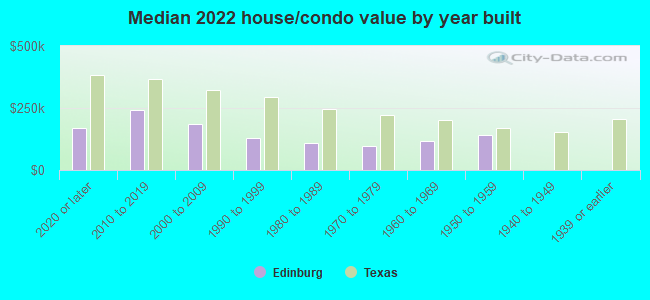
Year house built - Built 2010 or later (%)
Year house built - Built 2000 to 2009 (%)
Year house built - Built 1990 to 1999 (%)
Year house built - Built 1980 to 1989 (%)
Year house built - Built 1970 to 1979 (%)
Year house built - Built 1960 to 1969 (%)
Year house built - Built 1950 to 1959 (%)
Year house built - Built 1940 to 1949 (%)
Year house built - Built 1939 or earlier (%)
Median number of rooms in houses and condos
Median number of rooms in apartments
Median number of bedrooms in owner occupied houses
Mean number of bedrooms in owner occupied houses
Median number of bedrooms in renter occupied houses
Mean number of bedrooms in renter occupied houses
Median number of vehichles in owner occupied houses
Mean number of vehichles in owner occupied houses
Median number of vehichles in renter occupied houses
Mean number of vehichles in renter occupied houses
Rooms in owner-occupied houses - 1 room (%)
Rooms in owner-occupied houses - 2 rooms (%)
Rooms in owner-occupied houses - 3 rooms (%)
Rooms in owner-occupied houses - 4 rooms (%)
Rooms in owner-occupied houses - 5 rooms (%)
Rooms in owner-occupied houses - 6 rooms (%)
Rooms in owner-occupied houses - 7 rooms (%)
Rooms in owner-occupied houses - 8 rooms (%)
Rooms in owner-occupied houses - 9+ rooms (%)
Rooms in renter-occupied houses - 1 room (%)
Rooms in renter-occupied houses - 2 rooms (%)
Rooms in renter-occupied houses - 3 rooms (%)
Rooms in renter-occupied houses - 4 rooms (%)
Rooms in renter-occupied houses - 5 rooms (%)
Rooms in renter-occupied houses - 6 rooms (%)
Rooms in renter-occupied houses - 7 rooms (%)
Rooms in renter-occupied houses - 8 rooms (%)
Rooms in renter-occupied houses - 9+ rooms (%)
Bedrooms in owner-occupied houses - no bedrooms (%)
Bedrooms in owner-occupied houses - 1 bedroom (%)
Bedrooms in owner-occupied houses - 2 bedrooms (%)
Bedrooms in owner-occupied houses - 3 bedrooms (%)
Bedrooms in owner-occupied houses - 4 bedrooms (%)
Bedrooms in owner-occupied houses - 5+ bedrooms (%)
Bedrooms in renter-occupied houses - no bedrooms (%)
Bedrooms in renter-occupied houses - 1 bedroom (%)
Bedrooms in renter-occupied houses - 2 bedrooms (%)
Bedrooms in renter-occupied houses - 3 bedrooms (%)
Bedrooms in renter-occupied houses - 4 bedrooms (%)
Bedrooms in renter-occupied houses - 5+ bedrooms (%)
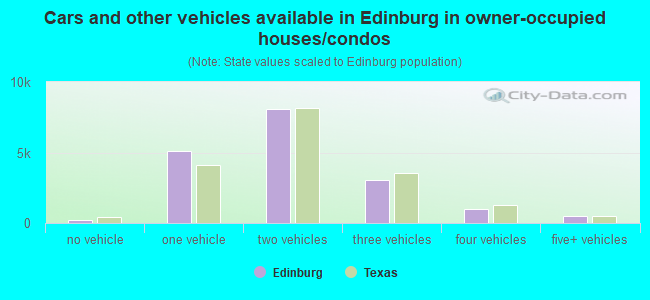
Vehicles available in owner-occupied houses - no vehicle available (%)
Vehicles available in owner-occupied houses - 1 vehicle available(%)
Vehicles available in owner-occupied houses - 2 Vehicles available (%)
Vehicles available in owner-occupied houses - 3 Vehicles available (%)
Vehicles available in owner-occupied houses - 4 Vehicles available (%)
Vehicles available in owner-occupied houses - 5+ Vehicles available (%)
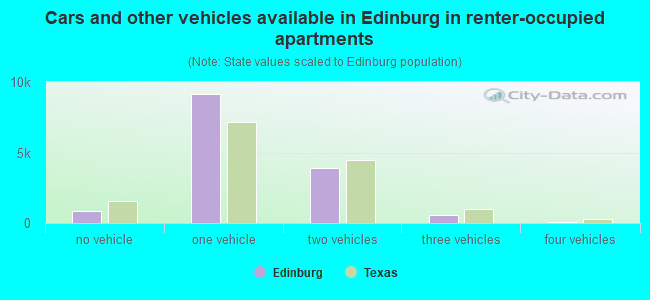
Vehicles available in renter-occupied houses - no vehicle available (%)
Vehicles available in renter-occupied houses - 1 vehicle available (%)
Vehicles available in renter-occupied houses - 2 Vehicles available (%)
Vehicles available in renter-occupied houses - 3 Vehicles available (%)
Vehicles available in renter-occupied houses - 4 Vehicles available (%)
Vehicles available in renter-occupied houses - 5+ Vehicles available (%)
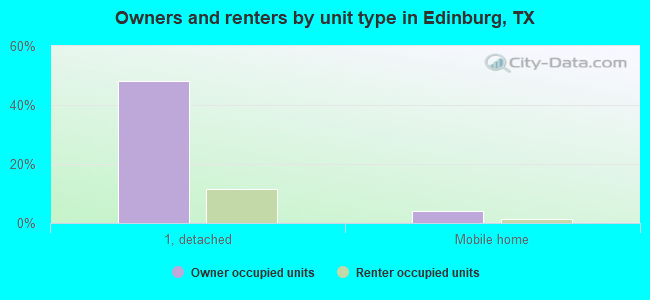
Housing units in structures - 1, detached (%)
Housing units in structures - 1, attached (%)
Housing units in structures - 2 (%)
Housing units in structures - 3 or 4 (%)
Housing units in structures - 5 to 9 (%)
Housing units in structures - 10 to 19 (%)
Housing units in structures - 20 to 49 (%)
Housing units in structures - 50 or more (%)
Housing units in structures - Mobile home (%)
Housing units in structures - Boat, RV, van, etc. (%)
Housing units in structures - Owners - 1, detached (%)
Housing units in structures - Owners - 1, attached (%)
Housing units in structures - Owners - 2 (%)
Housing units in structures - Owners - 3 or 4 (%)
Housing units in structures - Owners - 5 to 9 (%)
Housing units in structures - Owners - 10 to 19 (%)
Housing units in structures - Owners - 20 to 49 (%)
Housing units in structures - Owners - 50 or more (%)
Housing units in structures - Owners - Mobile home (%)
Housing units in structures - Owners - Boat, RV, van, etc. (%)
Housing units in structures - Renters - 1, detached (%)
Housing units in structures - Renters - 1, attached (%)
Housing units in structures - Renters - 2 (%)
Housing units in structures - Renters - 3 or 4 (%)
Housing units in structures - Renters - 5 to 9 (%)
Housing units in structures - Renters - 10 to 19 (%)
Housing units in structures - Renters - 20 to 49 (%)
Housing units in structures - Renters - 50 or more (%)
Housing units in structures - Renters - Mobile home (%)
Housing units in structures - Renters - Boat, RV, van, etc. (%)
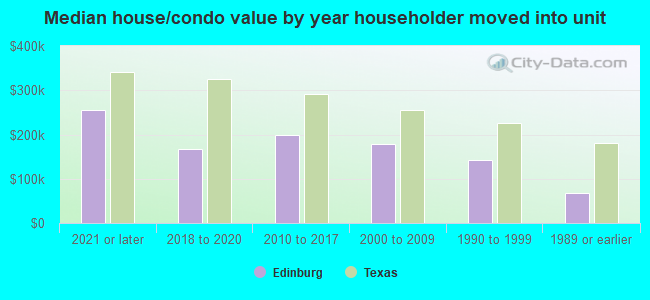
House/condo owner moved in on average (years ago)
Renter moved in on average (years ago)
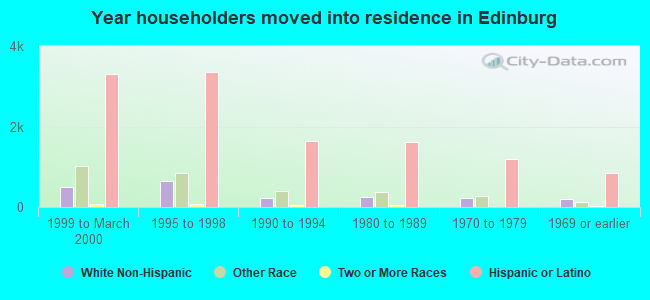
Year householder moved into unit - Moved in 1999 to March 2000 (%)
Year householder moved into unit - Moved in 1999 to March 2000 (%) - White
Year householder moved into unit - Moved in 1999 to March 2000 (%) - Black or African American
Year householder moved into unit - Moved in 1999 to March 2000 (%) - Asian
Year householder moved into unit - Moved in 1999 to March 2000 (%) - Hispanic or Latino
Year householder moved into unit - Moved in 1999 to March 2000 (%) - American Indian and Alaska Native
Year householder moved into unit - Moved in 1999 to March 2000 (%) - Multirace
Year householder moved into unit - Moved in 1999 to March 2000 (%) - Other Race
Year householder moved into unit - Moved in 1995 to 1998 (%)
Year householder moved into unit - Moved in 1995 to 1998 (%) - White
Year householder moved into unit - Moved in 1995 to 1998 (%) - Black or African American
Year householder moved into unit - Moved in 1995 to 1998 (%) - Asian
Year householder moved into unit - Moved in 1995 to 1998 (%) - Hispanic or Latino
Year householder moved into unit - Moved in 1995 to 1998 (%) - American Indian and Alaska Native
Year householder moved into unit - Moved in 1995 to 1998 (%) - Multirace
Year householder moved into unit - Moved in 1995 to 1998 (%) - Other Race
Year householder moved into unit - Moved in 1990 to 1994 (%)
Year householder moved into unit - Moved in 1990 to 1994 (%) - White
Year householder moved into unit - Moved in 1990 to 1994 (%) - Black or African American
Year householder moved into unit - Moved in 1990 to 1994 (%) - Asian
Year householder moved into unit - Moved in 1990 to 1994 (%) - Hispanic or Latino
Year householder moved into unit - Moved in 1990 to 1994 (%) - American Indian and Alaska Native
Year householder moved into unit - Moved in 1990 to 1994 (%) - Multirace
Year householder moved into unit - Moved in 1990 to 1994 (%) - Other Race
Year householder moved into unit - Moved in 1980 to 1989 (%)
Year householder moved into unit - Moved in 1980 to 1989 (%) - White
Year householder moved into unit - Moved in 1980 to 1989 (%) - Black or African American
Year householder moved into unit - Moved in 1980 to 1989 (%) - Asian
Year householder moved into unit - Moved in 1980 to 1989 (%) - Hispanic or Latino
Year householder moved into unit - Moved in 1980 to 1989 (%) - American Indian and Alaska Native
Year householder moved into unit - Moved in 1980 to 1989 (%) - Multirace
Year householder moved into unit - Moved in 1980 to 1989 (%) - Other Race
Year householder moved into unit - Moved in 1970 to 1979 (%)
Year householder moved into unit - Moved in 1970 to 1979 (%) - White
Year householder moved into unit - Moved in 1970 to 1979 (%) - Black or African American
Year householder moved into unit - Moved in 1970 to 1979 (%) - Asian
Year householder moved into unit - Moved in 1970 to 1979 (%) - Hispanic or Latino
Year householder moved into unit - Moved in 1970 to 1979 (%) - American Indian and Alaska Native
Year householder moved into unit - Moved in 1970 to 1979 (%) - Multirace
Year householder moved into unit - Moved in 1970 to 1979 (%) - Other Race
Year householder moved into unit - Moved in 1969 or earlier (%)
Year householder moved into unit - Moved in 1969 or earlier (%) - White
Year householder moved into unit - Moved in 1969 or earlier (%) - Black or African American
Year householder moved into unit - Moved in 1969 or earlier (%) - Asian
Year householder moved into unit - Moved in 1969 or earlier (%) - Hispanic or Latino
Year householder moved into unit - Moved in 1969 or earlier (%) - American Indian and Alaska Native
Year householder moved into unit - Moved in 1969 or earlier (%) - Multirace
Year householder moved into unit - Moved in 1969 or earlier (%) - Other Race
Housing units lacking complete plumbing facilities (%)
Housing units lacking complete kitchen facilities (%)
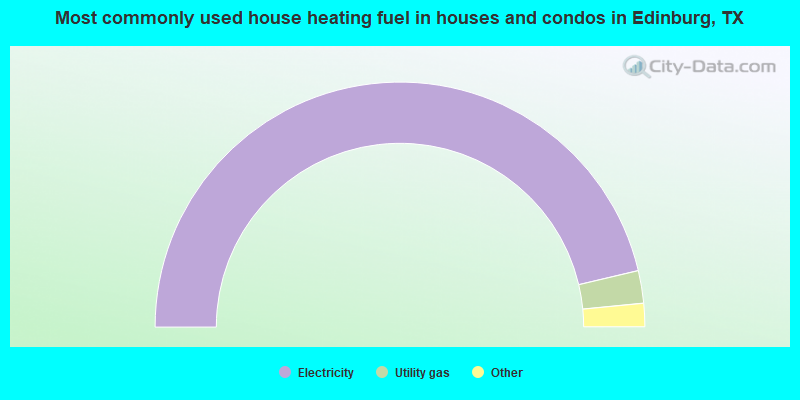
House heating fuel used in houses and condos - Utility gas (%)
House heating fuel used in houses and condos - Bottled, tank, or LP gas (%)
House heating fuel used in houses and condos - Electricity (%)
House heating fuel used in houses and condos - Fuel oil, kerosene, etc. (%)
House heating fuel used in houses and condos - Coal or coke (%)
House heating fuel used in houses and condos - Wood (%)
House heating fuel used in houses and condos - Solar energy (%)
House heating fuel used in houses and condos - Other fuel (%)
House heating fuel used in houses and condos - No fuel used (%)
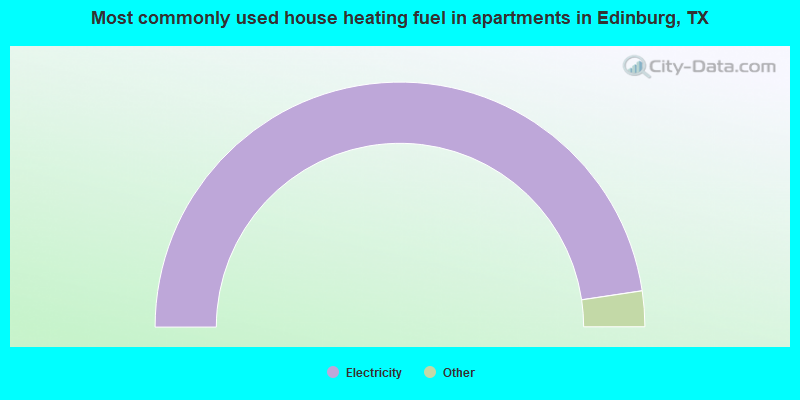
House heating fuel used in apartments - Utility gas (%)
House heating fuel used in apartments - Bottled, tank, or LP gas (%)
House heating fuel used in apartments - Electricity (%)
House heating fuel used in apartments - Fuel oil, kerosene, etc. (%)
House heating fuel used in apartments - Coal or coke (%)
House heating fuel used in apartments - Wood (%)
House heating fuel used in apartments - Solar energy (%)
House heating fuel used in apartments - Other fuel (%)
House heating fuel used in apartments - No fuel used (%)
Latest news about housing in Edinburg, TX collected exclusively by city-data.com from local newspapers, TV, and radio stations
Median year house/condo built: 2004Median year apartment built: 2004Household type by relationship:
Households: 104,302
Male householders: 14,990 (4,674 living alone ), Female householders: 17,472 (3,356 living alone )14,308 spouses (14,005 opposite-sex spouses ), 1,309 unmarried partners , (1,113 opposite-sex unmarried partners ), 41,192 children (40,327 natural , 0 adopted , 865 stepchildren ), 4,742 grandchildren , 985 brothers or sisters , 1,044 parents , 0 foster children , 2,018 other relatives , 1,928 non-relatives In group quarters: 4,314
Size of family households: 5,872 2-persons , 4,390 3-persons , 5,530 4-persons , 4,714 5-persons , 1,713 6-persons , 649 7-or-more-persons .
Size of nonfamily households: 8,030 1-person , 1,366 2-persons , 198 4-persons .
18,265 married couples with children. single-parent households (783 men , 10,488 women ).
27.6% of residents of Edinburg speak English at home. of residents speak Spanish at home (72% speak English very well , 15% speak English well , 6% speak English not well , 7% don't speak English at all ).of residents speak other Indo-European language at home (61% speak English very well , 35% speak English well , 4% speak English not well ).of residents speak Asian or Pacific Island language at home (85% speak English very well , 14% speak English well , 1% speak English not well ).of residents speak other language at home (74% speak English very well , 26% speak English well ).
Foreign born population: 22,433 (21.5%)of them are naturalized citizens )
Median number of rooms in houses and condos:
Median number of rooms in apartments
Owner-occupied Renter-occupied
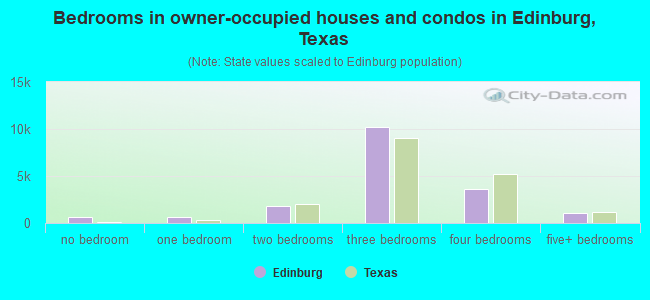
Bedrooms in owner-occupied houses and condos in Edinburg, Texas
684 no bedroom 627 1 bedroom 1,786 2 bedrooms 10,264 3 bedrooms 3,582 4 bedrooms 1,013 5+ bedrooms
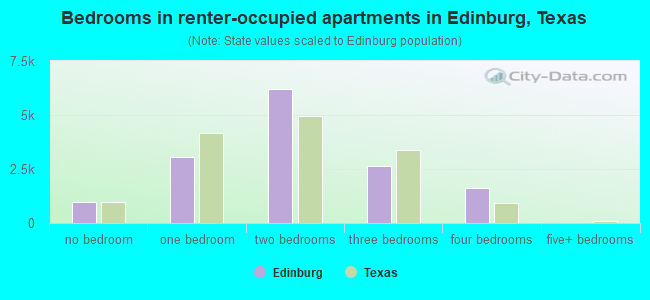
Bedrooms in renter-occupied apartments in Edinburg, Texas
985 no bedroom 3,052 1 bedroom 6,219 2 bedrooms 2,647 3 bedrooms 1,603 4 bedrooms 0 5+ bedrooms
Owner-occupied Renter-occupied
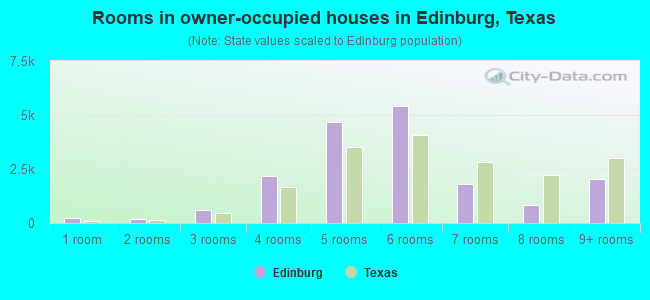
Rooms in owner-occupied houses in Edinburg, Texas
252 1 room 166 2 rooms 614 3 rooms 2,185 4 rooms 4,657 5 rooms 5,437 6 rooms 1,798 7 rooms 828 8 rooms 2,019 9+ rooms
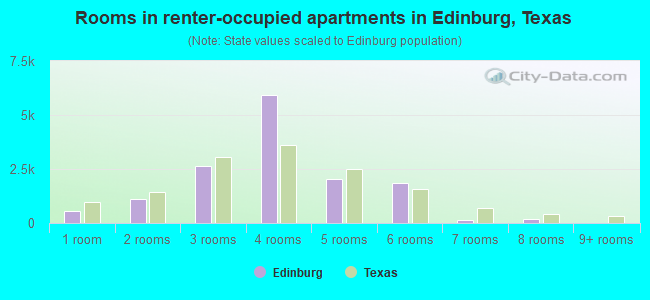
Rooms in renter-occupied apartments in Edinburg, Texas
558 1 room 1,101 2 rooms 2,641 3 rooms 5,940 4 rooms 2,045 5 rooms 1,857 6 rooms 151 7 rooms 196 8 rooms 17 9+ rooms
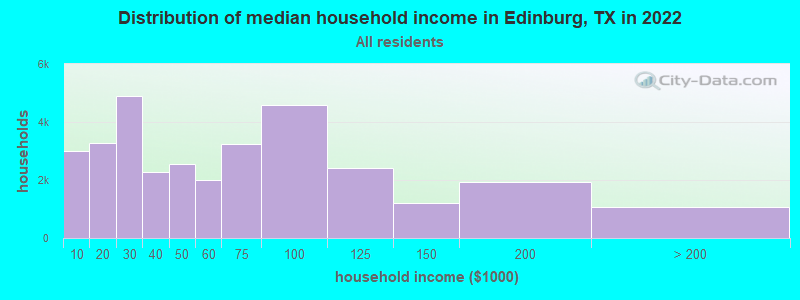
Edinburg, TX household income distribution 3,012 Less than $10,0003,283 $10,000 to $19,9994,901 $20,000 to $29,9992,268 $30,000 to $39,9992,563 $40,000 to $49,9991,999 $50,000 to $59,9993,234 $60,000 to $74,9994,591 $75,000 to $99,9992,409 $100,000 to $124,9991,190 $125,000 to $149,9991,930 $150,000 to $199,9991,082 $200,000 or more
Home value of owner - occupied houses in 2022 in Edinburg, TX 120 Less than $10,00012 $10,000 to $14,99956 $15,000 to $19,99964 $20,000 to $24,999182 $25,000 to $29,999233 $30,000 to $34,99978 $35,000 to $39,999455 $40,000 to $49,999551 $50,000 to $59,999640 $60,000 to $69,999408 $70,000 to $79,999725 $80,000 to $89,999542 $90,000 to $99,9991,556 $100,000 to $124,9991,879 $125,000 to $149,9992,059 $150,000 to $174,9992,540 $175,000 to $199,9993,161 $200,000 to $249,9991,755 $250,000 to $299,9991,718 $300,000 to $399,999216 $400,000 to $499,999447 $500,000 to $749,99954 $750,000 to $999,99950 $1,000,000 to $1,499,99930 $2,000,000 or moreRent paid by renters in 2022 in Edinburg, TX 86 Less than $10049 $100 to $149194 $150 to $199160 $200 to $249213 $250 to $299236 $300 to $349205 $350 to $399333 $400 to $449119 $450 to $499571 $500 to $549449 $550 to $5991,448 $600 to $6491,587 $650 to $6991,613 $700 to $7491,951 $750 to $7991,685 $800 to $8991,864 $900 to $9991,945 $1,000 to $1,249790 $1,250 to $1,499390 $1,500 to $1,99990 $2,000 to $2,4993 $3,000 to $3,499948 No cash rent
Percentage of workers working in this county: 91.3%Number of people working at home: 4,719 (10.6% of all workers )
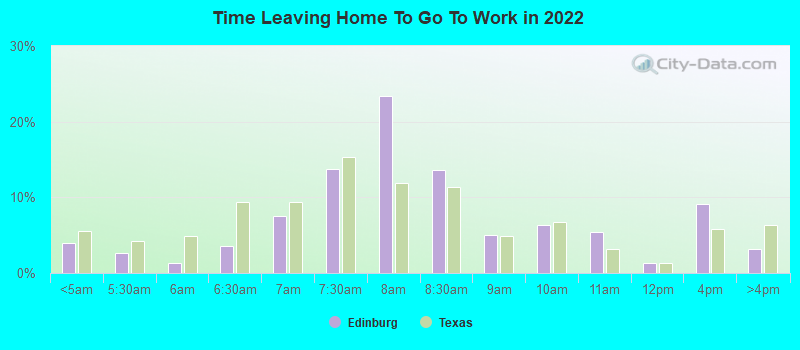
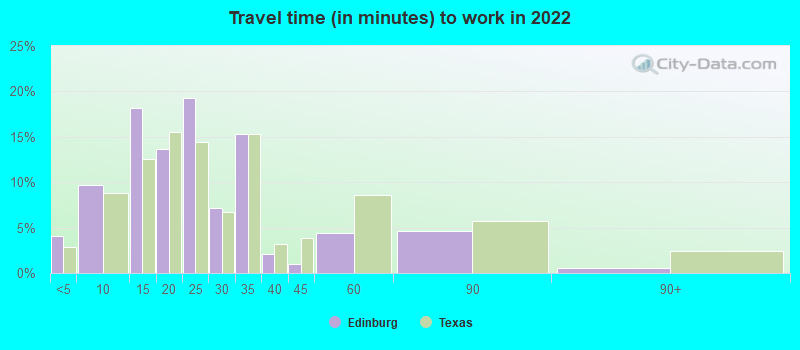
Travel time to work (commute)
Less than 5 minutes: 1,8755 to 9 minutes: 4,75510 to 14 minutes: 5,61115 to 19 minutes: 7,67220 to 24 minutes: 3,73025 to 29 minutes: 2,21530 to 34 minutes: 5,36435 to 39 minutes: 9740 to 44 minutes: 9745 to 59 minutes: 1,65760 to 89 minutes: 1,59990 or more minutes: 1,947
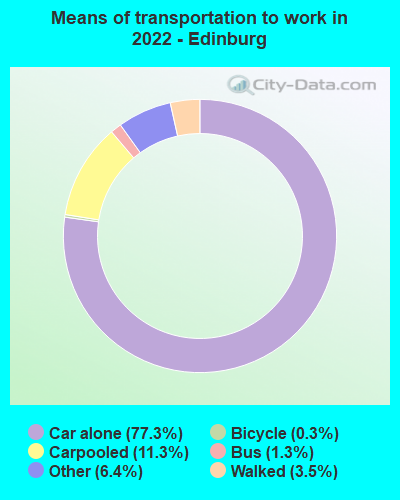
Means of transportation to work:
Drove a car alone: 35,126 (71.5%)Carpooled: 5,141 (10.5%)Bus : 594 (1.2%)Taxi: 2,894 (5.9%)Bicycle: 129 (0.3%)Walked: 1,581 (3.2%)Worked at home: 3,679 (7.5%)
Unemployment by race in 2022
Unemployment rate for White non-Hispanic residents 0.8% Males9.0% FemalesUnemployment rate for Black residents 7.9% Males1.8% FemalesUnemployment rate for American Indian and Alaska Native residents 31.8% MalesUnemployment rate for Asian residents 1.7% FemalesUnemployment rate for other race residents 9.0% MalesUnemployment rate for two or more race residents 11.5% Males4.5% FemalesUnemployment rate for Hispanic or Latino residents 13.3% Males3.5% Females
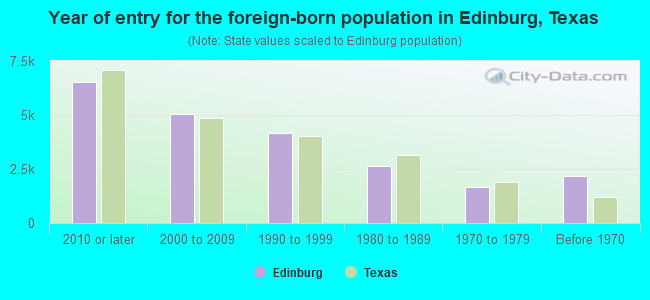
Year of entry for the foreign-born population in Edinburg, Texas
6,528 2010 or later 5,035 2000 to 2009 4,172 1990 to 1999 2,653 1980 to 1989 1,674 1970 to 1979 2,174 Before 1970
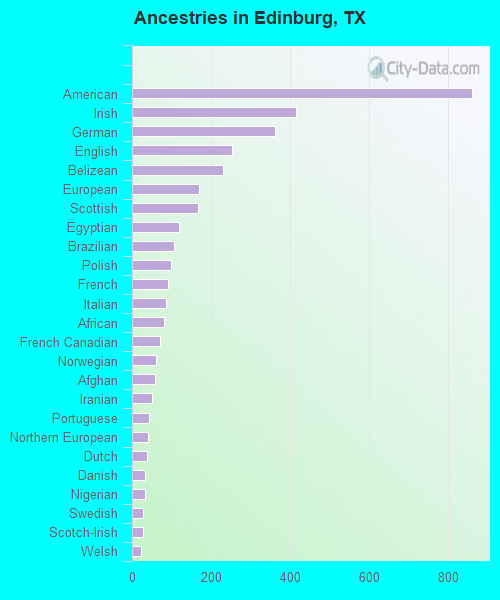
First ancestries reported:
American: 861 (1.1%)
Irish: 416 (0.5%)
German: 361 (0.4%)
English: 253 (0.3%)
Belizean: 231 (0.3%)
European: 170 (0.2%)
Scottish: 168 (0.2%)
Egyptian: 119 (0.1%)
Brazilian: 106 (0.1%)
Polish: 99 (0.1%)
French: 91 (0.1%)
Italian: 86 (0.1%)
African: 80 (0.10%)
French Canadian: 72 (0.09%)
Norwegian: 60 (0.07%)
Afghan: 58 (0.07%)
Iranian: 50 (0.06%)
Portuguese: 42 (0.05%)
Northern European: 41 (0.05%)
Dutch: 37 (0.05%)
Danish: 34 (0.04%)
Nigerian: 32 (0.04%)
Swedish: 28 (0.03%)
Scotch-Irish: 27 (0.03%)
Welsh: 22 (0.03%)
Canadian: 15 (0.02%)
Czech: 12 (0.01%) Most common places of birth for foreign-born residents (%): Mexico Edinburg:
78.4% (16,565)Texas:
48.4% (2,411,723)
Philippines Edinburg:
3.4% (726)Texas:
2.1% (103,148)
India Edinburg:
2.8% (582)Texas:
6.1% (306,347)
Place of birth for U.S.-born residents:
This state: 71,525Other state: 10,009Northeast: 627Midwest: 4,177South: 2,190West: 3,015 85.3% of Edinburg residents lived in the same house 1 years ago.
Out of people who lived in different houses, 41.8% lived in this county.
Out of people who lived in different counties, 90.9% lived in Texas.
Edinburg:
85.3%State average:
85.7%
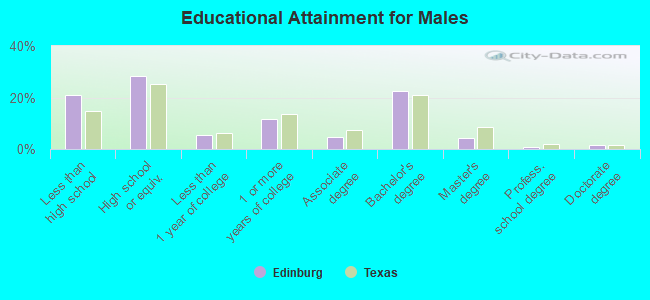
Education attainment for males 25 years and older:
No schooling: 577Nursery to 4th grade: 7325th and 6th grade: 9177th and 8th grade: 1,5659th grade: 62310th grade: 37311th grade: 1,17912th grade, no diploma: 314High school graduate (or equivalency): 8,419Less than 1 year of college: 1,637Some college more than 1 year, no degree: 3,461Associate degree: 1,378Bachelor's degree: 6,710Master's degree: 1,239Professional school degree: 203Doctorate degree: 482
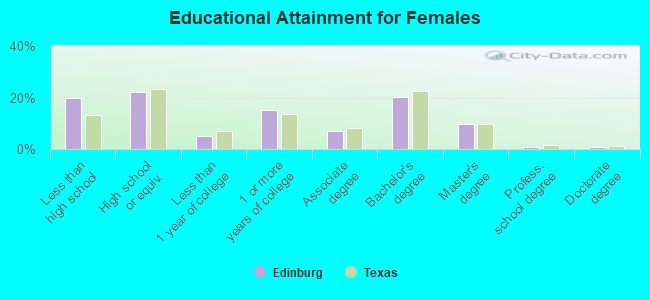
Education attainment for females 25 years and older:
No schooling: 346Nursery to 4th grade: 2925th and 6th grade: 1,4197th and 8th grade: 1,4319th grade: 84310th grade: 79511th grade: 17312th grade, no diploma: 363High school graduate (or equivalency): 6,364Less than 1 year of college: 1,406Some college more than 1 year, no degree: 4,320Associate degree: 1,953Bachelor's degree: 5,762Master's degree: 2,799Professional school degree: 178Doctorate degree: 245
Housing units in structures:
One, detached: 20,328One, attached: 465Two: 3,1273 or 4: 2,5915 to 9: 1,76610 to 19: 3,00620 to 49: 94650 or more: 917Mobile homes: 1,877Median worth of mobile homes: $63,000
Housing units lacking complete plumbing facilities in 2022: 1.7%Housing units lacking complete kitchen facilities in 2022: 0.1%House/condo owner moved in on average 9 years ago
Renter moved in on average 2 years ago
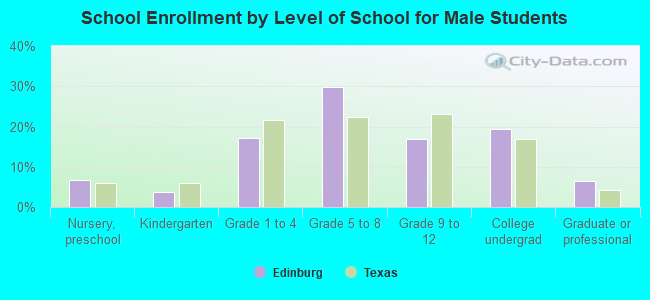
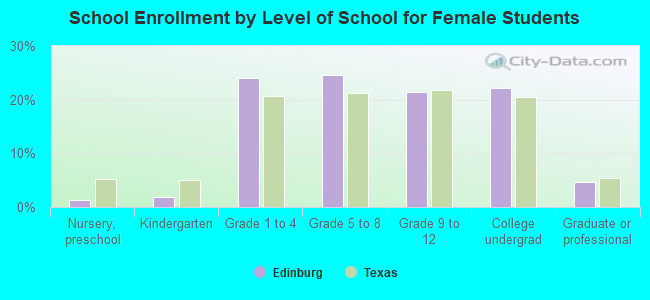
Private vs. public school enrollment:
Students in private schools in grades 1 to 8 (elementary and middle school): 238 Students in private schools in grades 9 to 12 (high school): 42 Students in private undergraduate colleges: 3,787