Housing density: 1,373 houses/condos per square mile
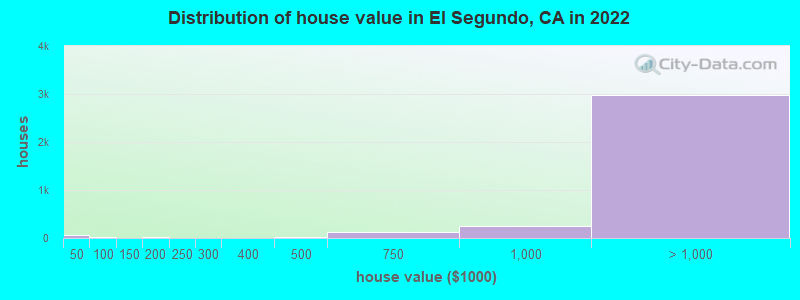
Median price asked for vacant for-sale houses and condos in 2022 in this county: $1,291,802.
Median contract rent in 2022: over $2,000 (lower quartile is $1,867, upper quartile is over $2,000)
Median rent asked for vacant for-rent units in 2022: $2,956
Median gross rent in El Segundo, CA in 2022: over $2,000
Housing units in El Segundo with a mortgage: 2,242 (282 second mortgage, 0 home equity loan, 268 both second mortgage and home equity loan) Houses without a mortgage: 67
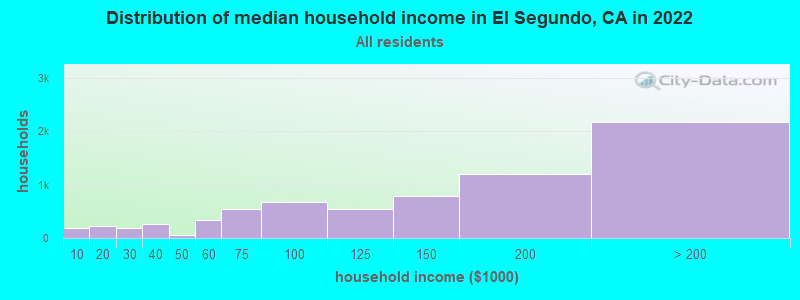
Median household income for houses/condos with a mortgage: $184,951
Median household income for apartments without a mortgage: $82,429
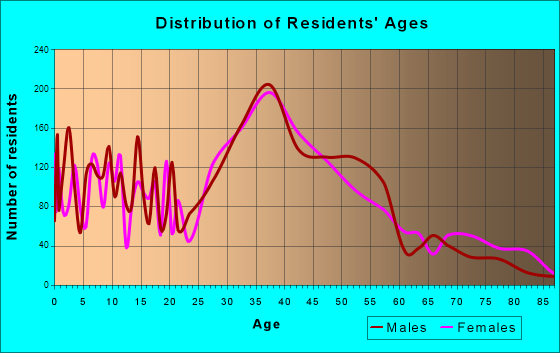
2,606 married couples with children.
572 single-parent households (280 men, 292 women).
86.1% of residents of El Segundo speak English at home.
7.0% of residents speak Spanish at home (85% speak English very well, 8% speak English well, 7% speak English not well).
4.0% of residents speak other Indo-European language at home (70% speak English very well, 29% speak English well, 1% speak English not well).
3.3% of residents speak Asian or Pacific Island language at home (74% speak English very well, 20% speak English well, 3% speak English not well, 3% don't speak English at all).
0.5% of residents speak other language at home (93% speak English very well, 7% speak English well).
Foreign born population: 1,996 (11.9%)
(63.5% of them are naturalized citizens)
Percentage of workers working in this county: 96.9% Number of people working at home: 2,786 (28.3% of all workers)
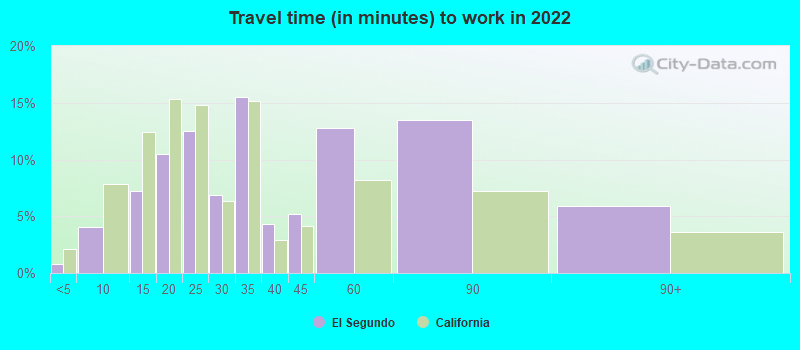
Travel time to work (commute)
Less than 5 minutes: 165
5 to 9 minutes: 1,063
10 to 14 minutes: 1,535
15 to 19 minutes: 1,070
20 to 24 minutes: 709
25 to 29 minutes: 382
30 to 34 minutes: 846
35 to 39 minutes: 119
40 to 44 minutes: 342
45 to 59 minutes: 660
60 to 89 minutes: 426
90 or more minutes: 115
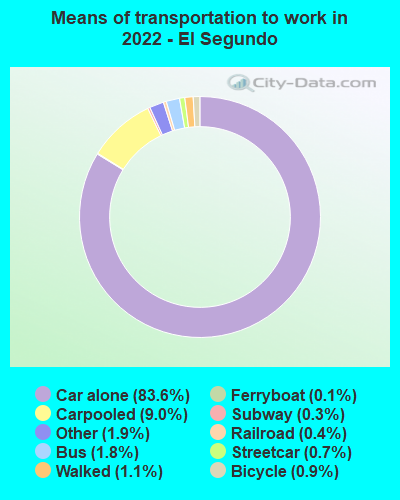
Means of transportation to work:
Drove a car alone: 45,291 (76.4%)
Carpooled: 5,417 (9.1%)
Bus: 877 (1.5%)
Subway or elevated rail: 288 (0.5%)
Long-distance train or commuter rail: 116 (0.2%)
Light rail, streetcar or trolley: 129 (0.2%)
Ferryboat: 50 (0.1%)
Taxi: 1,152 (1.9%)
Bicycle: 527 (0.9%)
Walked: 648 (1.1%)
Worked at home: 2,786 (4.7%)
Unemployment by race in 2022
Unemployment rate for White non-Hispanic residents
4.2%Males
4.1%Females
Unemployment rate for Black residents
18.9%Females
Unemployment rate for Asian residents
5.9%Males
7.5%Females
Unemployment rate for other race residents
10.7%Females
Unemployment rate for two or more race residents
3.1%Males
0.6%Females
Unemployment rate for Hispanic or Latino residents
3.0%Males
5.6%Females
Year of entry for the foreign-born population in El Segundo, California
5662010 or later
3722000 to 2009
4091990 to 1999
5811980 to 1989
3431970 to 1979
423Before 1970
First ancestries reported:
English: 500 (7.2%)
Italian: 494 (7.1%)
European: 441 (6.3%)
German: 405 (5.8%)
American: 365 (5.2%)
Irish: 356 (5.1%)
Russian: 194 (2.8%)
Iranian: 126 (1.8%)
Norwegian: 66 (0.9%)
Scottish: 60 (0.9%)
Northern European: 39 (0.6%)
Romanian: 30 (0.4%)
French: 29 (0.4%)
Welsh: 28 (0.4%)
British: 27 (0.4%)
Portuguese: 23 (0.3%)
Swedish: 22 (0.3%)
New Zealander: 21 (0.3%)
Kenyan: 21 (0.3%)
Polish: 20 (0.3%)
Hungarian: 19 (0.3%)
Canadian: 18 (0.3%)
Turkish: 17 (0.2%)
Greek: 16 (0.2%)
Arab: 15 (0.2%)
Lithuanian: 14 (0.2%)
Slovene: 14 (0.2%)
Scotch-Irish: 12 (0.2%)
Lebanese: 11 (0.2%)
Scandinavian: 11 (0.2%)
Jordanian: 10 (0.1%)
Eastern European: 8 (0.1%)
Dutch: 6 (0.09%)
Brazilian: 4 (0.06%)
Swiss: 1 (0.01%)
Most common places of birth for foreign-born residents (%):
Philippines
El Segundo:
12.1% (241)
California:
7.8% (818,297)
India
El Segundo:
12.1% (241)
California:
5.2% (539,184)
Mexico
El Segundo:
12.1% (241)
California:
37.2% (3,881,193)
England
El Segundo:
5.7% (114)
California:
0.6% (57,953)
Russia
El Segundo:
4.5% (90)
California:
0.7% (71,932)
Canada
El Segundo:
4.3% (86)
California:
1.2% (127,477)
Taiwan
El Segundo:
3.9% (78)
California:
1.7% (176,274)
Ecuador
El Segundo:
3.9% (78)
California:
0.2% (21,276)
China, excluding Hong Kong and Taiwan
El Segundo:
3.2% (63)
California:
6.6% (684,672)
Japan
El Segundo:
3.0% (60)
California:
1.0% (103,575)
Iran
El Segundo:
2.9% (58)
California:
2.0% (206,004)
Brazil
El Segundo:
2.8% (56)
California:
0.5% (53,222)
Serbia
El Segundo:
2.4% (48)
California:
0.0% (4,595)
United Kingdom, excluding England and Scotland
El Segundo:
2.2% (44)
California:
0.6% (60,582)
Germany
El Segundo:
2.2% (43)
California:
0.7% (73,304)
Hong Kong
El Segundo:
2.0% (39)
California:
1.0% (105,215)
Colombia
El Segundo:
2.0% (39)
California:
0.5% (55,249)
Italy
El Segundo:
1.9% (37)
California:
0.3% (31,439)
El Salvador
El Segundo:
1.8% (36)
California:
4.2% (440,287)
Singapore
El Segundo:
1.8% (35)
California:
0.1% (10,213)
Turkey
El Segundo:
1.7% (34)
California:
0.2% (20,474)
Thailand
El Segundo:
1.6% (31)
California:
0.6% (65,335)
Place of birth for U.S.-born residents:
This state: 10,386
Other state: 3,944
Northeast: 1,319
Midwest: 1,272
South: 708
West: 631
83.8% of El Segundo residents lived in the same house 1 years ago. Out of people who lived in different houses, 43.2% lived in this county. Out of people who lived in different counties, 47.3% lived in California.
El Segundo:
83.8%
State average:
88.9%
Education attainment for males 25 years and older:
No schooling: 29
Nursery to 4th grade: 0
5th and 6th grade: 6
7th and 8th grade: 0
9th grade: 0
10th grade: 0
11th grade: 1
12th grade, no diploma: 18
High school graduate (or equivalency): 775
Less than 1 year of college: 305
Some college more than 1 year, no degree: 849
Associate degree: 556
Bachelor's degree: 2,247
Master's degree: 1,187
Professional school degree: 333
Doctorate degree: 101
Education attainment for females 25 years and older:
No schooling: 31
Nursery to 4th grade: 9
5th and 6th grade: 6
7th and 8th grade: 10
9th grade: 0
10th grade: 58
11th grade: 15
12th grade, no diploma: 27
High school graduate (or equivalency): 488
Less than 1 year of college: 283
Some college more than 1 year, no degree: 836
Associate degree: 435
Bachelor's degree: 2,502
Master's degree: 1,175
Professional school degree: 279
Doctorate degree: 96
Housing units in structures:
One, detached: 3,221
One, attached: 436
Two: 299
3 or 4: 863
5 to 9: 1,379
10 to 19: 584
20 to 49: 533
50 or more: 289
Housing units lacking complete plumbing facilities in 2022: 0.5%
Housing units lacking complete kitchen facilities in 2022: 2.1%
House/condo owner moved in on average 17 years ago