Enterprise, NV (Nevada) Houses and Residents
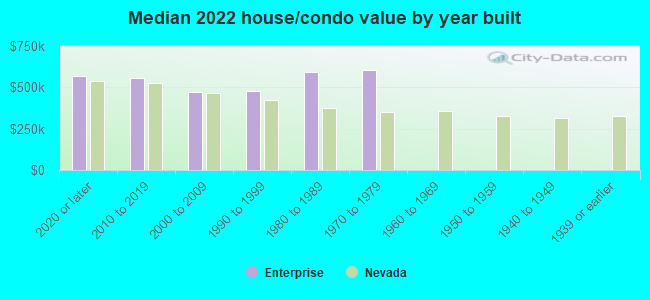
| Enterprise: | $497,500 |
| Nevada: | $434,700 |
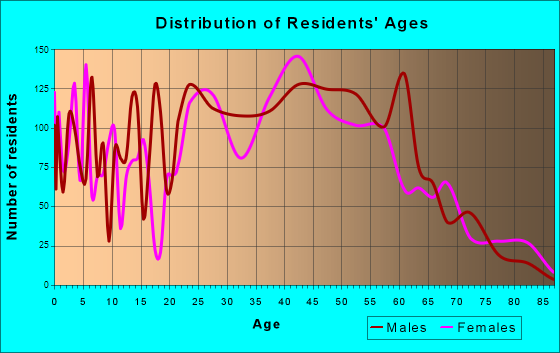
Total population: 108,481 (Urban population: 12,503, Rural population: 1,934 (all nonfarm))
Houses: 92,009 (83,441 occupied: 52,315 owner occupied, 31,126 renter occupied)
| % of renters here: | 37% |
| State: | 40% |
Housing density: 1,893 houses/condos per square mile
Median price asked for vacant for-sale houses and condos in 2022: $855,214.
Median contract rent in 2022: $1,632 (lower quartile is $1,321, upper quartile is $1,932)
Median rent asked for vacant for-rent units in 2022: $1,395
Median gross rent in Enterprise, NV in 2022: $1,796
Housing units in Enterprise with a mortgage: 40,306 (1,977 second mortgage, 118 home equity loan, 1,314 both second mortgage and home equity loan)
Houses without a mortgage: 350
Median household income for houses/condos with a mortgage: $110,372
Median household income for apartments without a mortgage: $69,988
Median monthly housing costs: $1,715
Compare current foreclosures near Enterprise, NV:
| Photo | Address | Area | Beds / Baths | Price | Details |
|---|---|---|---|---|---|

|
#1
Brentcove Dr
North Las Vegas, NV 89032
|
1,852 sq. feet
|
2 baths 3 beds |
$361,500
|
show details |

|
#2
Vida Pacifica St
Las Vegas, NV 89115
|
1,621 sq. feet
|
2 baths 4 beds |
$357,000
|
show details |

|
#3
Freedom Ave
Las Vegas, NV 89121
|
2,025 sq. feet
|
3 baths 2 beds |
$305,000
|
show details |

|
#4
Oro Silver Ct
Las Vegas, NV 89178
|
1,400 sq. feet
|
2 baths 2 beds |
$385,000
|
show details |

|
#5
Cape Verde Ln
Las Vegas, NV 89128
|
1,857 sq. feet
|
2 baths 4 beds |
$484,900
|
show details |

|
#6
S Valley View Blvd Unit 1050
Las Vegas, NV 89103
|
496 sq. feet
|
1 baths 1 beds |
show details | |

|
#7
Sheer Paradise Ln Unit 1
Henderson, NV 89002
|
1,182 sq. feet
|
2 baths 2 beds |
show details | |

|
#8
Red Gable Ln
Las Vegas, NV 89144
|
1,263 sq. feet
|
2 baths 2 beds |
show details | |

|
#9
Bel Air Dr Unit 24g
Las Vegas, NV 89109
|
2,208 sq. feet
|
3 baths 2 beds |
show details | |

|
#10
W Carey Ave
North Las Vegas, NV 89030
|
1,320 sq. feet
|
1 baths 4 beds |
show details |
| Photo | Address | Area | Beds / Baths | Price | Details |
|---|---|---|---|---|---|

|
#11
Meadow Foxtail Dr
Las Vegas, NV 89122
|
1,601 sq. feet
|
2 baths 2 beds |
show details | |

|
#12
Jasmine Falls Dr
Las Vegas, NV 89179
|
1,685 sq. feet
|
3 baths 3 beds |
show details | |

|
#13
Bristol Way
Las Vegas, NV 89107
|
1,180 sq. feet
|
2 baths 3 beds |
show details | |

|
#14
Woodridge Dr
Henderson, NV 89015
|
1,389 sq. feet
|
2 baths 3 beds |
show details | |

|
#15
Mountain View Dr
Las Vegas, NV 89146
|
1,552 sq. feet
|
2 baths 3 beds |
show details | |

|
#16
Crown Imperial St
Henderson, NV 89074
|
1,186 sq. feet
|
2 baths 2 beds |
show details | |

|
#17
Blanton Dr
Las Vegas, NV 89122
|
1,301 sq. feet
|
2 baths 3 beds |
show details | |

|
#18
High Valley Ct Unit 105
Las Vegas, NV 89128
|
1,008 sq. feet
|
2 baths 2 beds |
show details | |

|
#19
Franklin Ave
Las Vegas, NV 89104
|
1,247 sq. feet
|
2 baths 3 beds |
show details | |

|
#20
Villa Knolls South Dr
Las Vegas, NV 89120
|
1,012 sq. feet
|
2 baths 3 beds |
show details |
| Photo | Address | Area | Beds / Baths | Price | Details |
|---|---|---|---|---|---|

|
#21
Clackamas Ct
Las Vegas, NV 89122
|
- sq. feet
|
1 baths 2 beds |
show details | |

|
#22
N Buffalo Dr Apt 102
Las Vegas, NV 89128
|
912 sq. feet
|
2 baths 2 beds |
show details | |

|
#23
Legato Falls St
Las Vegas, NV 89115
|
1,740 sq. feet
|
3 baths 3 beds |
show details | |

|
#24
Skyforest Dr
Henderson, NV 89011
|
1,733 sq. feet
|
3 baths 3 beds |
show details | |

|
#25
Osceola Mills St
Las Vegas, NV 89141
|
3,976 sq. feet
|
4 baths 6 beds |
show details | |

|
#26
Balsam Mist Ave
Las Vegas, NV 89183
|
- sq. feet
|
2 baths 4 beds |
show details | |

|
#27
Galliano Ave
Las Vegas, NV 89117
|
2,917 sq. feet
|
4 baths 4 beds |
show details | |

|
#28
W Warm Springs Rd Unit 2161
Las Vegas, NV 89148
|
972 sq. feet
|
2 baths 2 beds |
show details | |

|
#29
Yellow Harbor St
Las Vegas, NV 89129
|
2,480 sq. feet
|
3 baths 4 beds |
show details | |

|
#30
Lanai Ave
Las Vegas, NV 89104
|
1,583 sq. feet
|
1 baths 4 beds |
show details |
| Photo | Address | Area | Beds / Baths | Price | Details |
|---|---|---|---|---|---|

|
#31
Wengert Ave
Las Vegas, NV 89104
|
903 sq. feet
|
1 baths 2 beds |
show details | |

|
#32
Blue Rose St
North Las Vegas, NV 89081
|
1,647 sq. feet
|
2 baths 4 beds |
show details | |

|
#33
Betty Davis St
Las Vegas, NV 89142
|
1,418 sq. feet
|
2 baths 3 beds |
show details | |

|
#34
E Cleveland Ave
Las Vegas, NV 89104
|
2,136 sq. feet
|
2 baths 5 beds |
show details | |

|
#35
W Flamingo Rd Unit 2033
Las Vegas, NV 89147
|
1,023 sq. feet
|
2 baths 2 beds |
show details | |

|
#36
Colored Wind Ave
Las Vegas, NV 89148
|
1,672 sq. feet
|
2 baths 4 beds |
show details | |

|
#37
Alpine Bliss St
Las Vegas, NV 89123
|
1,562 sq. feet
|
2 baths 2 beds |
show details | |

|
#38
Dundock Ave
Las Vegas, NV 89122
|
2,474 sq. feet
|
4 baths 5 beds |
show details | |

|
#39
Gannett Peak St
Henderson, NV 89012
|
2,366 sq. feet
|
2 baths 4 beds |
show details | |

|
#40
Grand Prairie Ave
North Las Vegas, NV 89032
|
1,152 sq. feet
|
2 baths 3 beds |
show details |
| Photo | Address | Area | Beds / Baths | Price | Details |
|---|---|---|---|---|---|

|
#41
Heritage Ct
Las Vegas, NV 89121
|
- sq. feet
|
2 baths 4 beds |
show details | |

|
#42
Grand Prairie Ave
North Las Vegas, NV 89032
|
1,152 sq. feet
|
2 baths 3 beds |
show details | |

|
#43
Flora Spray St
Las Vegas, NV 89130
|
2,219 sq. feet
|
3 baths 5 beds |
show details | |

|
#44
Gulls Perch Dr
Las Vegas, NV 89128
|
2,084 sq. feet
|
2 baths 4 beds |
show details | |

|
#45
English Oak St
Las Vegas, NV 89117
|
3,569 sq. feet
|
2 baths 4 beds |
show details | |

|
#46
Blue Nile Ct
Las Vegas, NV 89144
|
2,640 sq. feet
|
3 baths 3 beds |
show details | |

|
#47
Juniper Twig Ave
Las Vegas, NV 89183
|
2,657 sq. feet
|
2 baths 4 beds |
show details | |

|
#48
Figtree Rd
Las Vegas, NV 89108
|
1,339 sq. feet
|
2 baths 3 beds |
show details | |

|
#49
W Oquendo Rd
Las Vegas, NV 89118
|
5,451 sq. feet
|
5 baths 7 beds |
show details | |

|
Check over 1 million property listings on Foreclosure.com!
|
browse all offers | |||

Latest news about housing in Enterprise, NV collected exclusively by city-data.com from local newspapers, TV, and radio stations

 | Temporary Housing and Buying a House (82 replies) |
| Back again..Best Area to Rent a SFHhome for $1600? (66 replies) |
| Rental inflation (219 replies) |
| Furnished 55+ apartment rental (14 replies) |
| Is car rental required? (35 replies) |
| Renting a House in Summerlin Area (9 replies) |
Median year apartment built: 2006
Household type by relationship:
Households: 231,446- Male householders: 48,146 (10,626 living alone), Female householders: 35,295 (7,218 living alone)
43,605 spouses (42,244 opposite-sex spouses), 7,157 unmarried partners, (6,792 opposite-sex unmarried partners), 65,921 children (59,305 natural, 1,396 adopted, 5,220 stepchildren), 3,297 grandchildren, 4,618 brothers or sisters, 7,758 parents, 209 foster children, 6,182 other relatives, 9,208 non-relatives
- In group quarters: 50
Size of family households: 21,449 2-persons, 14,576 3-persons, 14,268 4-persons, 5,394 5-persons, 1,970 6-persons, 795 7-or-more-persons.
Size of nonfamily households: 17,844 1-person, 6,471 2-persons, 540 3-persons, 134 4-persons.
31,878 married couples with children.
11,147 single-parent households (3,604 men, 7,543 women).
66.6% of residents of Enterprise speak English at home.
11.3% of residents speak Spanish at home (75% speak English very well, 13% speak English well, 9% speak English not well, 3% don't speak English at all).
3.8% of residents speak other Indo-European language at home (64% speak English very well, 24% speak English well, 9% speak English not well, 2% don't speak English at all).
15.6% of residents speak Asian or Pacific Island language at home (63% speak English very well, 26% speak English well, 9% speak English not well, 2% don't speak English at all).
2.4% of residents speak other language at home (63% speak English very well, 28% speak English well, 6% speak English not well, 3% don't speak English at all).
Foreign born population: 57,167 (24.7%)
(70.6% of them are naturalized citizens)
| Here: | 6.3 |
| State: | 6.0 |
| Here: | 4.7 |
| State: | 4.2 |
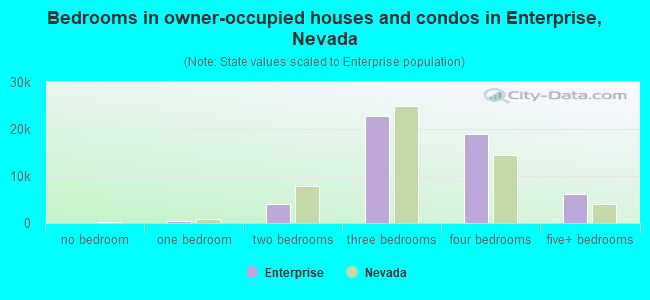
- Bedrooms in owner-occupied houses and condos in Enterprise, Nevada
- 35no bedroom
- 3811 bedroom
- 4,0682 bedrooms
- 22,6603 bedrooms
- 18,9554 bedrooms
- 6,2165+ bedrooms
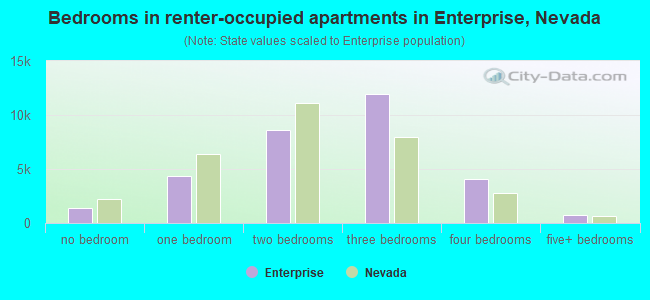
- Bedrooms in renter-occupied apartments in Enterprise, Nevada
- 1,430no bedroom
- 4,3651 bedroom
- 8,5792 bedrooms
- 11,9013 bedrooms
- 4,1114 bedrooms
- 7405+ bedrooms
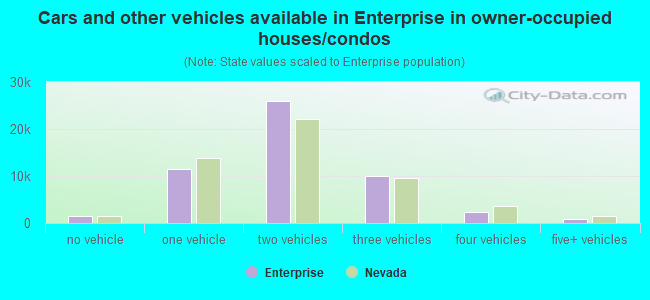
- Cars and other vehicles available in Enterprise in owner-occupied houses/condos
- 1,527no vehicle
- 11,5261 vehicle
- 26,0532 vehicles
- 10,0793 vehicles
- 2,2534 vehicles
- 8775+ vehicles
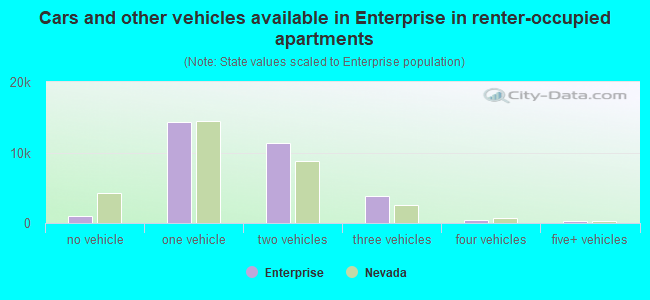
- Cars and other vehicles available in Enterprise in renter-occupied apartments
- 1,031no vehicle
- 14,3041 vehicle
- 11,3482 vehicles
- 3,7633 vehicles
- 3564 vehicles
- 3245+ vehicles
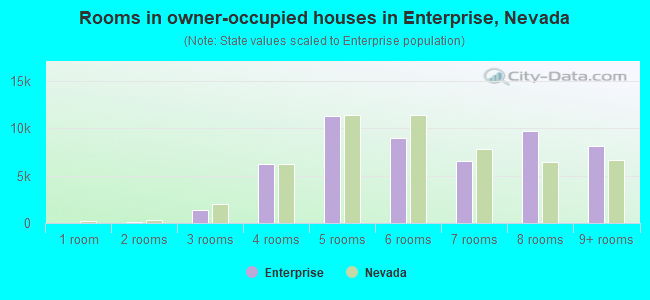
- Rooms in owner-occupied houses in Enterprise, Nevada
- 01 room
- 882 rooms
- 1,3273 rooms
- 6,1724 rooms
- 11,3215 rooms
- 8,9986 rooms
- 6,5727 rooms
- 9,7518 rooms
- 8,0869+ rooms
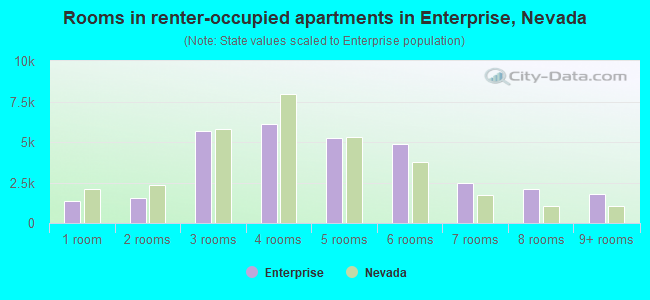
- Rooms in renter-occupied apartments in Enterprise, Nevada
- 1,3361 room
- 1,5412 rooms
- 5,6793 rooms
- 6,0954 rooms
- 5,2305 rooms
- 4,8516 rooms
- 2,4947 rooms
- 2,1098 rooms
- 1,7919+ rooms
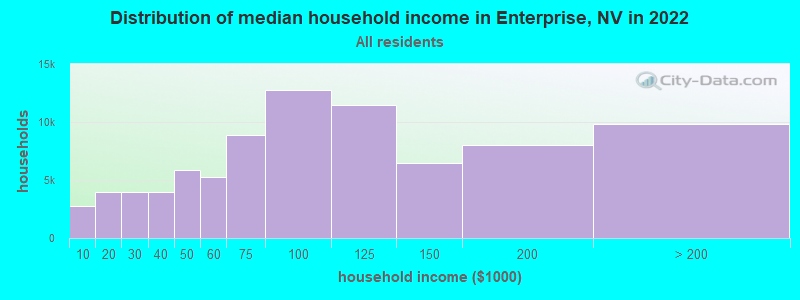
Enterprise, NV household income distribution

- 2,798Less than $10,000
- 3,957$10,000 to $19,999
- 4,001$20,000 to $29,999
- 3,987$30,000 to $39,999
- 5,856$40,000 to $49,999
- 5,297$50,000 to $59,999
- 8,916$60,000 to $74,999
- 12,768$75,000 to $99,999
- 11,460$100,000 to $124,999
- 6,494$125,000 to $149,999
- 8,054$150,000 to $199,999
- 9,853$200,000 or more
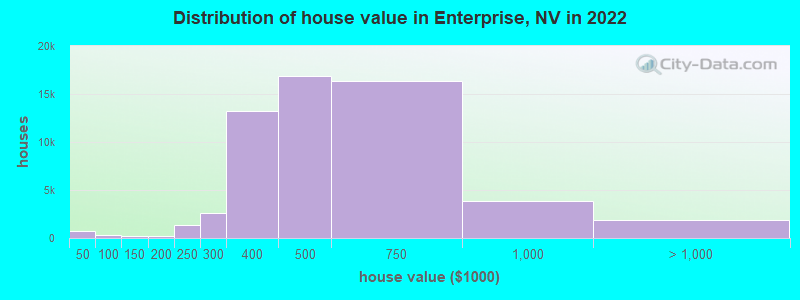
Home value of owner - occupied houses in 2022 in Enterprise, NV
-
- 355Less than $10,000
- 20$10,000 to $14,999
- 53$15,000 to $19,999
- 19$20,000 to $24,999
- 37$25,000 to $29,999
- 33$30,000 to $34,999
- 83$35,000 to $39,999
- 155$40,000 to $49,999
- 39$50,000 to $59,999
- 30$60,000 to $69,999
- 34$80,000 to $89,999
- 35$90,000 to $99,999
- 181$100,000 to $124,999
- 53$125,000 to $149,999
- 108$150,000 to $174,999
- 136$175,000 to $199,999
- 1,399$200,000 to $249,999
- 2,579$250,000 to $299,999
- 13,242$300,000 to $399,999
- 16,882$400,000 to $499,999
- 16,330$500,000 to $749,999
- 3,811$750,000 to $999,999
- 1,191$1,000,000 to $1,499,999
- 203$1,500,000 to $1,999,999
- 440$2,000,000 or more
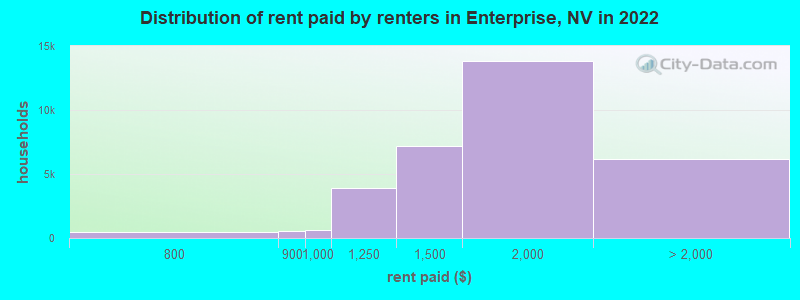
Rent paid by renters in 2022 in Enterprise, NV
-
- 31Less than $100
- 24$350 to $399
- 57$500 to $549
- 43$550 to $599
- 15$600 to $649
- 27$650 to $699
- 375$700 to $749
- 92$750 to $799
- 527$800 to $899
- 586$900 to $999
- 3,924$1,000 to $1,249
- 7,202$1,250 to $1,499
- 13,849$1,500 to $1,999
- 4,001$2,000 to $2,499
- 1,111$2,500 to $2,999
- 186$3,000 to $3,499
- 111$3,500 or more
- 798No cash rent
Percentage of workers working in this county: 98.7%
Number of people working at home: 16,958 (13.6% of all workers)
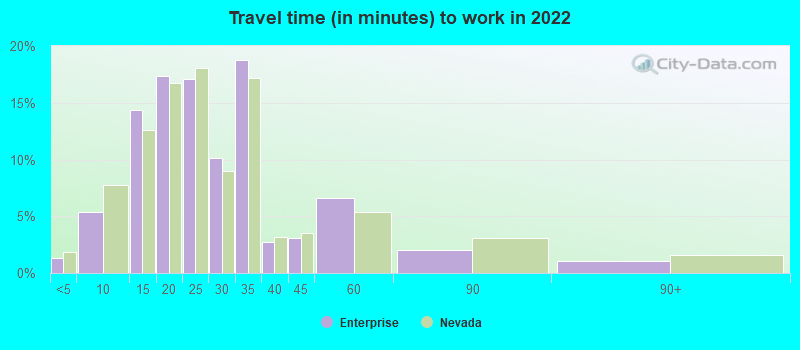
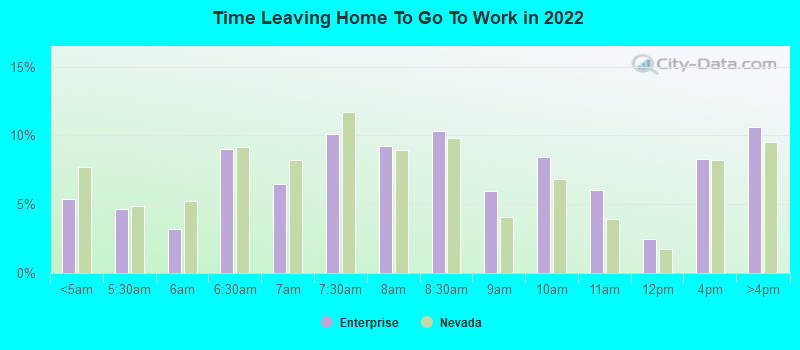
Travel time to work (commute)
- Less than 5 minutes: 1,000
- 5 to 9 minutes: 5,712
- 10 to 14 minutes: 12,524
- 15 to 19 minutes: 20,710
- 20 to 24 minutes: 27,894
- 25 to 29 minutes: 9,704
- 30 to 34 minutes: 19,901
- 35 to 39 minutes: 1,758
- 40 to 44 minutes: 2,187
- 45 to 59 minutes: 3,656
- 60 to 89 minutes: 1,312
- 90 or more minutes: 1,321
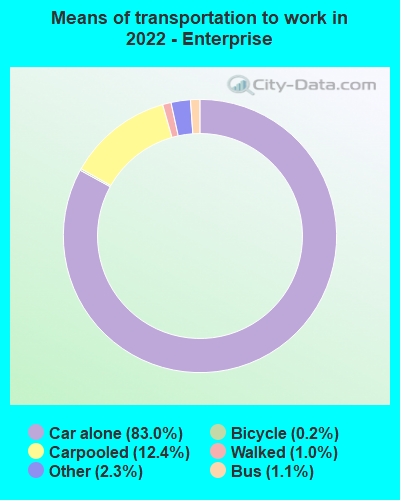
Means of transportation to work:
- Drove a car alone: 37,808 (61.8%)
- Carpooled: 6,129 (10.0%)
- Bus: 493 (0.8%)
- Taxi: 1,176 (1.9%)
- Bicycle: 130 (0.2%)
- Walked: 489 (0.8%)
- Worked at home: 18,359 (30.0%)
- Unemployment by race in 2022
- Unemployment rate for White non-Hispanic residents
- 3.3%Males
- 4.5%Females
- Unemployment rate for Black residents
- 23.7%Females
- Unemployment rate for American Indian and Alaska Native residents
- 4.5%Males
- 19.3%Females
- Unemployment rate for Asian residents
- 3.4%Males
- 4.4%Females
- Unemployment rate for other race residents
- 4.7%Males
- 4.6%Females
- Unemployment rate for two or more race residents
- 4.7%Males
- 4.2%Females
- Unemployment rate for Hispanic or Latino residents
- 5.2%Males
- 7.1%Females
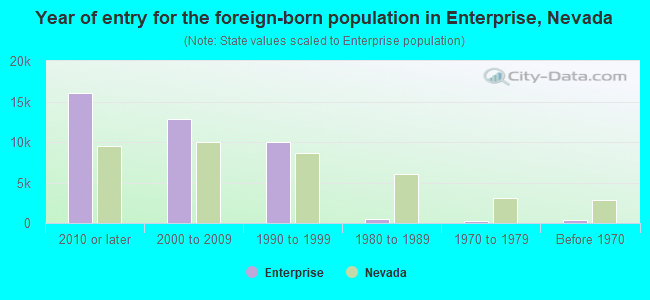
- Year of entry for the foreign-born population in Enterprise, Nevada
- 16,0542010 or later
- 12,8912000 to 2009
- 10,0521990 to 1999
- 5171980 to 1989
- 2301970 to 1979
- 365Before 1970
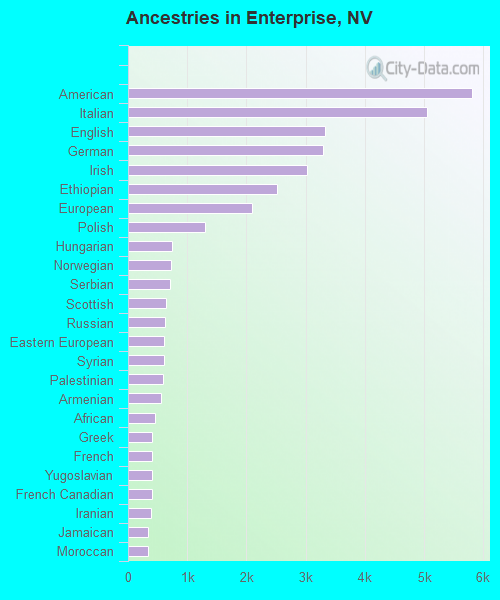
First ancestries reported:
- American: 5,803 (4.5%)
- Italian: 5,047 (4.0%)
- English: 3,320 (2.6%)
- German: 3,290 (2.6%)
- Irish: 3,015 (2.4%)
- Ethiopian: 2,507 (2.0%)
- European: 2,088 (1.6%)
- Polish: 1,308 (1.0%)
- Hungarian: 741 (0.6%)
- Norwegian: 728 (0.6%)
- Serbian: 708 (0.6%)
- Scottish: 633 (0.5%)
- Russian: 623 (0.5%)
- Eastern European: 608 (0.5%)
- Syrian: 608 (0.5%)
- Palestinian: 596 (0.5%)
- Armenian: 563 (0.4%)
- African: 448 (0.4%)
- Greek: 411 (0.3%)
- French: 408 (0.3%)
- Yugoslavian: 405 (0.3%)
- French Canadian: 402 (0.3%)
- Iranian: 383 (0.3%)
- Jamaican: 335 (0.3%)
- Moroccan: 334 (0.3%)
- Ukrainian: 331 (0.3%)
- Portuguese: 275 (0.2%)
- Scotch-Irish: 261 (0.2%)
- Danish: 244 (0.2%)
- Turkish: 234 (0.2%)
- Swedish: 215 (0.2%)
- Lebanese: 210 (0.2%)
- West Indian: 209 (0.2%)
- Dutch: 198 (0.2%)
- Nigerian: 188 (0.1%)
- British: 175 (0.1%)
- Romanian: 174 (0.1%)
- Canadian: 170 (0.1%)
- Brazilian: 151 (0.1%)
- Scandinavian: 133 (0.1%)
- Latvian: 128 (0.1%)
- Czech: 121 (0.09%)
- Trinidadian and Tobagonian: 115 (0.09%)
- Haitian: 102 (0.08%)
- Lithuanian: 97 (0.08%)
- Northern European: 94 (0.07%)
- Swiss: 94 (0.07%)
- Australian: 87 (0.07%)
- Croatian: 86 (0.07%)
- Bulgarian: 86 (0.07%)
- Austrian: 80 (0.06%)
- Afghan: 78 (0.06%)
- Slovene: 68 (0.05%)
- Egyptian: 65 (0.05%)
- Slavic: 56 (0.04%)
- Welsh: 56 (0.04%)
- Basque: 50 (0.04%)
- Arab: 44 (0.03%)
- South African: 35 (0.03%)
- Kenyan: 31 (0.02%)
- Icelander: 29 (0.02%)
- Iraqi: 27 (0.02%)
- Barbadian: 26 (0.02%)
- Finnish: 22 (0.02%)
- Guyanese: 21 (0.02%)
- Ghanaian: 18 (0.01%)
- Maltese: 15 (0.01%)
- Czechoslovakian: 15 (0.01%)
- Sierra Leonean: 11 (0.01%)
- Assyrian: 11 (0.01%)
- Belizean: 10 (0.01%)
- German Russian: 9 (0.01%)
- Albanian: 7 (0.01%)
- Celtic: 7 (0.01%)
Most common places of birth for foreign-born residents (%):
| Enterprise: | 34.4% (18,789) |
| Nevada: | 15.5% (91,628) |
| Enterprise: | 11.5% (6,308) |
| Nevada: | 36.8% (218,248) |
| Enterprise: | 5.4% (2,932) |
| Nevada: | 3.3% (19,621) |
| Enterprise: | 4.9% (2,697) |
| Nevada: | 1.8% (10,941) |
| Enterprise: | 4.6% (2,523) |
| Nevada: | 2.0% (11,718) |
| Enterprise: | 3.9% (2,124) |
| Nevada: | 1.8% (10,683) |
| Enterprise: | 2.3% (1,244) |
| Nevada: | 4.2% (24,711) |
| Enterprise: | 2.3% (1,242) |
| Nevada: | 1.0% (5,914) |
| Enterprise: | 2.0% (1,102) |
| Nevada: | 1.9% (11,407) |
| Enterprise: | 2.0% (1,077) |
| Nevada: | 0.9% (5,094) |
| Enterprise: | 2.0% (1,066) |
| Nevada: | 1.5% (9,074) |
| Enterprise: | 1.9% (1,011) |
| Nevada: | 0.5% (2,829) |
| Enterprise: | 1.5% (824) |
| Nevada: | 0.3% (1,563) |
Place of birth for U.S.-born residents:
- This state: 52,855
- Other state: 115,711
- Northeast: 13,919
- Midwest: 21,685
- South: 18,280
- West: 61,827
86.8% of Enterprise residents lived in the same house 1 years ago.
Out of people who lived in different houses, 40.1% lived in this county.
Out of people who lived in different counties, 7.8% lived in Nevada.
| Enterprise: | 86.8% |
| State average: | 86.4% |
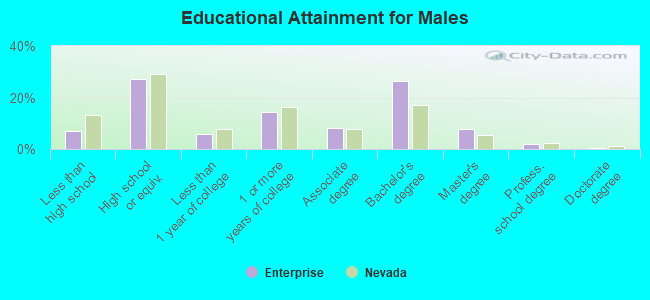
Education attainment for males 25 years and older:
- No schooling: 1,278
- Nursery to 4th grade: 0
- 5th and 6th grade: 0
- 7th and 8th grade: 518
- 9th grade: 867
- 10th grade: 174
- 11th grade: 804
- 12th grade, no diploma: 2,352
- High school graduate (or equivalency): 23,233
- Less than 1 year of college: 5,048
- Some college more than 1 year, no degree: 12,329
- Associate degree: 7,098
- Bachelor's degree: 22,561
- Master's degree: 6,696
- Professional school degree: 1,785
- Doctorate degree: 381
Education attainment for females 25 years and older:
- No schooling: 1,113
- Nursery to 4th grade: 242
- 5th and 6th grade: 157
- 7th and 8th grade: 586
- 9th grade: 289
- 10th grade: 376
- 11th grade: 552
- 12th grade, no diploma: 2,104
- High school graduate (or equivalency): 20,391
- Less than 1 year of college: 5,976
- Some college more than 1 year, no degree: 10,673
- Associate degree: 10,188
- Bachelor's degree: 20,442
- Master's degree: 7,563
- Professional school degree: 1,177
- Doctorate degree: 591

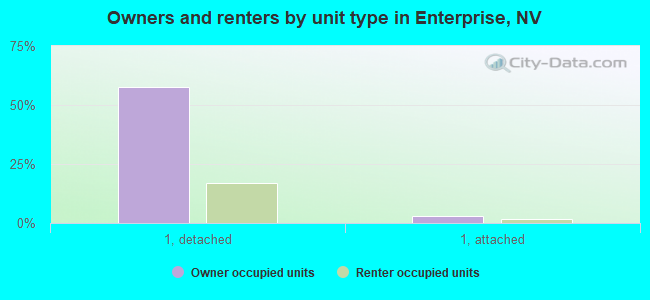
Housing units in structures:
- One, detached: 66,973
- One, attached: 4,122
- Two: 820
- 3 or 4: 3,036
- 5 to 9: 4,059
- 10 to 19: 3,328
- 20 to 49: 1,819
- 50 or more: 7,611
- Mobile homes: 187
- Boats, RVs, vans, etc.: 54
Housing units lacking complete kitchen facilities in 2022: 0.8%
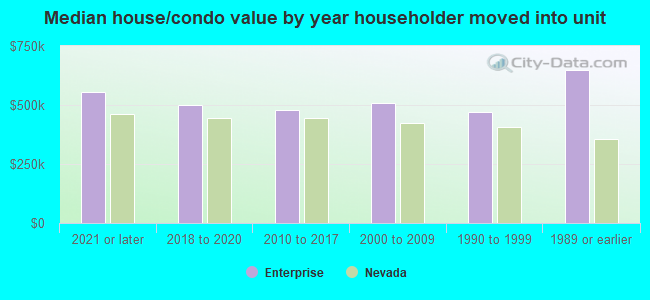
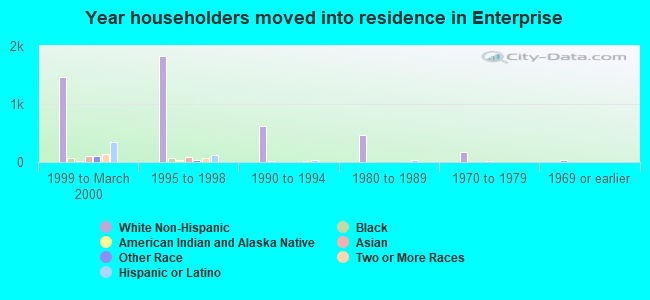
House/condo owner moved in on average 6 years ago
Renter moved in on average 2 years ago
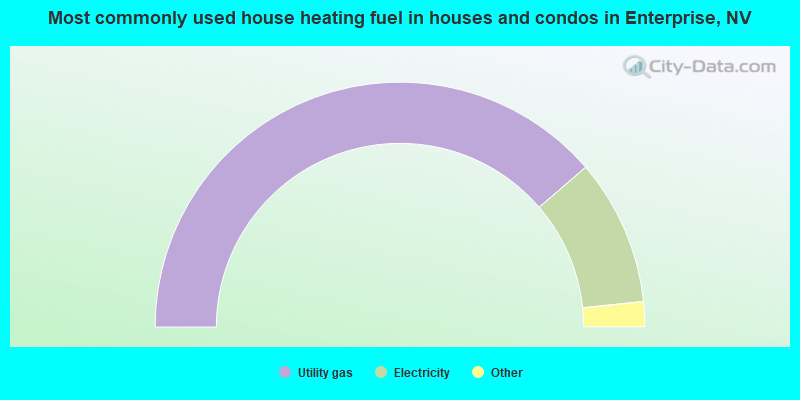
- 77.4%Utility gas
- 19.3%Electricity
- 1.5%Bottled, tank, or LP gas
- 1.0%Solar energy
- 0.5%No fuel used
- 0.2%Fuel oil, kerosene, etc.
- 0.1%Other fuel
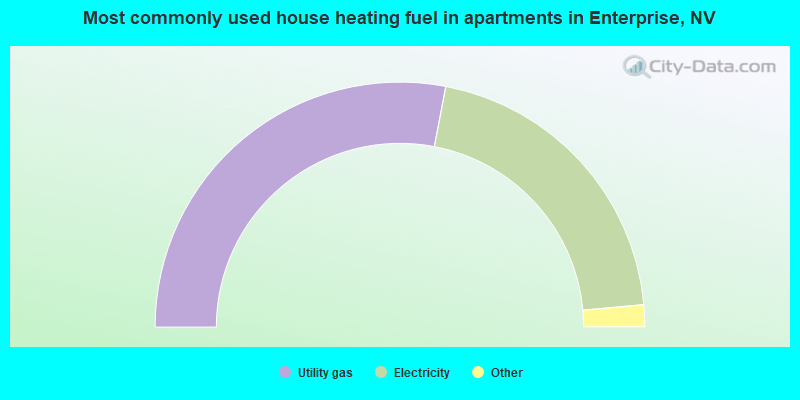
- 56.0%Utility gas
- 41.1%Electricity
- 1.2%No fuel used
- 1.1%Bottled, tank, or LP gas
- 0.4%Fuel oil, kerosene, etc.
- 0.1%Solar energy
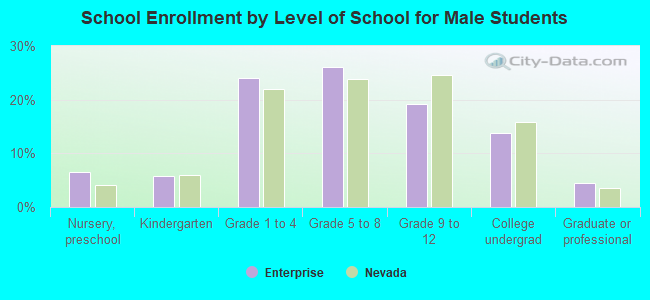
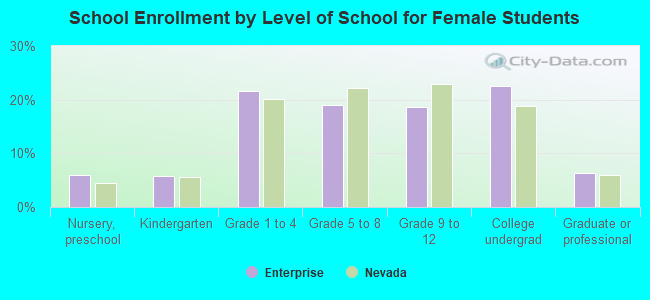
Private vs. public school enrollment:
| Here: | 13.3% |
| Nevada: | 12.9% |
| Here: | 5.7% |
| Nevada: | 6.9% |
| Here: | 15.8% |
| Nevada: | 16.0% |