Everett, WA (Washington) Houses and Residents
Estimated median house or condo value in 2022: $573,800 (it was $161,700 in 2000 )
Everett:
$573,800Washington:
$569,500
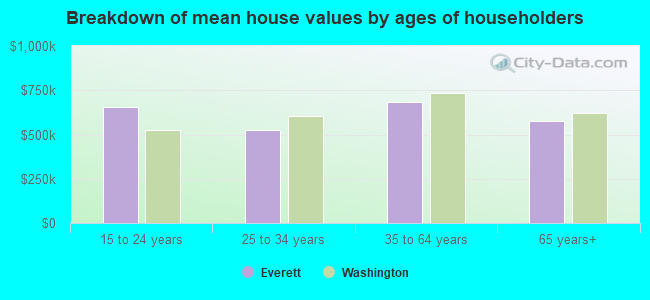
Lower value quartile - upper value quartile: $411,000 - $713,600Mean price in 2022: Detached houses: $734,573 Here:
$734,573State:
$734,307
Townhouses or other attached units: $500,036 Here:
$500,036State:
$657,697
In 2-unit structures: $636,451 Here:
$636,451State:
$534,634
In 3-to-4-unit structures: $429,024 Here:
$429,024State:
$510,239
In 5-or-more-unit structures: $344,146 Here:
$344,146State:
$503,183
Mobile homes: $212,871 Here:
$212,871State:
$218,362
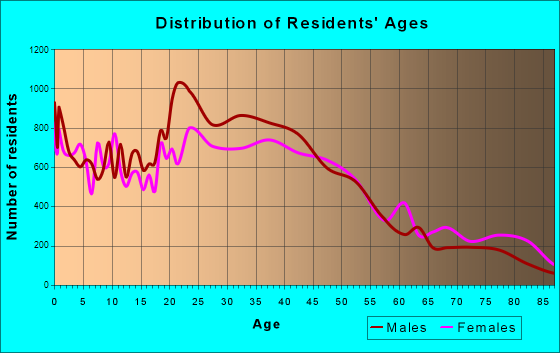
Total population: 106,736 (Urban population: 91,234, Rural population: 56 (all nonfarm) )
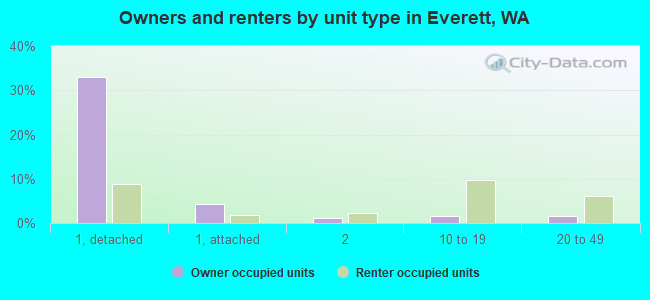
Houses: 49,892 (45,146 occupied: 20,504 owner occupied, 24,642 renter occupied )
% of renters here:
55%State:
36%
Housing density: 1,535 houses/condos per square mile
Median price asked for vacant for-sale houses and condos in 2022: $956,797.
Median contract rent in 2022: $1,541 (lower quartile is $1,221, upper quartile is $1,814)
Median rent asked for vacant for-rent units in 2022: $1,506
Median gross rent in Everett, WA in 2022: $1,648
Housing units in Everett with a mortgage: 15,065 (1,335 second mortgage, 117 home equity loan, 1,218 both second mortgage and home equity loan )Houses without a mortgage: 140
Median household income for houses/condos with a mortgage: $118,776
Median household income for apartments without a mortgage: $65,643
Median monthly housing costs: $1,664
Data:
Median house or condo value ($)
Median house or condo value ($ change since 2000)
Median house or condo value ($) - White
Median house or condo value ($) - Black or African American
Median house or condo value ($) - Asian
Median house or condo value ($) - Hispanic or Latino
Median house or condo value ($) - American Indian and Alaska Native
Median house or condo value ($) - Multirace
Median house or condo value ($) - Other Race
Median price asked for mobile homes ($)
Household density (households per square mile)
Mean house or condo value by units in structure - 1, detached ($)
Mean house or condo value by units in structure - 1, attached ($)
Mean house or condo value by units in structure - 2 ($)
Mean house or condo value by units in structure by units in structure - 3 or 4 ($)
Mean house or condo value by units in structure - 5 or more ($)
Mean house or condo value by units in structure - Boat, RV, van, etc. ($)
Mean house or condo value by units in structure - Mobile home ($)
Median contract rent ($)
Median contract rent - Lower quartile ($)
Median contract rent - Upper quartile ($)
Median gross rent ($)
Urban houses (%)
Rural houses (%)
Houses occupied (%)
Houses occupied (% change since 2000)
Houses owner occupied (%)
Houses owner occupied (% change since 2000)
Houses renter occupied (%)
Houses renter occupied (% change since 2000)
Vacant housing units - For rent (%)
Vacant housing units - For rent (% change since 2000)
Vacant housing units - For sale only (%)
Vacant housing units - For sale only (% change since 2000)
Vacant housing units - Rented or sold, not occupied (%)
Vacant housing units - Rented or sold, not occupied (% change since 2000)
Vacant housing units - For seasonal, recreational, or occasional use (%)
Vacant housing units - For seasonal, recreational, or occasional use (% change since 2000)
Vacant housing units - For migrant workers (%)
Vacant housing units - For migrant workers (% change since 2000)
Vacant housing units - Other vacant (%)
Vacant housing units - Other vacant (% change since 2000)
Median monthly housing costs ($)
Median household income for houses/condos with a mortgage ($)
Median household income for houses/condos without a mortgage ($)
Median household income ($)
Median household income ($) - White
Median household income ($) - Black or African American
Median household income ($) - Asian
Median household income ($) - Hispanic or Latino
Median household income ($) - American Indian and Alaska Native
Median household income ($) - Multirace
Median household income ($) - Other Race
Mortgage status - with mortgage (%)
Mortgage status - with second mortgage (%)
Mortgage status - with home equity loan (%)
Mortgage status - with both second mortgage and home equity loan (%)
Mortgage status - without a mortgage (%)
Median year house/condo built
Median year apartment built
Household type by relationship - Male householder living alone (%)
Household type by relationship - Male householder not living alone (%)
Household type by relationship - Female householder living alone (%)
Household type by relationship - Female householder not living alone (%)
Household type by relationship - Opposite-Sex spouse (%)
Household type by relationship - Same-Sex spouse (%)
Household type by relationship - Opposite-Sex unmarried partner (%)
Household type by relationship - Same-Sex unmarried partner (%)
Household type by relationship - In group quarters (%)
Size of family households - 2-person household (%)
Size of family households - 3-person household (%)
Size of family households - 4-person household (%)
Size of family households - 5-person household (%)
Size of family households - 6-person household (%)
Size of family households - 7-or-more-person household (%)
Size of nonfamily households - 1-person household (%)
Size of nonfamily households - 2-person household (%)
Size of nonfamily households - 3-person household (%)
Size of nonfamily households - 4-person household (%)
Size of nonfamily households - 5-person household (%)
Size of nonfamily households - 6-person household (%)
Size of nonfamily households - 7-or-moreperson household (%)
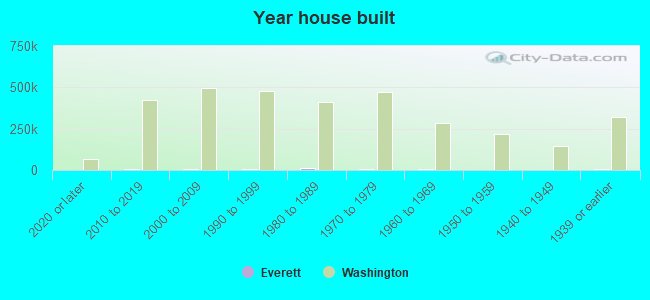
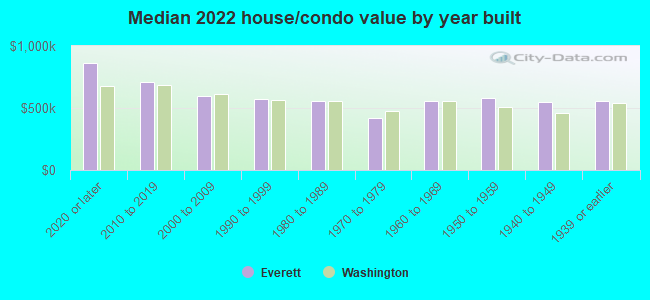
Year house built - Built 2010 or later (%)
Year house built - Built 2000 to 2009 (%)
Year house built - Built 1990 to 1999 (%)
Year house built - Built 1980 to 1989 (%)
Year house built - Built 1970 to 1979 (%)
Year house built - Built 1960 to 1969 (%)
Year house built - Built 1950 to 1959 (%)
Year house built - Built 1940 to 1949 (%)
Year house built - Built 1939 or earlier (%)
Median number of rooms in houses and condos
Median number of rooms in apartments
Median number of bedrooms in owner occupied houses
Mean number of bedrooms in owner occupied houses
Median number of bedrooms in renter occupied houses
Mean number of bedrooms in renter occupied houses
Median number of vehichles in owner occupied houses
Mean number of vehichles in owner occupied houses
Median number of vehichles in renter occupied houses
Mean number of vehichles in renter occupied houses
Rooms in owner-occupied houses - 1 room (%)
Rooms in owner-occupied houses - 2 rooms (%)
Rooms in owner-occupied houses - 3 rooms (%)
Rooms in owner-occupied houses - 4 rooms (%)
Rooms in owner-occupied houses - 5 rooms (%)
Rooms in owner-occupied houses - 6 rooms (%)
Rooms in owner-occupied houses - 7 rooms (%)
Rooms in owner-occupied houses - 8 rooms (%)
Rooms in owner-occupied houses - 9+ rooms (%)
Rooms in renter-occupied houses - 1 room (%)
Rooms in renter-occupied houses - 2 rooms (%)
Rooms in renter-occupied houses - 3 rooms (%)
Rooms in renter-occupied houses - 4 rooms (%)
Rooms in renter-occupied houses - 5 rooms (%)
Rooms in renter-occupied houses - 6 rooms (%)
Rooms in renter-occupied houses - 7 rooms (%)
Rooms in renter-occupied houses - 8 rooms (%)
Rooms in renter-occupied houses - 9+ rooms (%)
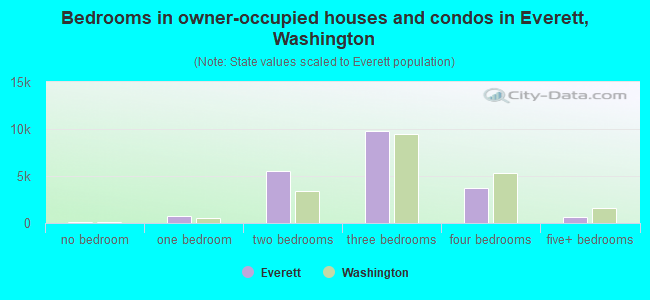
Bedrooms in owner-occupied houses - no bedrooms (%)
Bedrooms in owner-occupied houses - 1 bedroom (%)
Bedrooms in owner-occupied houses - 2 bedrooms (%)
Bedrooms in owner-occupied houses - 3 bedrooms (%)
Bedrooms in owner-occupied houses - 4 bedrooms (%)
Bedrooms in owner-occupied houses - 5+ bedrooms (%)
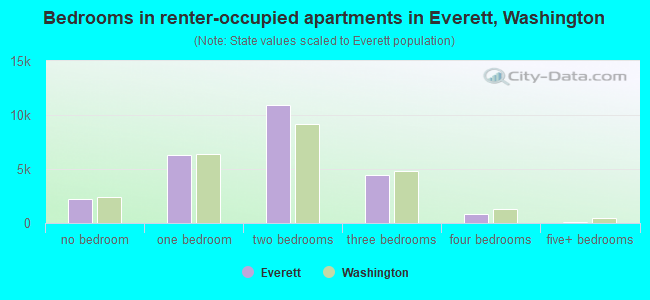
Bedrooms in renter-occupied houses - no bedrooms (%)
Bedrooms in renter-occupied houses - 1 bedroom (%)
Bedrooms in renter-occupied houses - 2 bedrooms (%)
Bedrooms in renter-occupied houses - 3 bedrooms (%)
Bedrooms in renter-occupied houses - 4 bedrooms (%)
Bedrooms in renter-occupied houses - 5+ bedrooms (%)
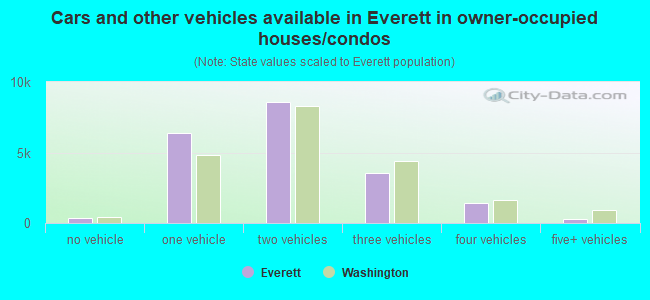
Vehicles available in owner-occupied houses - no vehicle available (%)
Vehicles available in owner-occupied houses - 1 vehicle available(%)
Vehicles available in owner-occupied houses - 2 Vehicles available (%)
Vehicles available in owner-occupied houses - 3 Vehicles available (%)
Vehicles available in owner-occupied houses - 4 Vehicles available (%)
Vehicles available in owner-occupied houses - 5+ Vehicles available (%)
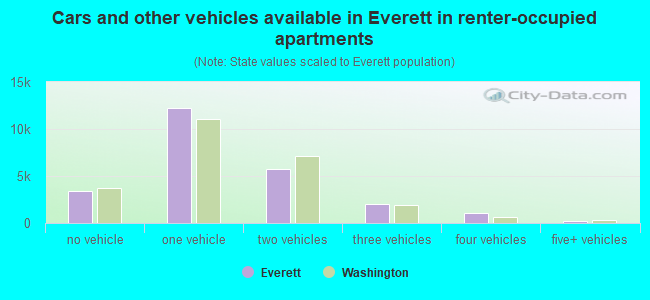
Vehicles available in renter-occupied houses - no vehicle available (%)
Vehicles available in renter-occupied houses - 1 vehicle available (%)
Vehicles available in renter-occupied houses - 2 Vehicles available (%)
Vehicles available in renter-occupied houses - 3 Vehicles available (%)
Vehicles available in renter-occupied houses - 4 Vehicles available (%)
Vehicles available in renter-occupied houses - 5+ Vehicles available (%)
Housing units in structures - 1, detached (%)
Housing units in structures - 1, attached (%)
Housing units in structures - 2 (%)
Housing units in structures - 3 or 4 (%)
Housing units in structures - 5 to 9 (%)
Housing units in structures - 10 to 19 (%)
Housing units in structures - 20 to 49 (%)
Housing units in structures - 50 or more (%)
Housing units in structures - Mobile home (%)
Housing units in structures - Boat, RV, van, etc. (%)
Housing units in structures - Owners - 1, detached (%)
Housing units in structures - Owners - 1, attached (%)
Housing units in structures - Owners - 2 (%)
Housing units in structures - Owners - 3 or 4 (%)
Housing units in structures - Owners - 5 to 9 (%)
Housing units in structures - Owners - 10 to 19 (%)
Housing units in structures - Owners - 20 to 49 (%)
Housing units in structures - Owners - 50 or more (%)
Housing units in structures - Owners - Mobile home (%)
Housing units in structures - Owners - Boat, RV, van, etc. (%)
Housing units in structures - Renters - 1, detached (%)
Housing units in structures - Renters - 1, attached (%)
Housing units in structures - Renters - 2 (%)
Housing units in structures - Renters - 3 or 4 (%)
Housing units in structures - Renters - 5 to 9 (%)
Housing units in structures - Renters - 10 to 19 (%)
Housing units in structures - Renters - 20 to 49 (%)
Housing units in structures - Renters - 50 or more (%)
Housing units in structures - Renters - Mobile home (%)
Housing units in structures - Renters - Boat, RV, van, etc. (%)
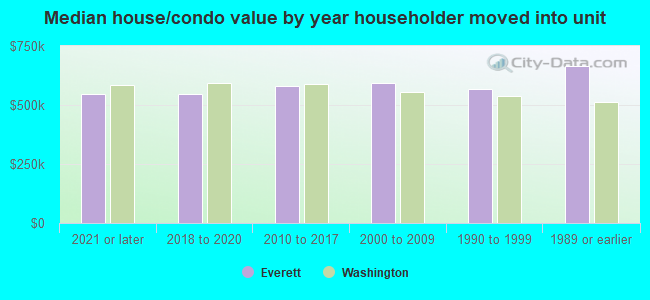
House/condo owner moved in on average (years ago)
Renter moved in on average (years ago)
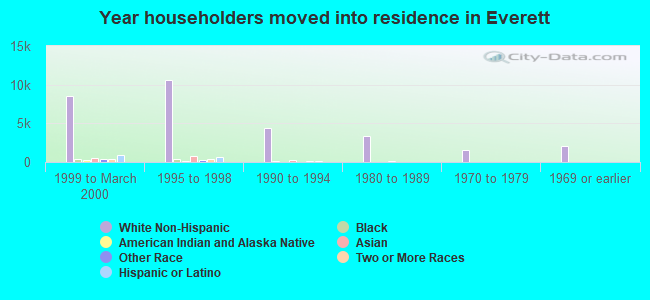
Year householder moved into unit - Moved in 1999 to March 2000 (%)
Year householder moved into unit - Moved in 1999 to March 2000 (%) - White
Year householder moved into unit - Moved in 1999 to March 2000 (%) - Black or African American
Year householder moved into unit - Moved in 1999 to March 2000 (%) - Asian
Year householder moved into unit - Moved in 1999 to March 2000 (%) - Hispanic or Latino
Year householder moved into unit - Moved in 1999 to March 2000 (%) - American Indian and Alaska Native
Year householder moved into unit - Moved in 1999 to March 2000 (%) - Multirace
Year householder moved into unit - Moved in 1999 to March 2000 (%) - Other Race
Year householder moved into unit - Moved in 1995 to 1998 (%)
Year householder moved into unit - Moved in 1995 to 1998 (%) - White
Year householder moved into unit - Moved in 1995 to 1998 (%) - Black or African American
Year householder moved into unit - Moved in 1995 to 1998 (%) - Asian
Year householder moved into unit - Moved in 1995 to 1998 (%) - Hispanic or Latino
Year householder moved into unit - Moved in 1995 to 1998 (%) - American Indian and Alaska Native
Year householder moved into unit - Moved in 1995 to 1998 (%) - Multirace
Year householder moved into unit - Moved in 1995 to 1998 (%) - Other Race
Year householder moved into unit - Moved in 1990 to 1994 (%)
Year householder moved into unit - Moved in 1990 to 1994 (%) - White
Year householder moved into unit - Moved in 1990 to 1994 (%) - Black or African American
Year householder moved into unit - Moved in 1990 to 1994 (%) - Asian
Year householder moved into unit - Moved in 1990 to 1994 (%) - Hispanic or Latino
Year householder moved into unit - Moved in 1990 to 1994 (%) - American Indian and Alaska Native
Year householder moved into unit - Moved in 1990 to 1994 (%) - Multirace
Year householder moved into unit - Moved in 1990 to 1994 (%) - Other Race
Year householder moved into unit - Moved in 1980 to 1989 (%)
Year householder moved into unit - Moved in 1980 to 1989 (%) - White
Year householder moved into unit - Moved in 1980 to 1989 (%) - Black or African American
Year householder moved into unit - Moved in 1980 to 1989 (%) - Asian
Year householder moved into unit - Moved in 1980 to 1989 (%) - Hispanic or Latino
Year householder moved into unit - Moved in 1980 to 1989 (%) - American Indian and Alaska Native
Year householder moved into unit - Moved in 1980 to 1989 (%) - Multirace
Year householder moved into unit - Moved in 1980 to 1989 (%) - Other Race
Year householder moved into unit - Moved in 1970 to 1979 (%)
Year householder moved into unit - Moved in 1970 to 1979 (%) - White
Year householder moved into unit - Moved in 1970 to 1979 (%) - Black or African American
Year householder moved into unit - Moved in 1970 to 1979 (%) - Asian
Year householder moved into unit - Moved in 1970 to 1979 (%) - Hispanic or Latino
Year householder moved into unit - Moved in 1970 to 1979 (%) - American Indian and Alaska Native
Year householder moved into unit - Moved in 1970 to 1979 (%) - Multirace
Year householder moved into unit - Moved in 1970 to 1979 (%) - Other Race
Year householder moved into unit - Moved in 1969 or earlier (%)
Year householder moved into unit - Moved in 1969 or earlier (%) - White
Year householder moved into unit - Moved in 1969 or earlier (%) - Black or African American
Year householder moved into unit - Moved in 1969 or earlier (%) - Asian
Year householder moved into unit - Moved in 1969 or earlier (%) - Hispanic or Latino
Year householder moved into unit - Moved in 1969 or earlier (%) - American Indian and Alaska Native
Year householder moved into unit - Moved in 1969 or earlier (%) - Multirace
Year householder moved into unit - Moved in 1969 or earlier (%) - Other Race
Housing units lacking complete plumbing facilities (%)
Housing units lacking complete kitchen facilities (%)
House heating fuel used in houses and condos - Utility gas (%)
House heating fuel used in houses and condos - Bottled, tank, or LP gas (%)
House heating fuel used in houses and condos - Electricity (%)
House heating fuel used in houses and condos - Fuel oil, kerosene, etc. (%)
House heating fuel used in houses and condos - Coal or coke (%)
House heating fuel used in houses and condos - Wood (%)
House heating fuel used in houses and condos - Solar energy (%)
House heating fuel used in houses and condos - Other fuel (%)
House heating fuel used in houses and condos - No fuel used (%)
House heating fuel used in apartments - Utility gas (%)
House heating fuel used in apartments - Bottled, tank, or LP gas (%)
House heating fuel used in apartments - Electricity (%)
House heating fuel used in apartments - Fuel oil, kerosene, etc. (%)
House heating fuel used in apartments - Coal or coke (%)
House heating fuel used in apartments - Wood (%)
House heating fuel used in apartments - Solar energy (%)
House heating fuel used in apartments - Other fuel (%)
House heating fuel used in apartments - No fuel used (%)
Latest news about housing in Everett, WA collected exclusively by city-data.com from local newspapers, TV, and radio stations
Median year house/condo built: 1975Median year apartment built: 1984Household type by relationship:
Households: 111,348
Male householders: 23,141 (7,471 living alone ), Female householders: 22,005 (7,495 living alone )16,194 spouses (15,781 opposite-sex spouses ), 4,690 unmarried partners , (4,462 opposite-sex unmarried partners ), 27,409 children (25,850 natural , 292 adopted , 1,267 stepchildren ), 2,005 grandchildren , 1,809 brothers or sisters , 1,609 parents , 0 foster children , 2,881 other relatives , 6,793 non-relatives In group quarters: 2,812
Size of family households: 10,437 2-persons , 5,951 3-persons , 3,337 4-persons , 2,015 5-persons , 838 6-persons , 1,349 7-or-more-persons .
Size of nonfamily households: 14,966 1-person , 4,642 2-persons , 1,486 3-persons , 125 5-persons .
11,989 married couples with children. single-parent households (2,130 men , 5,227 women ).
71.9% of residents of Everett speak English at home. of residents speak Spanish at home (52% speak English very well , 23% speak English well , 17% speak English not well , 8% don't speak English at all ).of residents speak other Indo-European language at home (55% speak English very well , 24% speak English well , 13% speak English not well , 8% don't speak English at all ).of residents speak Asian or Pacific Island language at home (48% speak English very well , 32% speak English well , 16% speak English not well , 3% don't speak English at all ).of residents speak other language at home (69% speak English very well , 22% speak English well , 6% speak English not well , 3% don't speak English at all ).
Foreign born population: 22,508 (20.2%)of them are naturalized citizens )
Median number of rooms in houses and condos:
Median number of rooms in apartments
Owner-occupied Renter-occupied
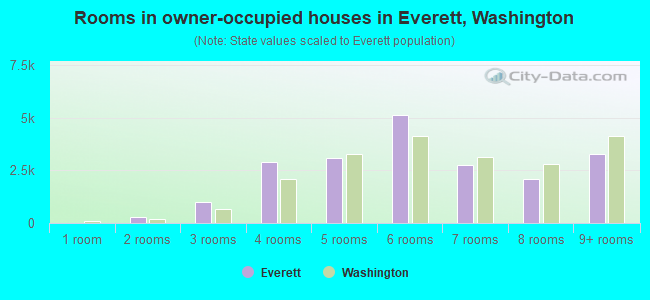
Rooms in owner-occupied houses in Everett, Washington
0 1 room 304 2 rooms 974 3 rooms 2,882 4 rooms 3,095 5 rooms 5,130 6 rooms 2,770 7 rooms 2,070 8 rooms 3,279 9+ rooms
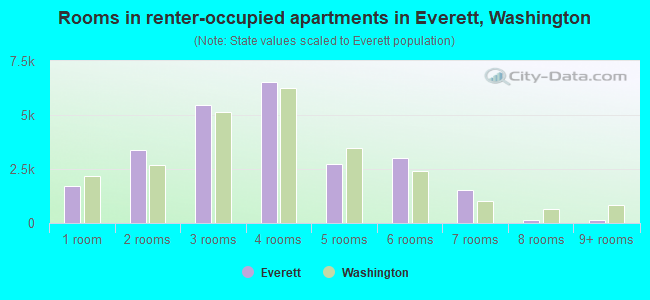
Rooms in renter-occupied apartments in Everett, Washington
1,712 1 room 3,387 2 rooms 5,445 3 rooms 6,550 4 rooms 2,724 5 rooms 3,017 6 rooms 1,533 7 rooms 137 8 rooms 137 9+ rooms
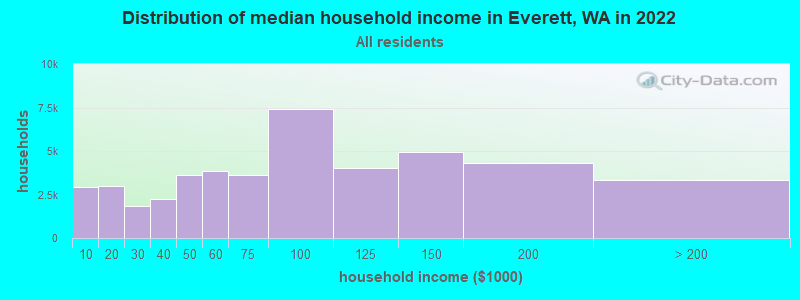
Everett, WA household income distribution 2,917 Less than $10,0003,000 $10,000 to $19,9991,812 $20,000 to $29,9992,267 $30,000 to $39,9993,639 $40,000 to $49,9993,841 $50,000 to $59,9993,612 $60,000 to $74,9997,411 $75,000 to $99,9994,034 $100,000 to $124,9994,948 $125,000 to $149,9994,325 $150,000 to $199,9993,340 $200,000 or more
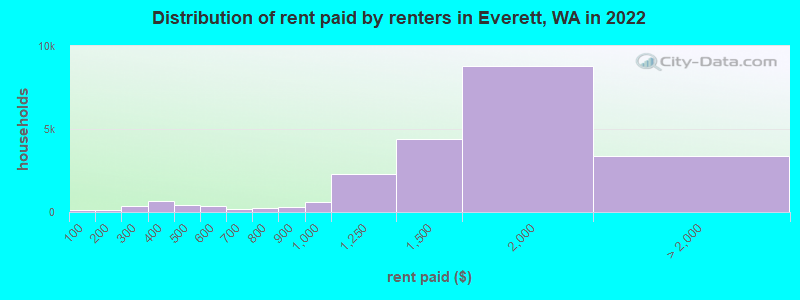
Home value of owner - occupied houses in 2022 in Everett, WA 203 Less than $10,0002 $10,000 to $14,9993 $15,000 to $19,99921 $20,000 to $24,999132 $25,000 to $29,99934 $30,000 to $34,99982 $35,000 to $39,999179 $40,000 to $49,999241 $50,000 to $59,99959 $60,000 to $69,999114 $70,000 to $79,999111 $80,000 to $89,99940 $90,000 to $99,999433 $100,000 to $124,99975 $125,000 to $149,999241 $150,000 to $174,999105 $175,000 to $199,999458 $200,000 to $249,999539 $250,000 to $299,9991,939 $300,000 to $399,9992,626 $400,000 to $499,9996,432 $500,000 to $749,9992,159 $750,000 to $999,9991,082 $1,000,000 to $1,499,999177 $1,500,000 to $1,999,999297 $2,000,000 or moreRent paid by renters in 2022 in Everett, WA 132 Less than $10024 $100 to $14999 $150 to $199305 $200 to $24965 $250 to $299449 $300 to $349240 $350 to $399359 $400 to $44954 $450 to $499135 $500 to $549245 $550 to $599116 $600 to $64953 $650 to $69964 $700 to $749167 $750 to $799277 $800 to $899627 $900 to $9992,305 $1,000 to $1,2494,415 $1,250 to $1,4998,819 $1,500 to $1,9992,339 $2,000 to $2,499296 $2,500 to $2,99933 $3,000 to $3,499115 $3,500 or more573 No cash rent
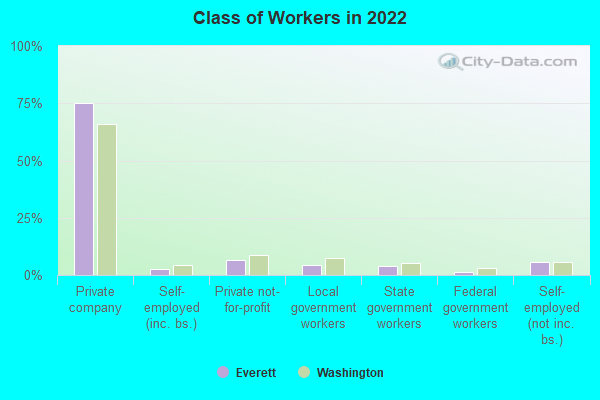
Percentage of workers working in this county: 78.3%Number of people working at home: 9,083 (15.8% of all workers )
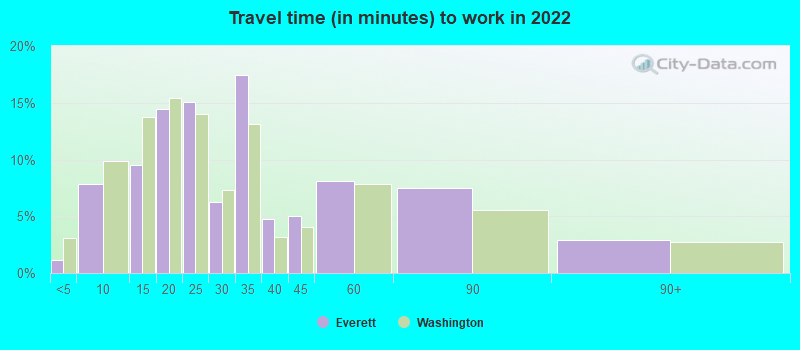
Travel time to work (commute)
Less than 5 minutes: 9565 to 9 minutes: 4,77710 to 14 minutes: 7,03915 to 19 minutes: 7,60120 to 24 minutes: 4,75425 to 29 minutes: 2,43330 to 34 minutes: 7,82735 to 39 minutes: 2,00440 to 44 minutes: 1,87345 to 59 minutes: 4,74260 to 89 minutes: 3,85590 or more minutes: 445
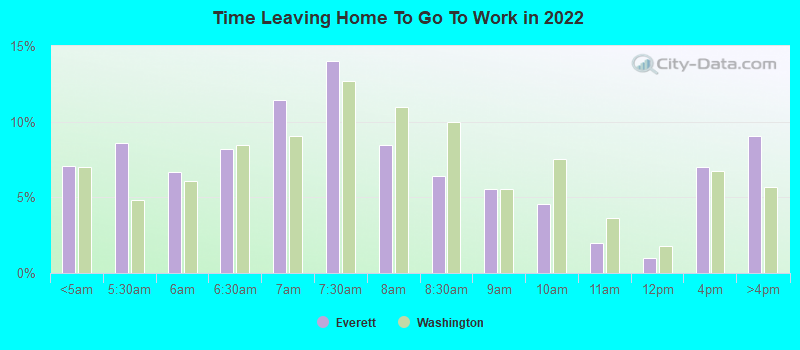
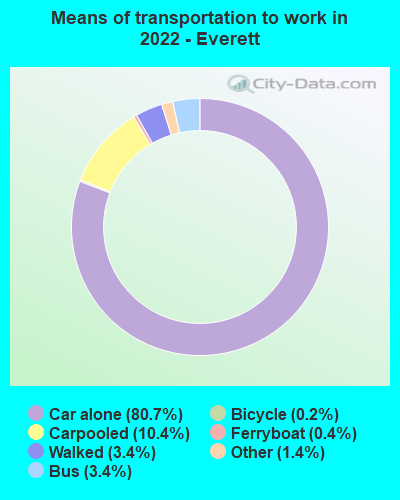
Means of transportation to work:
Drove a car alone: 66,654 (72.7%)Carpooled: 8,615 (9.4%)Bus : 2,802 (3.1%)Ferryboat: 348 (0.4%)Taxi: 1,178 (1.3%)Bicycle: 148 (0.2%)Walked: 2,837 (3.1%)Worked at home: 9,083 (9.9%)
Unemployment by race in 2022
Unemployment rate for White non-Hispanic residents 8.7% Males7.3% FemalesUnemployment rate for Black residents 7.7% Males4.3% FemalesUnemployment rate for Asian residents 4.4% Males11.5% FemalesUnemployment rate for other race residents 0.7% Males13.5% FemalesUnemployment rate for two or more race residents 4.2% Males6.7% FemalesUnemployment rate for Hispanic or Latino residents 1.3% Males11.4% Females
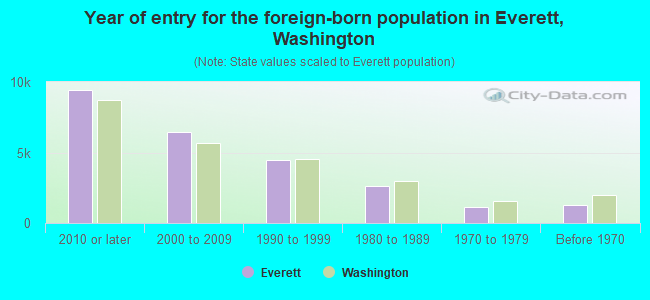
Year of entry for the foreign-born population in Everett, Washington
9,461 2010 or later 6,437 2000 to 2009 4,481 1990 to 1999 2,633 1980 to 1989 1,155 1970 to 1979 1,283 Before 1970
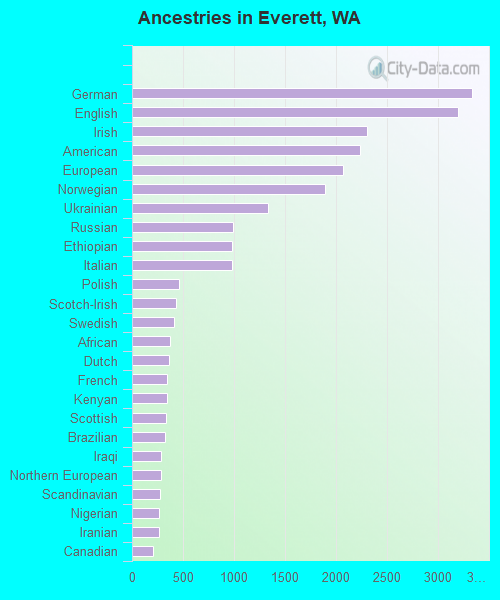
First ancestries reported:
German: 3,334 (6.2%)
English: 3,193 (5.9%)
Irish: 2,309 (4.3%)
American: 2,240 (4.1%)
European: 2,068 (3.8%)
Norwegian: 1,889 (3.5%)
Ukrainian: 1,332 (2.5%)
Russian: 994 (1.8%)
Ethiopian: 979 (1.8%)
Italian: 978 (1.8%)
Polish: 459 (0.9%)
Scotch-Irish: 432 (0.8%)
Swedish: 415 (0.8%)
African: 376 (0.7%)
Dutch: 367 (0.7%)
French: 341 (0.6%)
Kenyan: 340 (0.6%)
Scottish: 332 (0.6%)
Brazilian: 325 (0.6%)
Iraqi: 286 (0.5%)
Northern European: 285 (0.5%)
Scandinavian: 270 (0.5%)
Nigerian: 262 (0.5%)
Iranian: 260 (0.5%)
Canadian: 202 (0.4%)
Romanian: 171 (0.3%)
Danish: 161 (0.3%)
British: 134 (0.2%)
Finnish: 122 (0.2%)
Portuguese: 106 (0.2%)
Welsh: 84 (0.2%)
Armenian: 82 (0.2%)
French Canadian: 68 (0.1%)
Croatian: 65 (0.1%)
Palestinian: 64 (0.1%)
Austrian: 59 (0.1%)
Arab: 58 (0.1%)
Moroccan: 57 (0.1%)
Albanian: 55 (0.1%)
Slavic: 53 (0.10%)
Lithuanian: 49 (0.09%)
Ugandan: 45 (0.08%)
Jamaican: 43 (0.08%)
West Indian: 43 (0.08%)
Sudanese: 36 (0.07%)
Liberian: 35 (0.06%)
Czech: 34 (0.06%)
Greek: 30 (0.06%)
Eastern European: 30 (0.06%)
Basque: 28 (0.05%)
Senegalese: 28 (0.05%)
Sierra Leonean: 26 (0.05%)
Swiss: 26 (0.05%)
Czechoslovakian: 24 (0.04%)
Bulgarian: 22 (0.04%)
Haitian: 22 (0.04%)
Hungarian: 21 (0.04%)
Yugoslavian: 18 (0.03%)
Cajun: 14 (0.03%)
Serbian: 14 (0.03%)
Egyptian: 14 (0.03%)
Estonian: 11 (0.02%)
Australian: 10 (0.02%)
Turkish: 10 (0.02%)
Ghanaian: 9 (0.02%)
Belgian: 8 (0.01%)
Latvian: 8 (0.01%)
Icelander: 8 (0.01%)
Pennsylvania German: 4 (0.01%)
Most common places of birth for foreign-born residents (%): Mexico Everett:
18.1% (4,342)Washington:
21.1% (241,655)
Vietnam Everett:
13.9% (3,329)Washington:
5.4% (62,003)
Philippines Everett:
6.6% (1,588)Washington:
6.3% (71,661)
Ukraine Everett:
5.7% (1,372)Washington:
3.1% (35,872)
Ethiopia Everett:
4.1% (986)Washington:
1.6% (17,938)
Other Western Africa Everett:
4.0% (964)Washington:
0.3% (3,638)
Korea Everett:
4.0% (956)Washington:
4.3% (48,886)
Russia Everett:
3.2% (764)Washington:
1.9% (21,540)
Guatemala Everett:
3.1% (741)Washington:
1.2% (13,855)
Marshall Islands Everett:
2.4% (570)Washington:
0.3% (3,048)
India Everett:
2.3% (549)Washington:
8.9% (101,353)
Peru Everett:
2.3% (549)Washington:
0.4% (4,914)
Kenya Everett:
2.2% (531)Washington:
1.1% (12,735)
Colombia Everett:
1.7% (407)Washington:
0.5% (5,640)
Brazil Everett:
1.6% (373)Washington:
0.8% (9,359)
Place of birth for U.S.-born residents:
This state: 51,920Other state: 34,723Northeast: 6,087Midwest: 7,161South: 5,770West: 15,705 84.2% of Everett residents lived in the same house 1 years ago.
Out of people who lived in different houses, 38.5% lived in this county.
Out of people who lived in different counties, 67.0% lived in Washington.
Everett:
84.2%State average:
85.2%
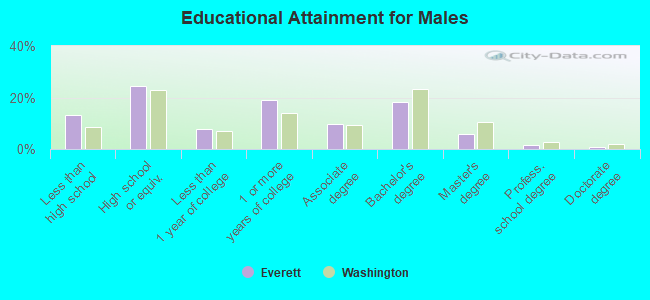
Education attainment for males 25 years and older:
No schooling: 1,086Nursery to 4th grade: 645th and 6th grade: 5787th and 8th grade: 3499th grade: 92310th grade: 57811th grade: 44412th grade, no diploma: 1,171High school graduate (or equivalency): 9,632Less than 1 year of college: 3,014Some college more than 1 year, no degree: 7,519Associate degree: 3,912Bachelor's degree: 7,222Master's degree: 2,265Professional school degree: 601Doctorate degree: 234
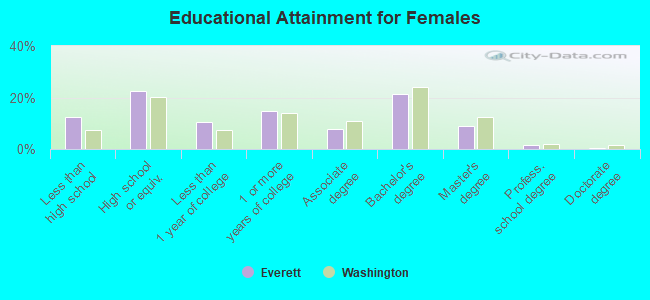
Education attainment for females 25 years and older:
No schooling: 466Nursery to 4th grade: 3015th and 6th grade: 4317th and 8th grade: 1349th grade: 87610th grade: 89511th grade: 41212th grade, no diploma: 1,142High school graduate (or equivalency): 8,588Less than 1 year of college: 3,939Some college more than 1 year, no degree: 5,655Associate degree: 2,897Bachelor's degree: 8,086Master's degree: 3,378Professional school degree: 627Doctorate degree: 218
Housing units in structures:
One, detached: 20,404One, attached: 2,943Two: 1,8173 or 4: 3,0445 to 9: 4,34910 to 19: 6,24920 to 49: 3,60750 or more: 6,361Mobile homes: 959Boats, RVs, vans, etc.: 159Median worth of mobile homes: $163,600
Housing units lacking complete plumbing facilities in 2022: 1.7%Housing units lacking complete kitchen facilities in 2022: 2.2%House/condo owner moved in on average 8 years ago
Renter moved in on average 3 years ago
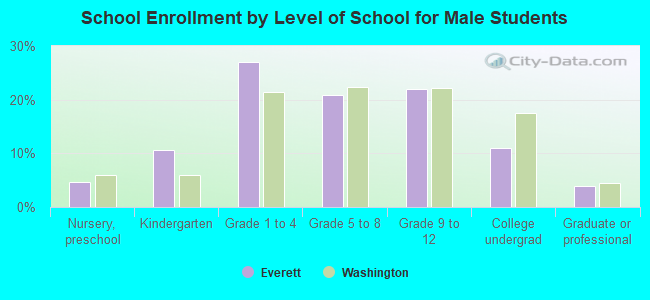
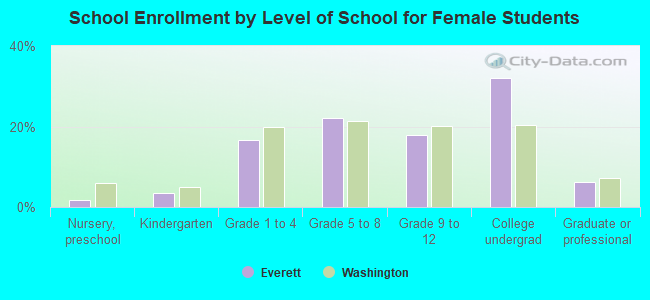
Private vs. public school enrollment:
Students in private schools in grades 1 to 8 (elementary and middle school): 1,587 Here:
17.2%Washington:
12.4%
Students in private schools in grades 9 to 12 (high school): 112 Students in private undergraduate colleges: 350 Here:
7.6%Washington:
16.5%