Fairfield, OH (Ohio) Houses and Residents
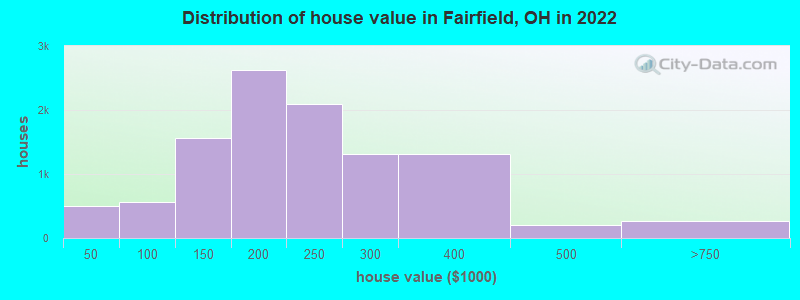
Estimated median house or condo value in 2022: $234,553 (it was $120,800 in 2000 )
Fairfield:
$234,553Ohio:
$204,100
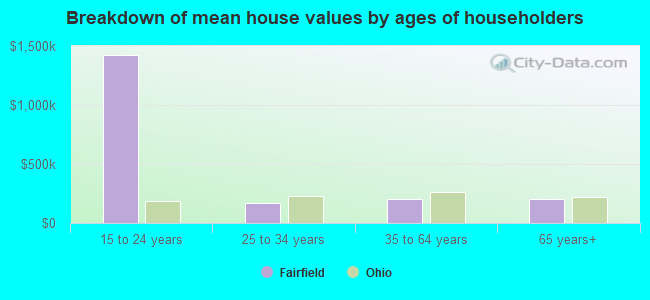
Lower value quartile - upper value quartile: $167,347 - $289,407Mean price in 2022: Detached houses: $241,380 Here:
$241,380State:
$254,366
Townhouses or other attached units: $116,448 Here:
$116,448State:
$225,733
In 2-unit structures: $276,128 Here:
$276,128State:
$144,384
In 3-to-4-unit structures: $152,754 Here:
$152,754State:
$203,002
In 5-or-more-unit structures: $111,924 Here:
$111,924State:
$211,593
Mobile homes: $11,698 Here:
$11,698State:
$62,719
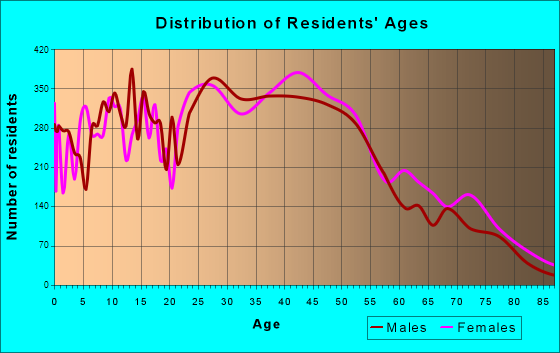
Total population: 42,770 (Urban population: 41,703, Rural population: 269 (all nonfarm) )
Houses: 19,687 (18,572 occupied: 11,955 owner occupied, 6,901 renter occupied )
% of renters here:
37%State:
33%
Housing density: 938 houses/condos per square mile
Median price asked for vacant for-sale houses and condos in 2022: $351,722.
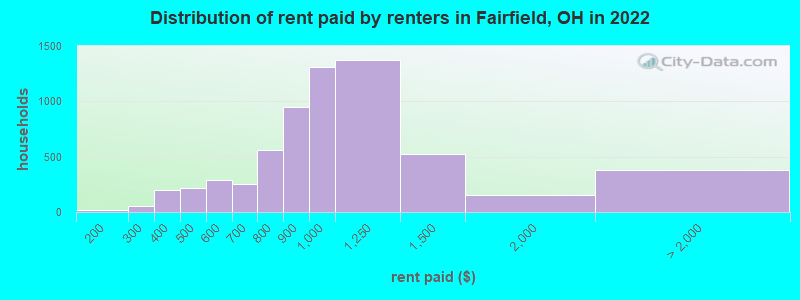
Median contract rent in 2022: $866 (lower quartile is $814, upper quartile is $1,091)
Median rent asked for vacant for-rent units in 2022: $1,172
Median gross rent in Fairfield, OH in 2022: $1,023
Housing units in Fairfield with a mortgage: 7,766 (620 second mortgage, 12 home equity loan, 521 both second mortgage and home equity loan )Houses without a mortgage: 93
Median household income for houses/condos with a mortgage: $101,180
Median household income for apartments without a mortgage: $64,645
Median monthly housing costs: $1,064
Data:
Median house or condo value ($)
Median house or condo value ($ change since 2000)
Median house or condo value ($) - White
Median house or condo value ($) - Black or African American
Median house or condo value ($) - Asian
Median house or condo value ($) - Hispanic or Latino
Median house or condo value ($) - American Indian and Alaska Native
Median house or condo value ($) - Multirace
Median house or condo value ($) - Other Race
Median price asked for mobile homes ($)
Household density (households per square mile)
Mean house or condo value by units in structure - 1, detached ($)
Mean house or condo value by units in structure - 1, attached ($)
Mean house or condo value by units in structure - 2 ($)
Mean house or condo value by units in structure by units in structure - 3 or 4 ($)
Mean house or condo value by units in structure - 5 or more ($)
Mean house or condo value by units in structure - Boat, RV, van, etc. ($)
Mean house or condo value by units in structure - Mobile home ($)
Median contract rent ($)
Median contract rent - Lower quartile ($)
Median contract rent - Upper quartile ($)
Median gross rent ($)
Urban houses (%)
Rural houses (%)
Houses occupied (%)
Houses occupied (% change since 2000)
Houses owner occupied (%)
Houses owner occupied (% change since 2000)
Houses renter occupied (%)
Houses renter occupied (% change since 2000)
Vacant housing units - For rent (%)
Vacant housing units - For rent (% change since 2000)
Vacant housing units - For sale only (%)
Vacant housing units - For sale only (% change since 2000)
Vacant housing units - Rented or sold, not occupied (%)
Vacant housing units - Rented or sold, not occupied (% change since 2000)
Vacant housing units - For seasonal, recreational, or occasional use (%)
Vacant housing units - For seasonal, recreational, or occasional use (% change since 2000)
Vacant housing units - For migrant workers (%)
Vacant housing units - For migrant workers (% change since 2000)
Vacant housing units - Other vacant (%)
Vacant housing units - Other vacant (% change since 2000)
Median monthly housing costs ($)
Median household income for houses/condos with a mortgage ($)
Median household income for houses/condos without a mortgage ($)
Median household income ($)
Median household income ($) - White
Median household income ($) - Black or African American
Median household income ($) - Asian
Median household income ($) - Hispanic or Latino
Median household income ($) - American Indian and Alaska Native
Median household income ($) - Multirace
Median household income ($) - Other Race
Mortgage status - with mortgage (%)
Mortgage status - with second mortgage (%)
Mortgage status - with home equity loan (%)
Mortgage status - with both second mortgage and home equity loan (%)
Mortgage status - without a mortgage (%)
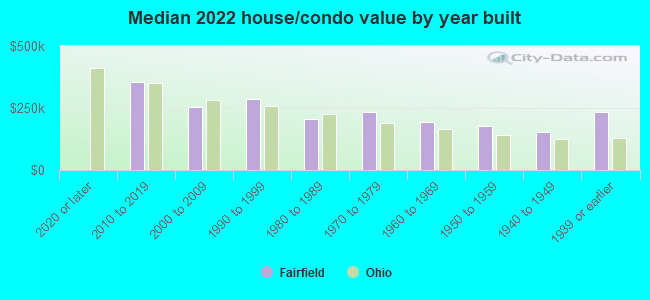
Median year house/condo built
Median year apartment built
Household type by relationship - Male householder living alone (%)
Household type by relationship - Male householder not living alone (%)
Household type by relationship - Female householder living alone (%)
Household type by relationship - Female householder not living alone (%)
Household type by relationship - Opposite-Sex spouse (%)
Household type by relationship - Same-Sex spouse (%)
Household type by relationship - Opposite-Sex unmarried partner (%)
Household type by relationship - Same-Sex unmarried partner (%)
Household type by relationship - In group quarters (%)
Size of family households - 2-person household (%)
Size of family households - 3-person household (%)
Size of family households - 4-person household (%)
Size of family households - 5-person household (%)
Size of family households - 6-person household (%)
Size of family households - 7-or-more-person household (%)
Size of nonfamily households - 1-person household (%)
Size of nonfamily households - 2-person household (%)
Size of nonfamily households - 3-person household (%)
Size of nonfamily households - 4-person household (%)
Size of nonfamily households - 5-person household (%)
Size of nonfamily households - 6-person household (%)
Size of nonfamily households - 7-or-moreperson household (%)
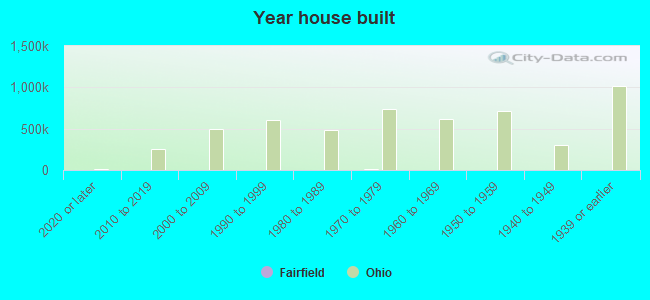
Year house built - Built 2010 or later (%)
Year house built - Built 2000 to 2009 (%)
Year house built - Built 1990 to 1999 (%)
Year house built - Built 1980 to 1989 (%)
Year house built - Built 1970 to 1979 (%)
Year house built - Built 1960 to 1969 (%)
Year house built - Built 1950 to 1959 (%)
Year house built - Built 1940 to 1949 (%)
Year house built - Built 1939 or earlier (%)
Median number of rooms in houses and condos
Median number of rooms in apartments
Median number of bedrooms in owner occupied houses
Mean number of bedrooms in owner occupied houses
Median number of bedrooms in renter occupied houses
Mean number of bedrooms in renter occupied houses
Median number of vehichles in owner occupied houses
Mean number of vehichles in owner occupied houses
Median number of vehichles in renter occupied houses
Mean number of vehichles in renter occupied houses
Rooms in owner-occupied houses - 1 room (%)
Rooms in owner-occupied houses - 2 rooms (%)
Rooms in owner-occupied houses - 3 rooms (%)
Rooms in owner-occupied houses - 4 rooms (%)
Rooms in owner-occupied houses - 5 rooms (%)
Rooms in owner-occupied houses - 6 rooms (%)
Rooms in owner-occupied houses - 7 rooms (%)
Rooms in owner-occupied houses - 8 rooms (%)
Rooms in owner-occupied houses - 9+ rooms (%)
Rooms in renter-occupied houses - 1 room (%)
Rooms in renter-occupied houses - 2 rooms (%)
Rooms in renter-occupied houses - 3 rooms (%)
Rooms in renter-occupied houses - 4 rooms (%)
Rooms in renter-occupied houses - 5 rooms (%)
Rooms in renter-occupied houses - 6 rooms (%)
Rooms in renter-occupied houses - 7 rooms (%)
Rooms in renter-occupied houses - 8 rooms (%)
Rooms in renter-occupied houses - 9+ rooms (%)
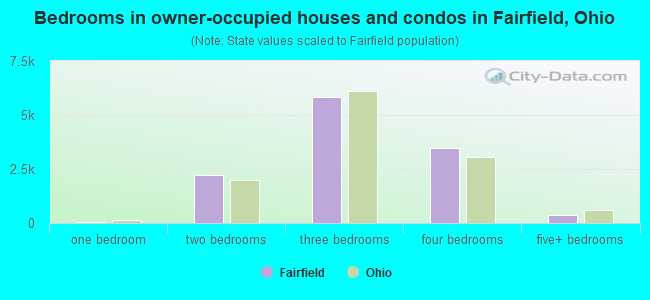
Bedrooms in owner-occupied houses - no bedrooms (%)
Bedrooms in owner-occupied houses - 1 bedroom (%)
Bedrooms in owner-occupied houses - 2 bedrooms (%)
Bedrooms in owner-occupied houses - 3 bedrooms (%)
Bedrooms in owner-occupied houses - 4 bedrooms (%)
Bedrooms in owner-occupied houses - 5+ bedrooms (%)
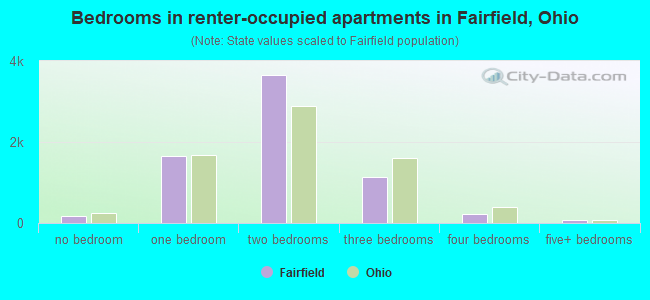
Bedrooms in renter-occupied houses - no bedrooms (%)
Bedrooms in renter-occupied houses - 1 bedroom (%)
Bedrooms in renter-occupied houses - 2 bedrooms (%)
Bedrooms in renter-occupied houses - 3 bedrooms (%)
Bedrooms in renter-occupied houses - 4 bedrooms (%)
Bedrooms in renter-occupied houses - 5+ bedrooms (%)
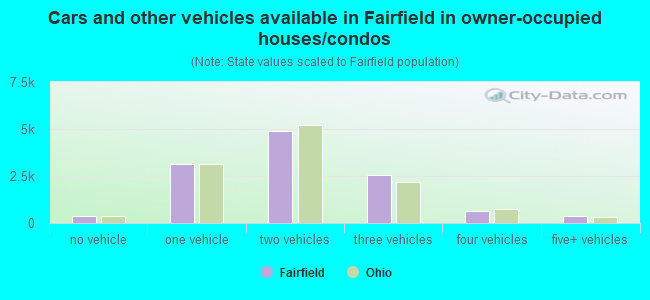
Vehicles available in owner-occupied houses - no vehicle available (%)
Vehicles available in owner-occupied houses - 1 vehicle available(%)
Vehicles available in owner-occupied houses - 2 Vehicles available (%)
Vehicles available in owner-occupied houses - 3 Vehicles available (%)
Vehicles available in owner-occupied houses - 4 Vehicles available (%)
Vehicles available in owner-occupied houses - 5+ Vehicles available (%)
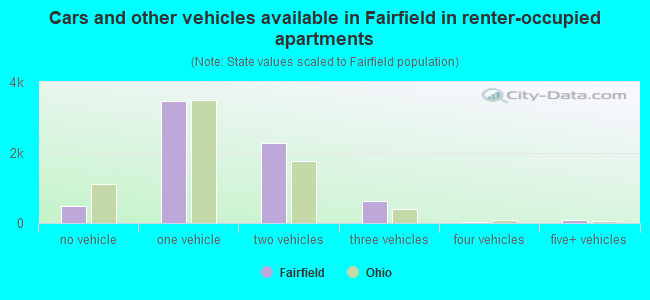
Vehicles available in renter-occupied houses - no vehicle available (%)
Vehicles available in renter-occupied houses - 1 vehicle available (%)
Vehicles available in renter-occupied houses - 2 Vehicles available (%)
Vehicles available in renter-occupied houses - 3 Vehicles available (%)
Vehicles available in renter-occupied houses - 4 Vehicles available (%)
Vehicles available in renter-occupied houses - 5+ Vehicles available (%)
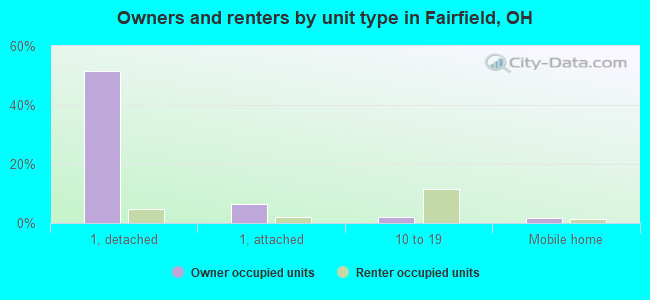
Housing units in structures - 1, detached (%)
Housing units in structures - 1, attached (%)
Housing units in structures - 2 (%)
Housing units in structures - 3 or 4 (%)
Housing units in structures - 5 to 9 (%)
Housing units in structures - 10 to 19 (%)
Housing units in structures - 20 to 49 (%)
Housing units in structures - 50 or more (%)
Housing units in structures - Mobile home (%)
Housing units in structures - Boat, RV, van, etc. (%)
Housing units in structures - Owners - 1, detached (%)
Housing units in structures - Owners - 1, attached (%)
Housing units in structures - Owners - 2 (%)
Housing units in structures - Owners - 3 or 4 (%)
Housing units in structures - Owners - 5 to 9 (%)
Housing units in structures - Owners - 10 to 19 (%)
Housing units in structures - Owners - 20 to 49 (%)
Housing units in structures - Owners - 50 or more (%)
Housing units in structures - Owners - Mobile home (%)
Housing units in structures - Owners - Boat, RV, van, etc. (%)
Housing units in structures - Renters - 1, detached (%)
Housing units in structures - Renters - 1, attached (%)
Housing units in structures - Renters - 2 (%)
Housing units in structures - Renters - 3 or 4 (%)
Housing units in structures - Renters - 5 to 9 (%)
Housing units in structures - Renters - 10 to 19 (%)
Housing units in structures - Renters - 20 to 49 (%)
Housing units in structures - Renters - 50 or more (%)
Housing units in structures - Renters - Mobile home (%)
Housing units in structures - Renters - Boat, RV, van, etc. (%)
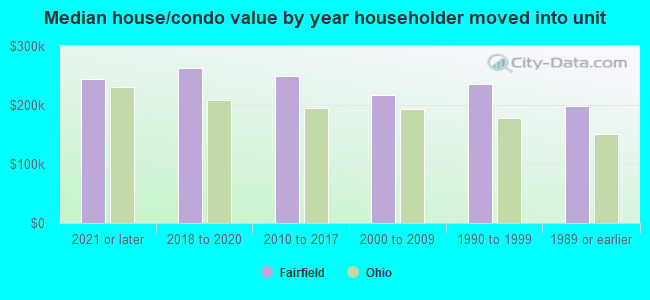
House/condo owner moved in on average (years ago)
Renter moved in on average (years ago)
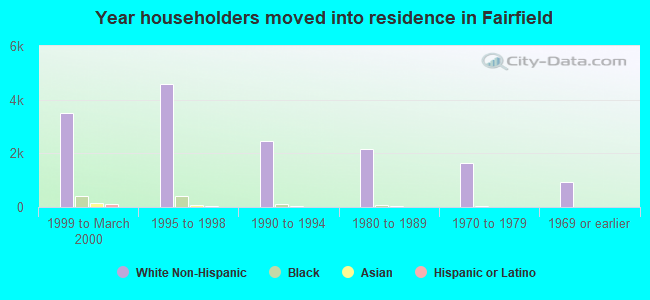
Year householder moved into unit - Moved in 1999 to March 2000 (%)
Year householder moved into unit - Moved in 1999 to March 2000 (%) - White
Year householder moved into unit - Moved in 1999 to March 2000 (%) - Black or African American
Year householder moved into unit - Moved in 1999 to March 2000 (%) - Asian
Year householder moved into unit - Moved in 1999 to March 2000 (%) - Hispanic or Latino
Year householder moved into unit - Moved in 1999 to March 2000 (%) - American Indian and Alaska Native
Year householder moved into unit - Moved in 1999 to March 2000 (%) - Multirace
Year householder moved into unit - Moved in 1999 to March 2000 (%) - Other Race
Year householder moved into unit - Moved in 1995 to 1998 (%)
Year householder moved into unit - Moved in 1995 to 1998 (%) - White
Year householder moved into unit - Moved in 1995 to 1998 (%) - Black or African American
Year householder moved into unit - Moved in 1995 to 1998 (%) - Asian
Year householder moved into unit - Moved in 1995 to 1998 (%) - Hispanic or Latino
Year householder moved into unit - Moved in 1995 to 1998 (%) - American Indian and Alaska Native
Year householder moved into unit - Moved in 1995 to 1998 (%) - Multirace
Year householder moved into unit - Moved in 1995 to 1998 (%) - Other Race
Year householder moved into unit - Moved in 1990 to 1994 (%)
Year householder moved into unit - Moved in 1990 to 1994 (%) - White
Year householder moved into unit - Moved in 1990 to 1994 (%) - Black or African American
Year householder moved into unit - Moved in 1990 to 1994 (%) - Asian
Year householder moved into unit - Moved in 1990 to 1994 (%) - Hispanic or Latino
Year householder moved into unit - Moved in 1990 to 1994 (%) - American Indian and Alaska Native
Year householder moved into unit - Moved in 1990 to 1994 (%) - Multirace
Year householder moved into unit - Moved in 1990 to 1994 (%) - Other Race
Year householder moved into unit - Moved in 1980 to 1989 (%)
Year householder moved into unit - Moved in 1980 to 1989 (%) - White
Year householder moved into unit - Moved in 1980 to 1989 (%) - Black or African American
Year householder moved into unit - Moved in 1980 to 1989 (%) - Asian
Year householder moved into unit - Moved in 1980 to 1989 (%) - Hispanic or Latino
Year householder moved into unit - Moved in 1980 to 1989 (%) - American Indian and Alaska Native
Year householder moved into unit - Moved in 1980 to 1989 (%) - Multirace
Year householder moved into unit - Moved in 1980 to 1989 (%) - Other Race
Year householder moved into unit - Moved in 1970 to 1979 (%)
Year householder moved into unit - Moved in 1970 to 1979 (%) - White
Year householder moved into unit - Moved in 1970 to 1979 (%) - Black or African American
Year householder moved into unit - Moved in 1970 to 1979 (%) - Asian
Year householder moved into unit - Moved in 1970 to 1979 (%) - Hispanic or Latino
Year householder moved into unit - Moved in 1970 to 1979 (%) - American Indian and Alaska Native
Year householder moved into unit - Moved in 1970 to 1979 (%) - Multirace
Year householder moved into unit - Moved in 1970 to 1979 (%) - Other Race
Year householder moved into unit - Moved in 1969 or earlier (%)
Year householder moved into unit - Moved in 1969 or earlier (%) - White
Year householder moved into unit - Moved in 1969 or earlier (%) - Black or African American
Year householder moved into unit - Moved in 1969 or earlier (%) - Asian
Year householder moved into unit - Moved in 1969 or earlier (%) - Hispanic or Latino
Year householder moved into unit - Moved in 1969 or earlier (%) - American Indian and Alaska Native
Year householder moved into unit - Moved in 1969 or earlier (%) - Multirace
Year householder moved into unit - Moved in 1969 or earlier (%) - Other Race
Housing units lacking complete plumbing facilities (%)
Housing units lacking complete kitchen facilities (%)
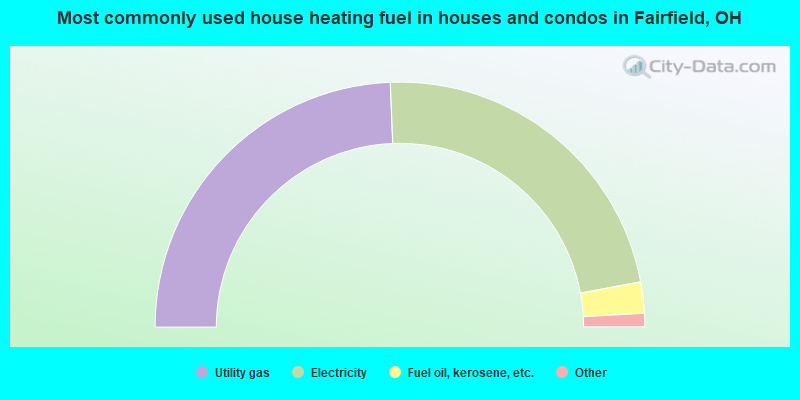
House heating fuel used in houses and condos - Utility gas (%)
House heating fuel used in houses and condos - Bottled, tank, or LP gas (%)
House heating fuel used in houses and condos - Electricity (%)
House heating fuel used in houses and condos - Fuel oil, kerosene, etc. (%)
House heating fuel used in houses and condos - Coal or coke (%)
House heating fuel used in houses and condos - Wood (%)
House heating fuel used in houses and condos - Solar energy (%)
House heating fuel used in houses and condos - Other fuel (%)
House heating fuel used in houses and condos - No fuel used (%)
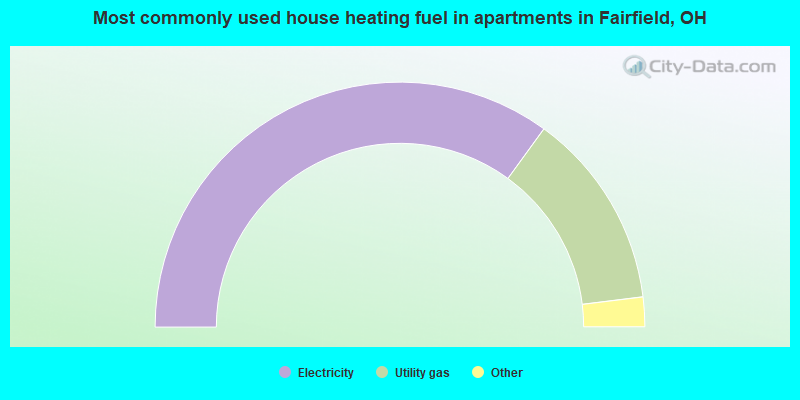
House heating fuel used in apartments - Utility gas (%)
House heating fuel used in apartments - Bottled, tank, or LP gas (%)
House heating fuel used in apartments - Electricity (%)
House heating fuel used in apartments - Fuel oil, kerosene, etc. (%)
House heating fuel used in apartments - Coal or coke (%)
House heating fuel used in apartments - Wood (%)
House heating fuel used in apartments - Solar energy (%)
House heating fuel used in apartments - Other fuel (%)
House heating fuel used in apartments - No fuel used (%)
Latest news about housing in Fairfield, OH collected exclusively by city-data.com from local newspapers, TV, and radio stations
Median year house/condo built: 1979Median year apartment built: 1979Household type by relationship:
Households: 44,612
Male householders: 9,063 (2,498 living alone ), Female householders: 9,324 (3,437 living alone )8,247 spouses (8,211 opposite-sex spouses ), 982 unmarried partners , (971 opposite-sex unmarried partners ), 13,051 children (12,370 natural , 102 adopted , 578 stepchildren ), 614 grandchildren , 609 brothers or sisters , 879 parents , 88 foster children , 407 other relatives , 789 non-relatives In group quarters: 557
Size of family households: 5,728 2-persons , 2,921 3-persons , 1,886 4-persons , 1,202 5-persons , 179 6-persons , 178 7-or-more-persons .
Size of nonfamily households: 5,643 1-person , 970 2-persons , 21 3-persons , 9 6-persons .
6,127 married couples with children. single-parent households (539 men , 2,420 women ).
83.6% of residents of Fairfield speak English at home. of residents speak Spanish at home (45% speak English very well , 30% speak English well , 19% speak English not well , 5% don't speak English at all ).of residents speak other Indo-European language at home (32% speak English very well , 30% speak English well , 34% speak English not well , 4% don't speak English at all ).of residents speak Asian or Pacific Island language at home (22% speak English very well , 62% speak English well , 16% speak English not well , 1% don't speak English at all ).of residents speak other language at home (60% speak English very well , 25% speak English well , 15% speak English not well ).
Foreign born population: 5,777 (12.9%)of them are naturalized citizens )
Median number of rooms in houses and condos:
Median number of rooms in apartments
Owner-occupied Renter-occupied
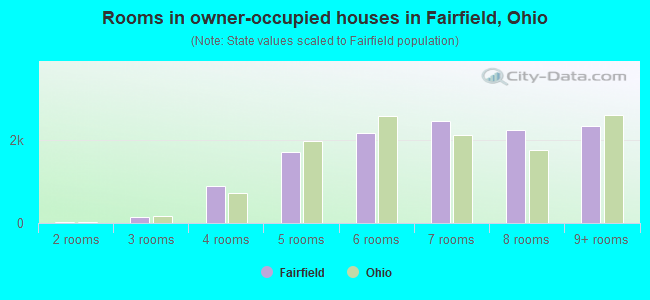
Rooms in owner-occupied houses in Fairfield, Ohio
0 1 room 23 2 rooms 133 3 rooms 882 4 rooms 1,717 5 rooms 2,166 6 rooms 2,455 7 rooms 2,241 8 rooms 2,338 9+ rooms
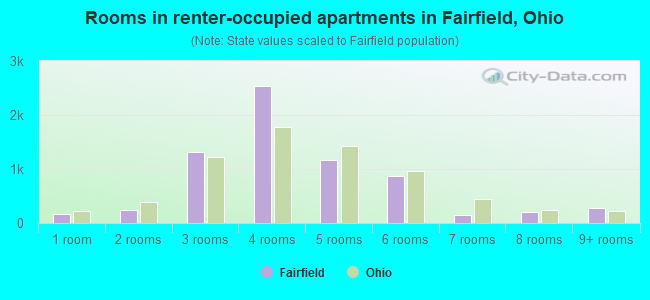
Rooms in renter-occupied apartments in Fairfield, Ohio
164 1 room 235 2 rooms 1,311 3 rooms 2,532 4 rooms 1,159 5 rooms 867 6 rooms 151 7 rooms 207 8 rooms 276 9+ rooms
Fairfield, OH household income distribution 830 Less than $10,000869 $10,000 to $19,9991,400 $20,000 to $29,9992,050 $30,000 to $39,9991,584 $40,000 to $49,9991,777 $50,000 to $59,9992,003 $60,000 to $74,9992,596 $75,000 to $99,9991,665 $100,000 to $124,9991,302 $125,000 to $149,9991,718 $150,000 to $199,9991,151 $200,000 or more
Home value of owner - occupied houses in 2022 in Fairfield, OH 373 Less than $10,00082 $15,000 to $19,99915 $25,000 to $29,99929 $40,000 to $49,99946 $50,000 to $59,999160 $60,000 to $69,99929 $70,000 to $79,999147 $80,000 to $89,999142 $90,000 to $99,999381 $100,000 to $124,9991,176 $125,000 to $149,9991,310 $150,000 to $174,9991,318 $175,000 to $199,9992,088 $200,000 to $249,9991,319 $250,000 to $299,9991,313 $300,000 to $399,999198 $400,000 to $499,999242 $500,000 to $749,99913 $750,000 to $999,99912 $1,000,000 to $1,499,999Rent paid by renters in 2022 in Fairfield, OH 11 $100 to $1494 $150 to $19951 $200 to $2496 $250 to $299159 $300 to $34940 $350 to $399168 $400 to $44952 $450 to $49962 $500 to $549224 $550 to $599185 $600 to $64967 $650 to $699353 $700 to $749206 $750 to $799948 $800 to $8991,312 $900 to $9991,368 $1,000 to $1,249525 $1,250 to $1,499155 $1,500 to $1,99941 $2,000 to $2,499340 No cash rent
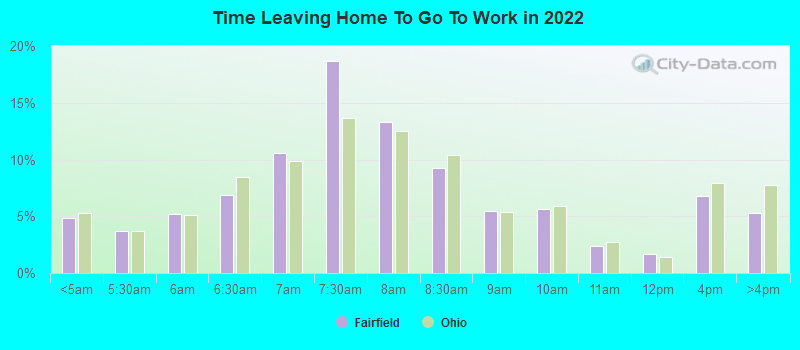
Percentage of workers working in this county: 57.1%Number of people working at home: 2,411 (10.5% of all workers )
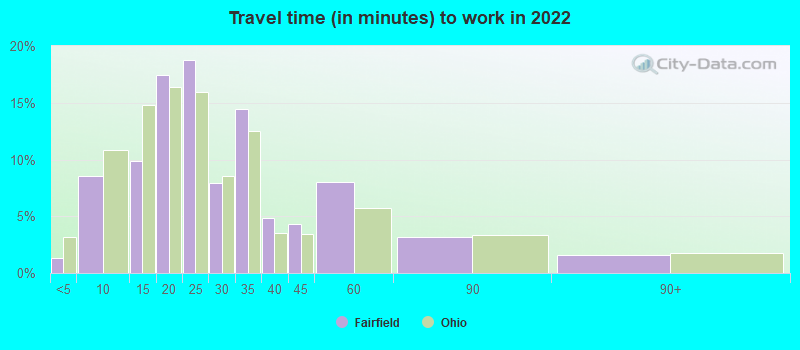
Travel time to work (commute)
Less than 5 minutes: 3285 to 9 minutes: 2,30510 to 14 minutes: 2,74515 to 19 minutes: 3,34720 to 24 minutes: 3,21525 to 29 minutes: 1,85630 to 34 minutes: 3,20535 to 39 minutes: 84040 to 44 minutes: 68045 to 59 minutes: 1,19760 to 89 minutes: 19090 or more minutes: 263
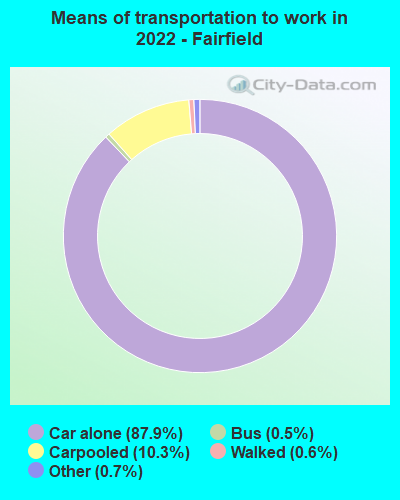
Means of transportation to work:
Drove a car alone: 23,956 (78.1%)Carpooled: 3,061 (10.0%)Bus : 98 (0.3%)Taxi: 400 (1.3%)Bicycle: 19 (0.1%)Walked: 157 (0.5%)Worked at home: 2,411 (7.9%)
Unemployment by race in 2022
Unemployment rate for White non-Hispanic residents 4.8% Males3.2% FemalesUnemployment rate for Black residents 2.3% Males1.2% FemalesUnemployment rate for Asian residents 33.3% Males37.8% FemalesUnemployment rate for other race residents 2.0% FemalesUnemployment rate for two or more race residents 1.0% Males14.4% FemalesUnemployment rate for Hispanic or Latino residents 1.6% Females
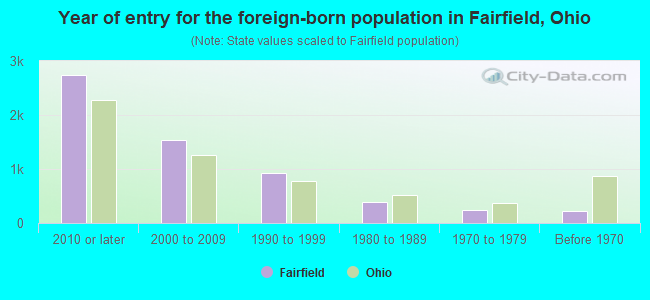
Year of entry for the foreign-born population in Fairfield, Ohio
2,748 2010 or later 1,544 2000 to 2009 923 1990 to 1999 382 1980 to 1989 249 1970 to 1979 229 Before 1970
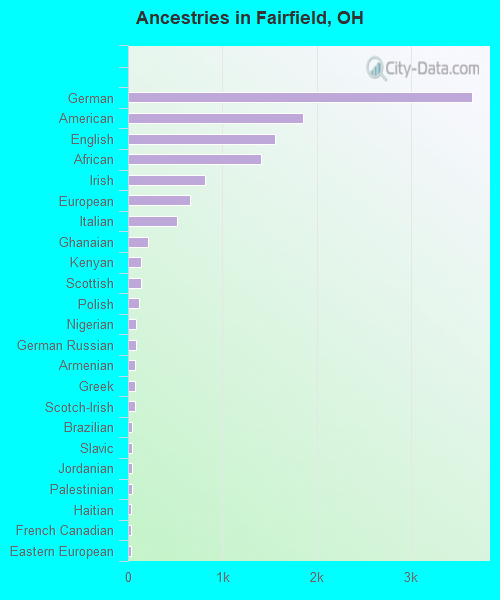
First ancestries reported:
German: 3,645 (13.4%)
American: 1,856 (6.8%)
English: 1,563 (5.7%)
African: 1,415 (5.2%)
Irish: 817 (3.0%)
European: 662 (2.4%)
Italian: 524 (1.9%)
Ghanaian: 212 (0.8%)
Kenyan: 142 (0.5%)
Scottish: 141 (0.5%)
Polish: 118 (0.4%)
Nigerian: 90 (0.3%)
German Russian: 81 (0.3%)
Armenian: 75 (0.3%)
Greek: 73 (0.3%)
Scotch-Irish: 71 (0.3%)
Brazilian: 47 (0.2%)
Slavic: 45 (0.2%)
Jordanian: 39 (0.1%)
Palestinian: 39 (0.1%)
Haitian: 37 (0.1%)
French Canadian: 36 (0.1%)
Eastern European: 35 (0.1%)
Danish: 32 (0.1%)
Welsh: 31 (0.1%)
Russian: 28 (0.1%)
Czech: 27 (0.10%)
British: 27 (0.10%)
Dutch: 26 (0.10%)
Portuguese: 24 (0.09%)
French: 20 (0.07%)
Austrian: 20 (0.07%)
Yugoslavian: 20 (0.07%)
Slovak: 19 (0.07%)
Swiss: 16 (0.06%)
Trinidadian and Tobagonian: 12 (0.04%)
Ukrainian: 10 (0.04%)
Norwegian: 9 (0.03%)
Hungarian: 9 (0.03%)
Arab: 8 (0.03%)
Lithuanian: 6 (0.02%) Most common places of birth for foreign-born residents (%): Mexico Fairfield:
12.6% (692)Ohio:
7.8% (44,796)
Ghana Fairfield:
11.1% (607)Ohio:
1.8% (10,561)
Africa, n.e.c. Fairfield:
10.3% (564)Ohio:
1.1% (6,096)
Nepal Fairfield:
9.6% (525)Ohio:
1.9% (10,777)
Cambodia Fairfield:
6.5% (359)Ohio:
0.5% (2,620)
Bhutan Fairfield:
3.9% (215)Ohio:
2.4% (13,773)
Cameroon Fairfield:
3.9% (212)Ohio:
0.5% (2,773)
Dominican Republic Fairfield:
3.4% (188)Ohio:
1.1% (6,549)
China, excluding Hong Kong and Taiwan Fairfield:
3.2% (174)Ohio:
6.2% (35,703)
South Africa Fairfield:
2.9% (162)Ohio:
0.4% (2,071)
Cuba Fairfield:
2.7% (146)Ohio:
0.4% (2,031)
Vietnam Fairfield:
2.5% (139)Ohio:
1.9% (10,960)
Guatemala Fairfield:
2.3% (124)Ohio:
1.6% (9,312)
Peru Fairfield:
2.1% (113)Ohio:
0.6% (3,210)
Asia, n.e.c. Fairfield:
1.6% (87)Ohio:
0.5% (2,826)
Kenya Fairfield:
1.5% (83)Ohio:
1.0% (5,674)
Place of birth for U.S.-born residents:
This state: 30,418Other state: 8,138Northeast: 1,239Midwest: 2,573South: 3,631West: 690 91.0% of Fairfield residents lived in the same house 1 years ago.
Out of people who lived in different houses, 31.1% lived in this county.
Out of people who lived in different counties, 78.5% lived in Ohio.
Fairfield:
91.0%State average:
87.8%
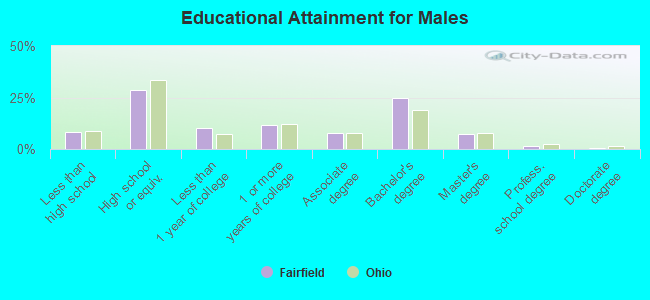
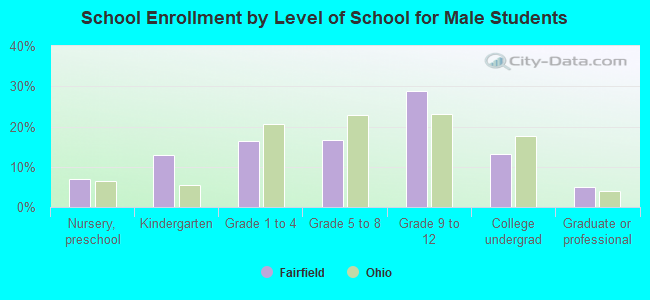
Education attainment for males 25 years and older:
No schooling: 410Nursery to 4th grade: 135th and 6th grade: 577th and 8th grade: 559th grade: 8710th grade: 11311th grade: 6212th grade, no diploma: 392High school graduate (or equivalency): 4,157Less than 1 year of college: 1,468Some college more than 1 year, no degree: 1,686Associate degree: 1,157Bachelor's degree: 3,568Master's degree: 1,038Professional school degree: 179Doctorate degree: 94
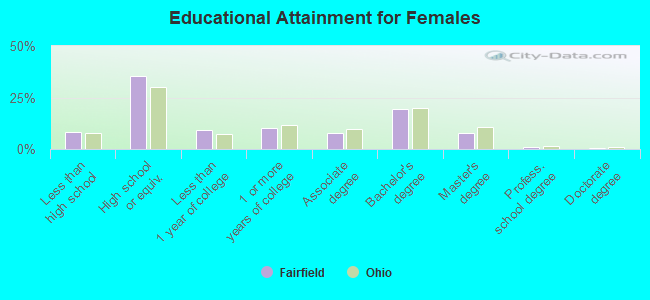
Education attainment for females 25 years and older:
No schooling: 482Nursery to 4th grade: 665th and 6th grade: 877th and 8th grade: 1179th grade: 5410th grade: 11011th grade: 17112th grade, no diploma: 298High school graduate (or equivalency): 5,817Less than 1 year of college: 1,549Some college more than 1 year, no degree: 1,653Associate degree: 1,296Bachelor's degree: 3,236Master's degree: 1,296Professional school degree: 135Doctorate degree: 100
Housing units in structures:
One, detached: 11,059One, attached: 1,409Two: 4793 or 4: 8175 to 9: 1,64910 to 19: 2,88020 to 49: 32250 or more: 503Mobile homes: 565Median worth of mobile homes: $6,710
Housing units lacking complete plumbing facilities in 2022: 0.3%Housing units lacking complete kitchen facilities in 2022: 1.1%House/condo owner moved in on average 13 years ago
Renter moved in on average 2 years ago
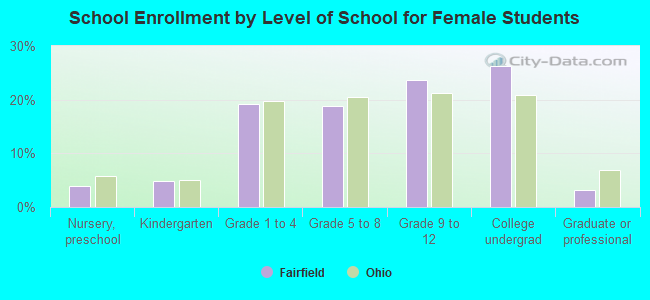
Private vs. public school enrollment:
Students in private schools in grades 1 to 8 (elementary and middle school): 593 Students in private schools in grades 9 to 12 (high school): 222 Students in private undergraduate colleges: 271