Ferry Pass, FL (Florida) Houses and Residents
| Ferry Pass: | $253,606 |
| Florida: | $354,100 |
Mean price in 2022:
Detached houses: $268,142
Here: $268,142 State: $500,941 Townhouses or other attached units: $152,821
Here: $152,821 State: $370,869 In 2-unit structures: $153,124
Here: $153,124 State: $423,188 In 3-to-4-unit structures: $119,330
Here: $119,330 State: $309,944 In 5-or-more-unit structures: $146,859
Here: $146,859 State: $447,145 Mobile homes: $85,639
Here: $85,639 State: $113,202
Total population: 28,921 (Urban population: 27,175, Rural population: 0)
Houses: 14,578 (13,527 occupied: 6,265 owner occupied, 7,715 renter occupied)
| % of renters here: | 55% |
| State: | 33% |
Housing density: 1,035 houses/condos per square mile
Median price asked for vacant for-sale houses and condos in 2022: $710,537.
Median contract rent in 2022: $1,152 (lower quartile is $891, upper quartile is $1,577)
Median rent asked for vacant for-rent units in 2022: $1,677
Median gross rent in Ferry Pass, FL in 2022: $1,308
Housing units in Ferry Pass with a mortgage: 3,751 (189 second mortgage, 0 home equity loan, 181 both second mortgage and home equity loan)
Houses without a mortgage: 124
Median household income for houses/condos with a mortgage: $92,417
Median household income for apartments without a mortgage: $73,457
Median monthly housing costs: $1,226
Compare current foreclosures near Ferry Pass, FL:
| Photo | Address | Area | Beds / Baths | Price | Details |
|---|---|---|---|---|---|

|
#1
Eureka Ln
Pensacola, FL 32526
|
1,191 sq. feet
|
2 baths 3 beds |
$126,400
|
show details |

|
#2
Kalakaua Ct
Gulf Breeze, FL 32563
|
1,512 sq. feet
|
2 baths 3 beds |
$390,000
|
show details |

|
#3
E Cross St
Pensacola, FL 32503
|
2,304 sq. feet
|
2 baths 3 beds |
$750,000
|
show details |

|
#4
E Leonard St
Pensacola, FL 32503
|
1,917 sq. feet
|
2 baths 2 beds |
show details | |

|
#5
Grand Pointe Dr
Gulf Breeze, FL 32563
|
3,901 sq. feet
|
4 baths 4 beds |
show details | |

|
#6
Parker Rd
Cantonment, FL 32533
|
1,050 sq. feet
|
1 baths 3 beds |
show details | |

|
#7
Stennis Dr
Pensacola, FL 32506
|
2,710 sq. feet
|
3 baths 4 beds |
show details | |

|
#8
N Hwy 87
Milton, FL 32570
|
1,316 sq. feet
|
2 baths 3 beds |
show details | |

|
#9
Seminole Rd W
Seminole, AL 36574
|
1,373 sq. feet
|
2 baths 3 beds |
show details | |

|
#10
Cottage Woods Dr
Milton, FL 32570
|
1,684 sq. feet
|
2 baths 3 beds |
show details |
| Photo | Address | Area | Beds / Baths | Price | Details |
|---|---|---|---|---|---|

|
#11
Cindy Ln
Milton, FL 32570
|
2,277 sq. feet
|
2 baths 4 beds |
show details | |

|
#12
E Avenida De Golf
Milton, FL 32571
|
1,404 sq. feet
|
2 baths 3 beds |
show details | |

|
#13
Keyser Ln
Milton, FL 32571
|
- sq. feet
|
2 baths 3 beds |
show details | |

|
#14
Acy Lowery Rd
Milton, FL 32571
|
3,372 sq. feet
|
4 baths 6 beds |
show details | |

|
#15
Marietta Ave
Pensacola, FL 32507
|
1,130 sq. feet
|
2 baths 2 beds |
show details | |

|
#16
Barbara Ln
Milton, FL 32570
|
1,861 sq. feet
|
2 baths 3 beds |
show details | |

|
#17
Glover Ln
Milton, FL 32570
|
1,080 sq. feet
|
1 baths 2 beds |
show details | |

|
#18
Princeton Dr
Gulf Breeze, FL 32563
|
1,516 sq. feet
|
2 baths 3 beds |
show details | |

|
#19
Bishop Rd
Milton, FL 32570
|
1,015 sq. feet
|
1 baths 3 beds |
show details | |

|
#20
Westport Dr
Milton, FL 32570
|
1,445 sq. feet
|
2 baths 3 beds |
show details |
| Photo | Address | Area | Beds / Baths | Price | Details |
|---|---|---|---|---|---|

|
#21
Swanner Rd
Milton, FL 32570
|
1,732 sq. feet
|
2 baths 3 beds |
show details | |

|
#22
Kauai Ct
Gulf Breeze, FL 32563
|
2,621 sq. feet
|
2 baths 4 beds |
show details | |

|
#23
Jacaranda Trce
Milton, FL 32583
|
1,721 sq. feet
|
2 baths 4 beds |
show details | |

|
#24
Oak Ridge Dr
Gulf Breeze, FL 32563
|
1,693 sq. feet
|
2 baths 3 beds |
show details | |

|
#25
Berry Cir
Milton, FL 32571
|
1,713 sq. feet
|
2 baths 3 beds |
show details | |

|
#26
Tom Sawyer Rd
Milton, FL 32583
|
1,836 sq. feet
|
2 baths 3 beds |
show details | |

|
#27
Cromwell Dr
Milton, FL 32571
|
3,036 sq. feet
|
3 baths 4 beds |
show details | |

|
#28
Essex Terrace Cir
Milton, FL 32571
|
2,404 sq. feet
|
3 baths 4 beds |
show details | |

|
#29
New Abbey Ln
Milton, FL 32583
|
2,307 sq. feet
|
2 baths 3 beds |
show details | |

|
#30
Dowdy Dr
Pensacola, FL 32506
|
2,119 sq. feet
|
2 baths - beds |
show details |
| Photo | Address | Area | Beds / Baths | Price | Details |
|---|---|---|---|---|---|

|
#31
Berry Patch Ln
Milton, FL 32571
|
1,815 sq. feet
|
2 baths 3 beds |
show details | |

|
#32
Ridge Pointe Dr
Milton, FL 32571
|
1,715 sq. feet
|
2 baths 3 beds |
show details | |

|
#33
Victory Dr
Milton, FL 32571
|
2,266 sq. feet
|
2 baths 3 beds |
show details | |

|
#34
Pine Ln
Milton, FL 32571
|
1,485 sq. feet
|
2 baths 3 beds |
show details | |

|
#35
Oneida Trl
Milton, FL 32583
|
1,944 sq. feet
|
2 baths 3 beds |
show details | |

|
#36
Rosewood Creek Dr
Milton, FL 32571
|
1,783 sq. feet
|
2 baths 4 beds |
show details | |

|
#37
Bell Ln
Milton, FL 32571
|
1,685 sq. feet
|
1 baths 3 beds |
show details | |

|
#38
Bayside Blvd
Milton, FL 32583
|
1,766 sq. feet
|
2 baths 3 beds |
show details | |

|
#39
E Spencer Field Rd
Milton, FL 32571
|
2,484 sq. feet
|
3 baths 4 beds |
show details | |

|
#40
Chantilly Cir
Milton, FL 32583
|
1,535 sq. feet
|
2 baths 3 beds |
show details |
| Photo | Address | Area | Beds / Baths | Price | Details |
|---|---|---|---|---|---|

|
#41
Cactus Dr
Milton, FL 32583
|
1,809 sq. feet
|
2 baths 3 beds |
show details | |

|
#42
Greenfield St
Milton, FL 32571
|
2,994 sq. feet
|
3 baths 4 beds |
show details | |

|
#43
Jones St
Milton, FL 32570
|
1,288 sq. feet
|
2 baths 3 beds |
show details | |

|
#44
Southwind Dr
Gulf Breeze, FL 32563
|
1,252 sq. feet
|
2 baths 3 beds |
show details | |

|
#45
Kee Ave
Lillian, AL 36549
|
1,530 sq. feet
|
1 baths 3 beds |
show details | |

|
#46
Dixie Rd
Milton, FL 32570
|
2,035 sq. feet
|
2 baths 3 beds |
show details | |

|
#47
Trammel Dr
Milton, FL 32570
|
1,438 sq. feet
|
2 baths 3 beds |
show details | |

|
#48
Well Line Rd
Cantonment, FL 32533
|
1,658 sq. feet
|
2 baths - beds |
show details | |

|
#49
Wilmar Ave
Milton, FL 32570
|
1,300 sq. feet
|
1 baths 3 beds |
show details | |

|
Check over 1 million property listings on Foreclosure.com!
|
browse all offers | |||


 | Pensacola/Pace housing (0 replies) |
| Milton/Pace Area - Why so cheap? (7 replies) |
| DECISIONS, Decisions! Pensacola or Sarasota for retirement (16 replies) |
| Relocating to Pensacola from New Orleans (5 replies) |

Median year apartment built: 1991
Household type by relationship:
Households: 32,808- Male householders: 5,515 (1,938 living alone), Female householders: 7,855 (3,042 living alone)
4,689 spouses (4,656 opposite-sex spouses), 975 unmarried partners, (924 opposite-sex unmarried partners), 6,909 children (6,462 natural, 141 adopted, 305 stepchildren), 569 grandchildren, 506 brothers or sisters, 140 parents, 8 foster children, 288 other relatives, 1,899 non-relatives
- In group quarters: 3,450
Size of family households: 4,062 2-persons, 1,368 3-persons, 1,239 4-persons, 598 5-persons, 87 6-persons, 17 7-or-more-persons.
Size of nonfamily households: 5,537 1-person, 867 2-persons, 145 3-persons, 124 4-persons, 24 5-persons.
2,366 married couples with children.
2,328 single-parent households (530 men, 1,798 women).
91.2% of residents of Ferry Pass speak English at home.
5.1% of residents speak Spanish at home (33% speak English very well, 42% speak English well, 17% speak English not well, 7% don't speak English at all).
2.1% of residents speak other Indo-European language at home (90% speak English very well, 5% speak English well, 5% speak English not well).
1.0% of residents speak Asian or Pacific Island language at home (62% speak English very well, 30% speak English well, 4% speak English not well, 3% don't speak English at all).
0.4% of residents speak other language at home (100% speak English very well).
Foreign born population: 1,674 (5.1%)
(38.2% of them are naturalized citizens)
| Here: | 6.3 |
| State: | 5.9 |
| Here: | 4.0 |
| State: | 4.2 |

- Bedrooms in owner-occupied houses and condos in Ferry Pass, Florida
- 40no bedroom
- 921 bedroom
- 8452 bedrooms
- 3,7663 bedrooms
- 1,2004 bedrooms
- 3225+ bedrooms

- Bedrooms in renter-occupied apartments in Ferry Pass, Florida
- 203no bedroom
- 1,4751 bedroom
- 4,0872 bedrooms
- 1,6573 bedrooms
- 2544 bedrooms
- 405+ bedrooms

- Cars and other vehicles available in Ferry Pass in owner-occupied houses/condos
- 162no vehicle
- 1,9701 vehicle
- 2,9482 vehicles
- 9553 vehicles
- 1934 vehicles
- 385+ vehicles

- Cars and other vehicles available in Ferry Pass in renter-occupied apartments
- 1,153no vehicle
- 3,3631 vehicle
- 2,5592 vehicles
- 4753 vehicles
- 844 vehicles
- 825+ vehicles

- Rooms in owner-occupied houses in Ferry Pass, Florida
- 401 room
- 442 rooms
- 1633 rooms
- 5504 rooms
- 1,2735 rooms
- 1,5586 rooms
- 9457 rooms
- 7818 rooms
- 9109+ rooms

- Rooms in renter-occupied apartments in Ferry Pass, Florida
- 1861 room
- 5752 rooms
- 1,3733 rooms
- 2,7814 rooms
- 1,0085 rooms
- 8486 rooms
- 5867 rooms
- 1568 rooms
- 2039+ rooms


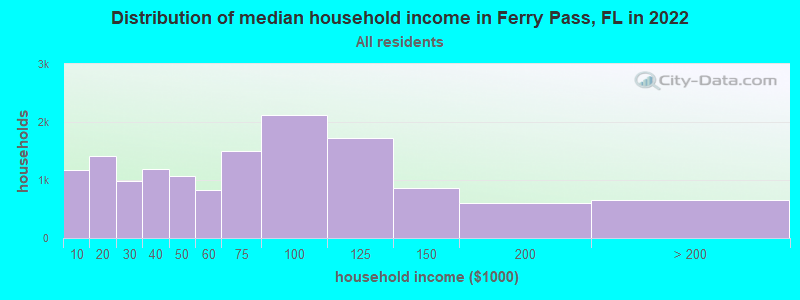
Ferry Pass, FL household income distribution

- 1,166Less than $10,000
- 1,422$10,000 to $19,999
- 988$20,000 to $29,999
- 1,193$30,000 to $39,999
- 1,062$40,000 to $49,999
- 825$50,000 to $59,999
- 1,492$60,000 to $74,999
- 2,126$75,000 to $99,999
- 1,729$100,000 to $124,999
- 870$125,000 to $149,999
- 604$150,000 to $199,999
- 649$200,000 or more
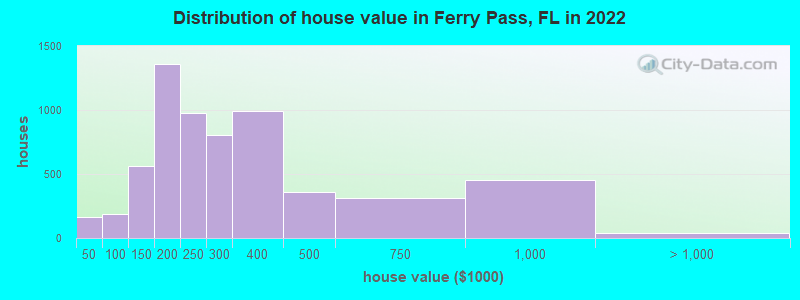
Home value of owner - occupied houses in 2022 in Ferry Pass, FL
-
- 50$10,000 to $14,999
- 83$15,000 to $19,999
- 5$20,000 to $24,999
- 5$30,000 to $34,999
- 4$35,000 to $39,999
- 16$40,000 to $49,999
- 25$60,000 to $69,999
- 66$70,000 to $79,999
- 28$80,000 to $89,999
- 46$90,000 to $99,999
- 291$100,000 to $124,999
- 267$125,000 to $149,999
- 569$150,000 to $174,999
- 789$175,000 to $199,999
- 976$200,000 to $249,999
- 804$250,000 to $299,999
- 992$300,000 to $399,999
- 357$400,000 to $499,999
- 308$500,000 to $749,999
- 453$750,000 to $999,999
- 38$1,000,000 to $1,499,999
Rent paid by renters in 2022 in Ferry Pass, FL
-
- 45Less than $100
- 39$100 to $149
- 273$150 to $199
- 68$200 to $249
- 14$250 to $299
- 58$300 to $349
- 190$350 to $399
- 24$400 to $449
- 14$500 to $549
- 89$550 to $599
- 29$600 to $649
- 199$650 to $699
- 224$700 to $749
- 160$750 to $799
- 637$800 to $899
- 986$900 to $999
- 1,472$1,000 to $1,249
- 1,639$1,250 to $1,499
- 871$1,500 to $1,999
- 544$2,000 to $2,499
- 169$2,500 to $2,999
- 113$3,000 to $3,499
- 260$3,500 or more
- 137No cash rent


Percentage of workers working in this county: 86.4%
Number of people working at home: 1,687 (10.5% of all workers)
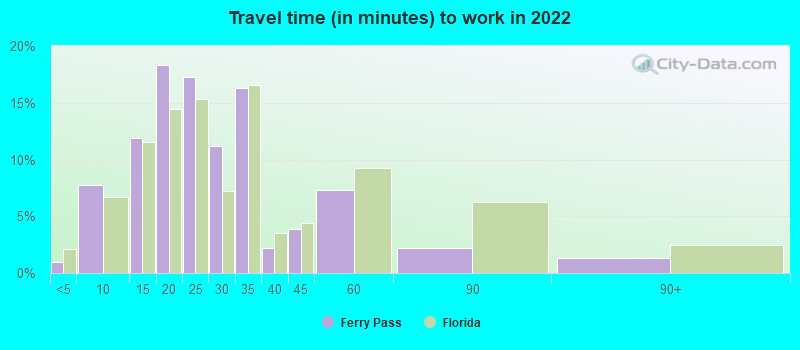
Travel time to work (commute)
- Less than 5 minutes: 297
- 5 to 9 minutes: 1,561
- 10 to 14 minutes: 2,303
- 15 to 19 minutes: 3,126
- 20 to 24 minutes: 2,175
- 25 to 29 minutes: 823
- 30 to 34 minutes: 1,871
- 35 to 39 minutes: 533
- 40 to 44 minutes: 313
- 45 to 59 minutes: 498
- 60 to 89 minutes: 478
- 90 or more minutes: 254
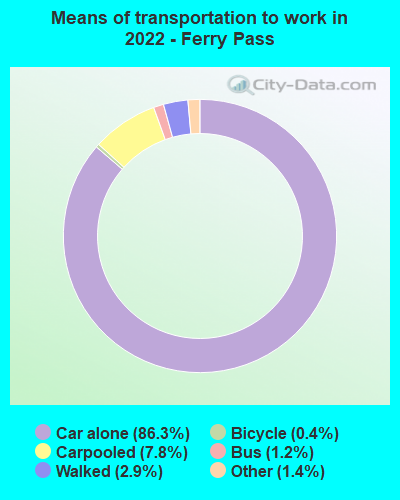
Means of transportation to work:
- Drove a car alone: 14,850 (80.4%)
- Carpooled: 1,115 (6.0%)
- Bus: 168 (0.9%)
- Taxi: 225 (1.2%)
- Bicycle: 32 (0.2%)
- Walked: 299 (1.6%)
- Worked at home: 1,687 (9.1%)

- Unemployment by race in 2022
- Unemployment rate for White non-Hispanic residents
- 3.0%Males
- 5.0%Females
- Unemployment rate for Black residents
- 27.3%Males
- 5.4%Females
- Unemployment rate for Asian residents
- 10.7%Females
- Unemployment rate for other race residents
- 12.0%Males
- Unemployment rate for Hispanic or Latino residents
- 2.5%Males

- Year of entry for the foreign-born population in Ferry Pass, Florida
- 1,0432010 or later
- 3012000 to 2009
- 1011990 to 1999
- 3301980 to 1989
- 1401970 to 1979
- 243Before 1970

First ancestries reported:
- English: 1,879 (11.3%)
- Irish: 1,757 (10.6%)
- German: 1,150 (6.9%)
- American: 1,109 (6.7%)
- European: 722 (4.3%)
- Scotch-Irish: 361 (2.2%)
- Scottish: 299 (1.8%)
- Italian: 236 (1.4%)
- African: 223 (1.3%)
- French: 169 (1.0%)
- Polish: 142 (0.9%)
- Haitian: 138 (0.8%)
- Scandinavian: 135 (0.8%)
- Russian: 96 (0.6%)
- Hungarian: 83 (0.5%)
- French Canadian: 80 (0.5%)
- Brazilian: 78 (0.5%)
- Norwegian: 72 (0.4%)
- Swedish: 64 (0.4%)
- Belgian: 62 (0.4%)
- Jamaican: 62 (0.4%)
- Ghanaian: 50 (0.3%)
- Czech: 50 (0.3%)
- Lithuanian: 48 (0.3%)
- Romanian: 41 (0.2%)
- Croatian: 37 (0.2%)
- Danish: 35 (0.2%)
- British: 32 (0.2%)
- Eastern European: 24 (0.1%)
- Dutch: 21 (0.1%)
- Iranian: 17 (0.1%)
- Greek: 17 (0.1%)
- Moroccan: 12 (0.07%)
- Egyptian: 11 (0.07%)
- Austrian: 11 (0.07%)
- Cajun: 11 (0.07%)
- Maltese: 11 (0.07%)
- Portuguese: 9 (0.05%)
- West Indian: 9 (0.05%)
- Northern European: 7 (0.04%)
- Barbadian: 7 (0.04%)
- Welsh: 7 (0.04%)
- Bahamian: 5 (0.03%)
- Kenyan: 2 (0.01%)
Most common places of birth for foreign-born residents (%):
| Ferry Pass: | 13.5% (229) |
| Florida: | 5.6% (257,152) |
| Ferry Pass: | 10.8% (182) |
| Florida: | 1.8% (84,403) |
| Ferry Pass: | 9.2% (155) |
| Florida: | 2.3% (107,160) |
| Ferry Pass: | 8.2% (138) |
| Florida: | 2.7% (122,906) |
| Ferry Pass: | 7.0% (118) |
| Florida: | 0.2% (10,425) |
| Ferry Pass: | 4.8% (81) |
| Florida: | 7.5% (342,375) |
| Ferry Pass: | 3.8% (64) |
| Florida: | 6.5% (298,669) |
| Ferry Pass: | 3.7% (62) |
| Florida: | 5.7% (262,042) |
| Ferry Pass: | 3.1% (53) |
| Florida: | 5.0% (227,319) |
| Ferry Pass: | 2.7% (45) |
| Florida: | 0.1% (2,904) |
| Ferry Pass: | 2.4% (40) |
| Florida: | 0.8% (37,723) |
| Ferry Pass: | 2.1% (35) |
| Florida: | 2.1% (94,349) |
| Ferry Pass: | 1.9% (32) |
| Florida: | 0.2% (11,000) |
| Ferry Pass: | 1.8% (31) |
| Florida: | 0.6% (25,219) |
| Ferry Pass: | 1.7% (29) |
| Florida: | 0.7% (31,076) |
| Ferry Pass: | 1.6% (27) |
| Florida: | 2.1% (96,693) |
| Ferry Pass: | 1.5% (26) |
| Florida: | 0.2% (10,443) |
Place of birth for U.S.-born residents:
- This state: 14,065
- Other state: 16,474
- Northeast: 2,450
- Midwest: 3,556
- South: 8,651
- West: 1,787
79.8% of Ferry Pass residents lived in the same house 1 years ago.
Out of people who lived in different houses, 33.1% lived in this county.
Out of people who lived in different counties, 37.4% lived in Florida.
| Ferry Pass: | 79.8% |
| State average: | 86.3% |
Education attainment for males 25 years and older:
- No schooling: 127
- Nursery to 4th grade: 0
- 5th and 6th grade: 32
- 7th and 8th grade: 167
- 9th grade: 83
- 10th grade: 173
- 11th grade: 195
- 12th grade, no diploma: 126
- High school graduate (or equivalency): 2,322
- Less than 1 year of college: 396
- Some college more than 1 year, no degree: 1,473
- Associate degree: 1,085
- Bachelor's degree: 1,995
- Master's degree: 914
- Professional school degree: 277
- Doctorate degree: 429

Education attainment for females 25 years and older:
- No schooling: 69
- Nursery to 4th grade: 87
- 5th and 6th grade: 16
- 7th and 8th grade: 59
- 9th grade: 86
- 10th grade: 115
- 11th grade: 91
- 12th grade, no diploma: 12
- High school graduate (or equivalency): 2,834
- Less than 1 year of college: 1,085
- Some college more than 1 year, no degree: 2,099
- Associate degree: 1,034
- Bachelor's degree: 2,630
- Master's degree: 1,496
- Professional school degree: 210
- Doctorate degree: 130


Housing units in structures:
- One, detached: 7,150
- One, attached: 883
- Two: 650
- 3 or 4: 1,256
- 5 to 9: 906
- 10 to 19: 1,653
- 20 to 49: 517
- 50 or more: 1,106
- Mobile homes: 410
- Boats, RVs, vans, etc.: 42
Housing units lacking complete kitchen facilities in 2022: 2.6%
House/condo owner moved in on average 9 years ago
Renter moved in on average 3 years ago

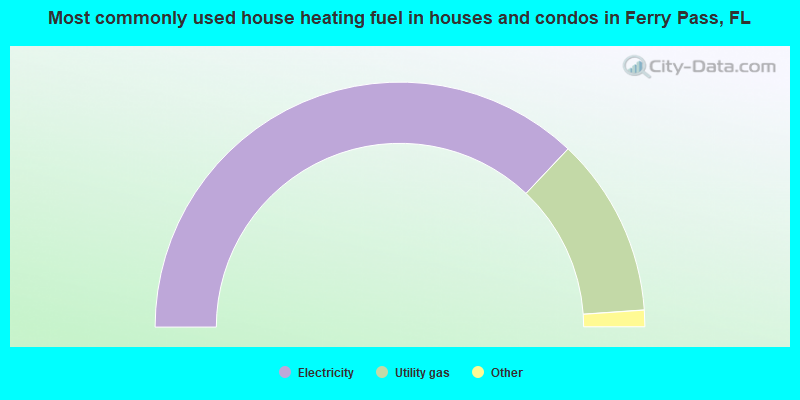
- 74.1%Electricity
- 23.7%Utility gas
- 1.1%Bottled, tank, or LP gas
- 0.6%No fuel used
- 0.2%Solar energy
- 0.2%Other fuel
- 0.1%Wood
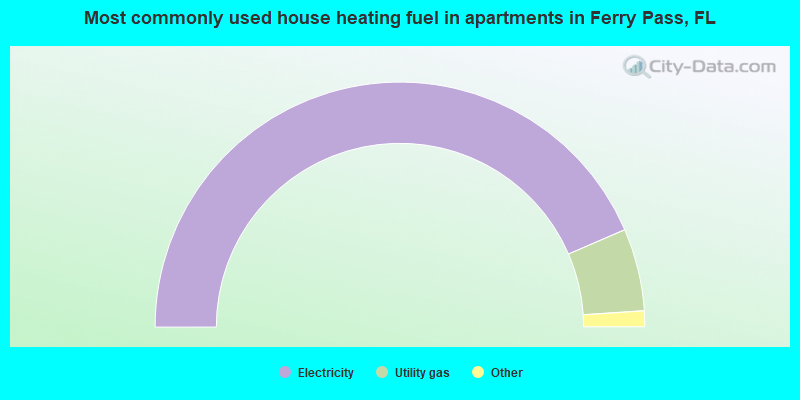
- 87.1%Electricity
- 10.9%Utility gas
- 1.8%No fuel used
- 0.2%Bottled, tank, or LP gas
Private vs. public school enrollment:
| Here: | 34.2% |
| Florida: | 15.8% |
| Here: | 26.6% |
| Florida: | 12.9% |
| Here: | 31.7% |
| Florida: | 23.6% |


