Florissant, MO (Missouri) Houses and Residents
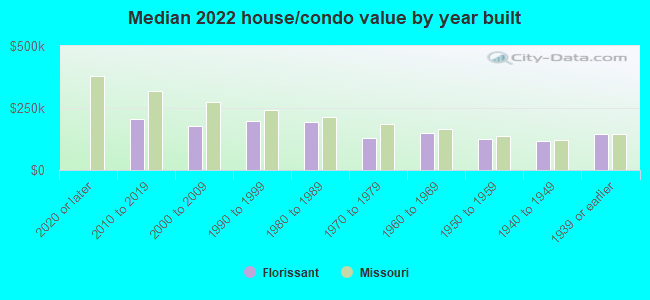
| Florissant: | $132,680 |
| Missouri: | $221,200 |
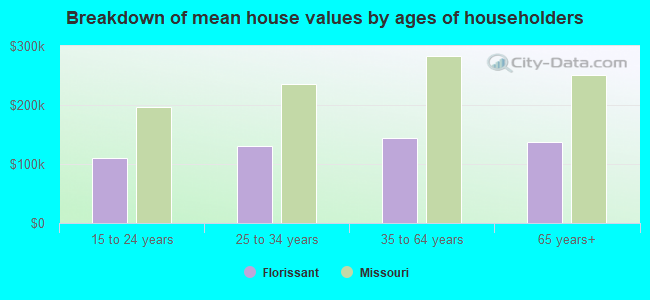
Mean price in 2022:
Detached houses: $164,175
Here: $164,175 State: $278,068 Townhouses or other attached units: $140,890
Here: $140,890 State: $260,773 In 3-to-4-unit structures: $127,308
Here: $127,308 State: $181,162 In 5-or-more-unit structures: $75,515
Here: $75,515 State: $263,082
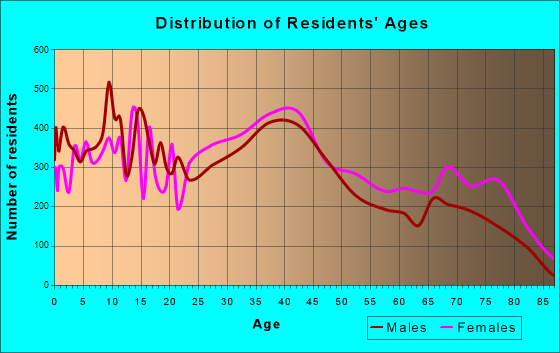
Total population: 52,303 (Urban population: 50,229, Rural population: 0)
Houses: 22,581 (20,552 occupied: 13,540 owner occupied, 6,965 renter occupied)
| % of renters here: | 34% |
| State: | 32% |
Housing density: 1,987 houses/condos per square mile
Median price asked for vacant for-sale houses and condos in 2022: $76,004.
Median contract rent in 2022: $995 (lower quartile is $760, upper quartile is $1,214)
Median rent asked for vacant for-rent units in 2022: $1,116
Median gross rent in Florissant, MO in 2022: $1,233
Housing units in Florissant with a mortgage: 9,291 (474 second mortgage, 21 home equity loan, 238 both second mortgage and home equity loan)
Houses without a mortgage: 223
Median household income for houses/condos with a mortgage: $77,152
Median household income for apartments without a mortgage: $71,602
Median monthly housing costs: $1,068
Compare current foreclosures in Florissant, MO:
| Photo | Address | Area | Beds / Baths | Price | Details |
|---|---|---|---|---|---|

|
#1
Grants Pkwy
Florissant, MO 63031
|
986 sq. feet
|
1 baths 3 beds |
$167,000
|
show details |

|
#2
Old Jamestown Rd
Florissant, MO 63034
|
1,440 sq. feet
|
2 baths 3 beds |
$112,300
|
show details |

|
#3
Willow Wren Ct Unit 308
Florissant, MO 63033
|
955 sq. feet
|
2 baths 2 beds |
$78,000
|
show details |

|
#4
Cricket Ct
Florissant, MO 63033
|
1,557 sq. feet
|
2 baths 4 beds |
$90,250
|
show details |

|
#5
Marietta Dr
Florissant, MO 63033
|
1,863 sq. feet
|
2 baths 3 beds |
$168,000
|
show details |

|
#6
Driftwood Trails Dr
Florissant, MO 63031
|
1,283 sq. feet
|
2 baths 3 beds |
show details | |

|
#7
Liberty Landing Dr
Florissant, MO 63033
|
1,402 sq. feet
|
2 baths 2 beds |
show details | |

|
#8
Flamingo Dr
Florissant, MO 63031
|
1,025 sq. feet
|
1 baths 3 beds |
show details | |

|
#9
Marechal Ln
Florissant, MO 63031
|
1,215 sq. feet
|
1 baths 3 beds |
show details | |

|
#10
Silver Fox Dr
Florissant, MO 63034
|
1,044 sq. feet
|
1 baths 3 beds |
show details |
| Photo | Address | Area | Beds / Baths | Price | Details |
|---|---|---|---|---|---|

|
#11
Jerries Ln
Florissant, MO 63033
|
1,180 sq. feet
|
2 baths 4 beds |
show details | |

|
#12
Jerries Ln
Florissant, MO 63033
|
1,763 sq. feet
|
3 baths 3 beds |
show details | |

|
#13
Lindsay Ln
Florissant, MO 63031
|
1,123 sq. feet
|
2 baths 3 beds |
show details | |

|
#14
Hiddenbrook Dr
Florissant, MO 63033
|
1,485 sq. feet
|
2 baths 3 beds |
show details | |

|
#15
Huckleberry Dr
Florissant, MO 63033
|
1,329 sq. feet
|
2 baths 4 beds |
show details | |

|
#16
Skylark Dr
Florissant, MO 63031
|
1,807 sq. feet
|
3 baths 3 beds |
show details | |

|
#17
Cypress Creek Dr
Florissant, MO 63031
|
1,012 sq. feet
|
2 baths 2 beds |
show details | |

|
#18
Boggan Pl
Florissant, MO 63031
|
1,425 sq. feet
|
1 baths 2 beds |
show details | |

|
#19
Dwyer Ln
Florissant, MO 63033
|
1,864 sq. feet
|
2 baths 4 beds |
show details | |

|
#20
Old Jamestown Rd
Florissant, MO 63033
|
1,644 sq. feet
|
2 baths 3 beds |
show details |
| Photo | Address | Area | Beds / Baths | Price | Details |
|---|---|---|---|---|---|

|
#21
Saint Anthony Ln
Florissant, MO 63033
|
1,411 sq. feet
|
2 baths 3 beds |
show details | |

|
#22
Edgemere Dr
Florissant, MO 63033
|
1,464 sq. feet
|
2 baths 3 beds |
show details | |

|
#23
Needle Point Ct
Florissant, MO 63033
|
1,896 sq. feet
|
2 baths 4 beds |
show details | |

|
#24
Somerset Dr
Florissant, MO 63033
|
1,565 sq. feet
|
2 baths 3 beds |
show details | |

|
#25
Bensonhurst Dr
Florissant, MO 63031
|
1,189 sq. feet
|
2 baths 3 beds |
show details | |

|
#26
Parc Charlene Dr
Florissant, MO 63033
|
1,820 sq. feet
|
2 baths 3 beds |
show details | |

|
#27
Starlet Dr
Florissant, MO 63031
|
1,650 sq. feet
|
1 baths 4 beds |
show details | |

|
#28
Greenberry Dr
Florissant, MO 63033
|
2,102 sq. feet
|
2 baths 4 beds |
show details | |

|
#29
Holiday Hill Dr
Florissant, MO 63033
|
1,324 sq. feet
|
2 baths 3 beds |
show details | |

|
#30
Greenbriar Dr
Florissant, MO 63033
|
1,358 sq. feet
|
2 baths 3 beds |
show details |
| Photo | Address | Area | Beds / Baths | Price | Details |
|---|---|---|---|---|---|

|
#31
Parmer Dr
Florissant, MO 63031
|
1,104 sq. feet
|
2 baths 3 beds |
show details | |

|
#32
Flicker Dr
Florissant, MO 63031
|
1,272 sq. feet
|
1 baths 3 beds |
show details | |

|
#33
Dwyer Ln
Florissant, MO 63033
|
1,864 sq. feet
|
3 baths 4 beds |
show details | |

|
#34
Patterson Ln
Florissant, MO 63031
|
1,053 sq. feet
|
1 baths 3 beds |
show details | |

|
#35
Del Lago Dr
Florissant, MO 63034
|
1,105 sq. feet
|
2 baths 3 beds |
show details | |

|
#36
Fox Hall Ln
Florissant, MO 63033
|
1,060 sq. feet
|
1 baths 3 beds |
show details | |

|
#37
Flordawn Dr
Florissant, MO 63031
|
1,105 sq. feet
|
2 baths 3 beds |
show details | |

|
#38
Debridge Way
Florissant, MO 63034
|
2,662 sq. feet
|
2 baths 4 beds |
show details | |

|
#39
Springwood Place Ct
Florissant, MO 63031
|
1,044 sq. feet
|
1 baths 3 beds |
show details | |

|
#40
Chance Dr
Florissant, MO 63031
|
912 sq. feet
|
1 baths 3 beds |
show details |
| Photo | Address | Area | Beds / Baths | Price | Details |
|---|---|---|---|---|---|

|
#41
Palm Dr
Florissant, MO 63031
|
1,000 sq. feet
|
1 baths 3 beds |
show details | |

|
#42
Radford Dr
Florissant, MO 63031
|
1,278 sq. feet
|
1 baths 3 beds |
show details | |

|
#43
Northport Hills Dr
Florissant, MO 63033
|
1,600 sq. feet
|
2 baths 3 beds |
show details | |

|
#44
Mullanphy Rd
Florissant, MO 63031
|
927 sq. feet
|
1 baths 3 beds |
show details | |

|
#45
Saint Celeste Dr
Florissant, MO 63031
|
956 sq. feet
|
1 baths 2 beds |
show details | |

|
#46
Pyrenees Dr
Florissant, MO 63033
|
1,504 sq. feet
|
2 baths 3 beds |
show details | |

|
#47
Edisto Ct
Florissant, MO 63034
|
2,010 sq. feet
|
2 baths 3 beds |
show details | |

|
#48
Lake Paddock Dr
Florissant, MO 63033
|
2,537 sq. feet
|
2 baths 3 beds |
show details | |

|
#49
Tahoe Dr
Florissant, MO 63031
|
1,106 sq. feet
|
1 baths 3 beds |
show details | |

|
Check over 1 million property listings on Foreclosure.com!
|
browse all offers | |||

Latest news about housing in Florissant, MO collected exclusively by city-data.com from local newspapers, TV, and radio stations

 | Houses in Florissant seem cheap - is there a catch? (11 replies) |
| Townhouse/apartment rentals in St. Louis (6 replies) |
| Florissant real estate agent (0 replies) |
| Overwhelmed House Shopper (12 replies) |
| Definitions of Mid, South, North, and West St. Louis County? (42 replies) |
| What is really wrong with St. Louis? (448 replies) |
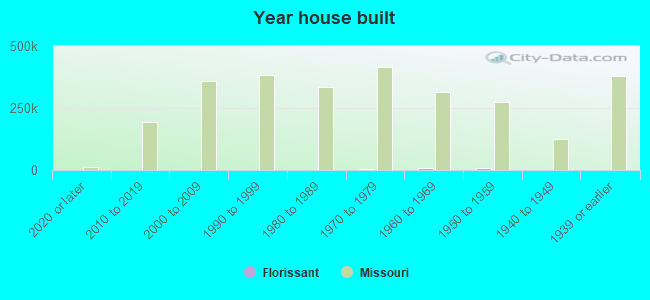
Median year apartment built: 1967
Household type by relationship:
Households: 51,682- Male householders: 8,340 (2,626 living alone), Female householders: 11,973 (3,584 living alone)
8,274 spouses (8,132 opposite-sex spouses), 1,566 unmarried partners, (1,529 opposite-sex unmarried partners), 16,269 children (14,954 natural, 385 adopted, 929 stepchildren), 1,518 grandchildren, 720 brothers or sisters, 588 parents, 48 foster children, 447 other relatives, 1,140 non-relatives
- In group quarters: 793
Size of family households: 5,735 2-persons, 3,188 3-persons, 2,154 4-persons, 1,317 5-persons, 387 6-persons, 165 7-or-more-persons.
Size of nonfamily households: 6,144 1-person, 1,161 2-persons, 146 3-persons, 46 4-persons, 35 5-persons.
5,667 married couples with children.
4,451 single-parent households (795 men, 3,656 women).
94.4% of residents of Florissant speak English at home.
2.4% of residents speak Spanish at home (27% speak English very well, 33% speak English well, 23% speak English not well, 16% don't speak English at all).
0.5% of residents speak other Indo-European language at home (63% speak English very well, 28% speak English well, 9% speak English not well).
0.6% of residents speak Asian or Pacific Island language at home (26% speak English very well, 20% speak English well, 50% speak English not well, 4% don't speak English at all).
2.0% of residents speak other language at home (83% speak English very well, 16% speak English well, 1% don't speak English at all).
Foreign born population: 2,033 (3.9%)
(50.0% of them are naturalized citizens)
| Here: | 6.0 |
| State: | 6.4 |
| Here: | 4.5 |
| State: | 4.4 |
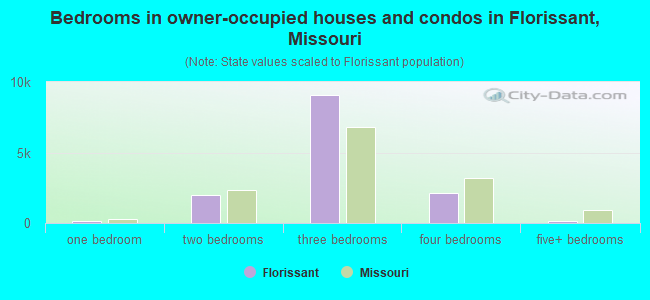
- Bedrooms in owner-occupied houses and condos in Florissant, Missouri
- 55no bedroom
- 1241 bedroom
- 2,0052 bedrooms
- 9,0703 bedrooms
- 2,1384 bedrooms
- 1485+ bedrooms
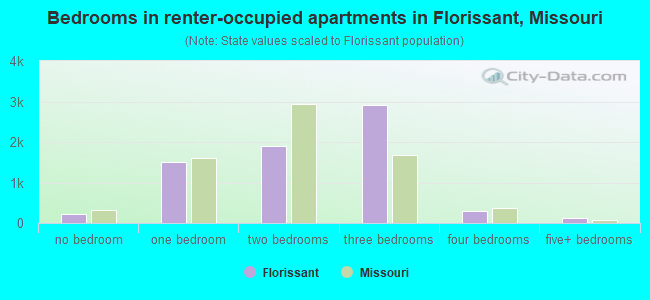
- Bedrooms in renter-occupied apartments in Florissant, Missouri
- 233no bedroom
- 1,5041 bedroom
- 1,9002 bedrooms
- 2,9133 bedrooms
- 3014 bedrooms
- 1145+ bedrooms
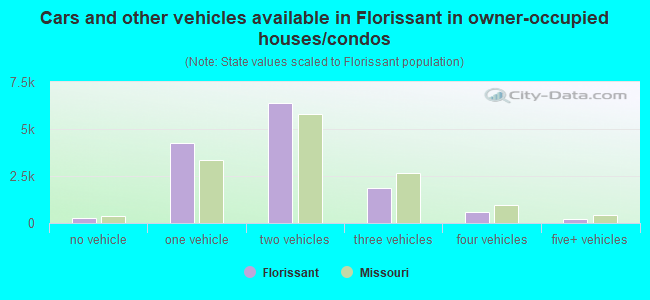
- Cars and other vehicles available in Florissant in owner-occupied houses/condos
- 244no vehicle
- 4,2541 vehicle
- 6,3932 vehicles
- 1,8393 vehicles
- 5944 vehicles
- 2165+ vehicles
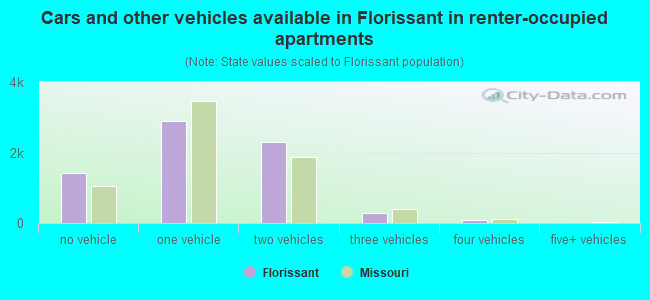
- Cars and other vehicles available in Florissant in renter-occupied apartments
- 1,411no vehicle
- 2,8801 vehicle
- 2,2922 vehicles
- 2933 vehicles
- 894 vehicles
- 05+ vehicles
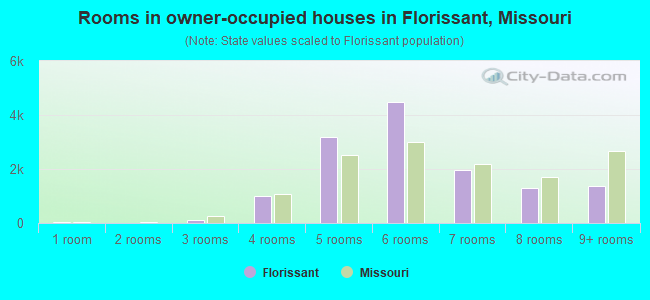
- Rooms in owner-occupied houses in Florissant, Missouri
- 551 room
- 122 rooms
- 1153 rooms
- 1,0004 rooms
- 3,1975 rooms
- 4,4896 rooms
- 1,9807 rooms
- 1,3108 rooms
- 1,3829+ rooms
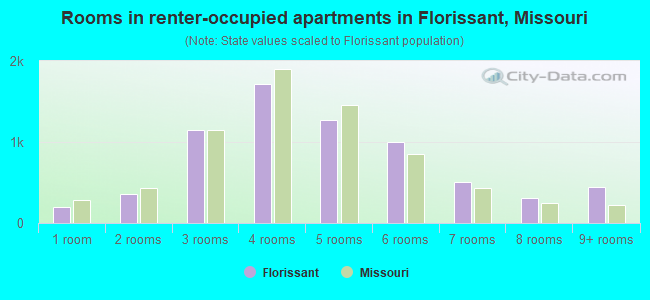
- Rooms in renter-occupied apartments in Florissant, Missouri
- 2001 room
- 3612 rooms
- 1,1503 rooms
- 1,7124 rooms
- 1,2765 rooms
- 1,0036 rooms
- 5087 rooms
- 3128 rooms
- 4439+ rooms

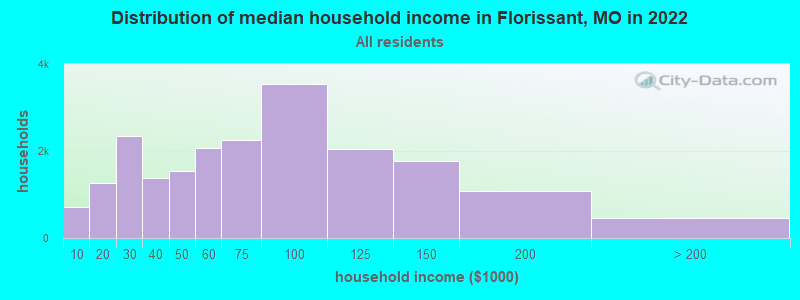
Florissant, MO household income distribution

- 710Less than $10,000
- 1,259$10,000 to $19,999
- 2,346$20,000 to $29,999
- 1,372$30,000 to $39,999
- 1,549$40,000 to $49,999
- 2,064$50,000 to $59,999
- 2,261$60,000 to $74,999
- 3,549$75,000 to $99,999
- 2,055$100,000 to $124,999
- 1,770$125,000 to $149,999
- 1,077$150,000 to $199,999
- 461$200,000 or more
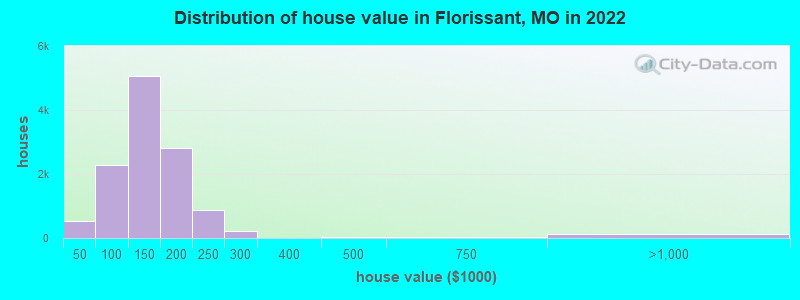
Home value of owner - occupied houses in 2022 in Florissant, MO
-
- 72Less than $10,000
- 94$10,000 to $14,999
- 257$15,000 to $19,999
- 47$30,000 to $34,999
- 23$35,000 to $39,999
- 45$40,000 to $49,999
- 333$50,000 to $59,999
- 141$60,000 to $69,999
- 560$70,000 to $79,999
- 479$80,000 to $89,999
- 734$90,000 to $99,999
- 2,604$100,000 to $124,999
- 2,470$125,000 to $149,999
- 2,075$150,000 to $174,999
- 750$175,000 to $199,999
- 870$200,000 to $249,999
- 233$250,000 to $299,999
- 9$300,000 to $399,999
- 34$400,000 to $499,999
- 30$500,000 to $749,999
- 64$750,000 to $999,999
- 64$1,000,000 to $1,499,999
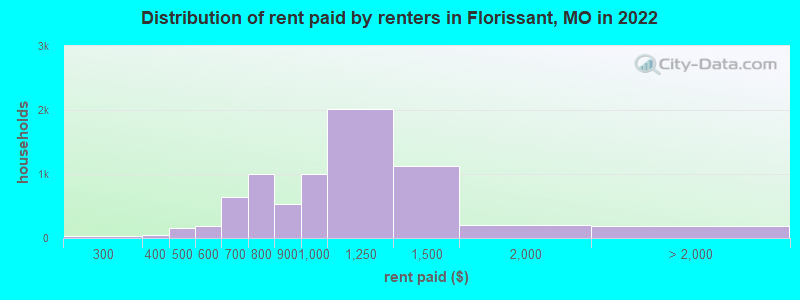
Rent paid by renters in 2022 in Florissant, MO
-
- 24$200 to $249
- 3$250 to $299
- 29$300 to $349
- 16$350 to $399
- 93$400 to $449
- 56$450 to $499
- 22$500 to $549
- 161$550 to $599
- 337$600 to $649
- 305$650 to $699
- 554$700 to $749
- 440$750 to $799
- 525$800 to $899
- 1,007$900 to $999
- 2,013$1,000 to $1,249
- 1,124$1,250 to $1,499
- 207$1,500 to $1,999
- 52$2,000 to $2,499
- 22$3,500 or more
- 109No cash rent
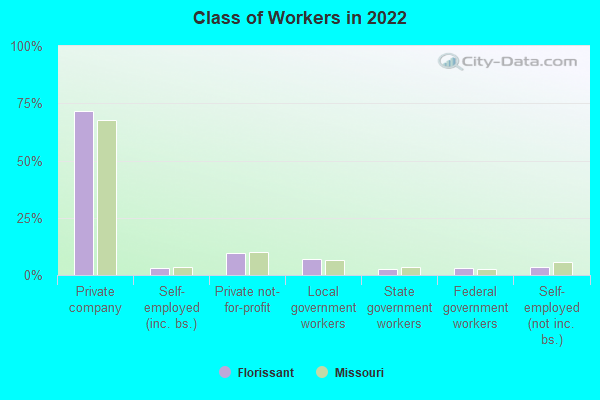
Percentage of workers working in this county: 76.5%
Number of people working at home: 3,054 (11.7% of all workers)
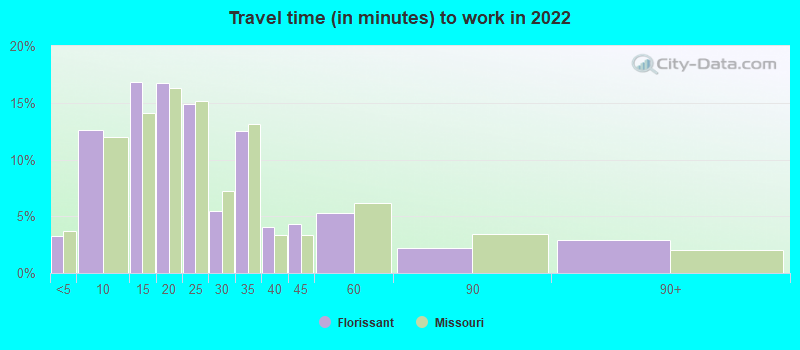
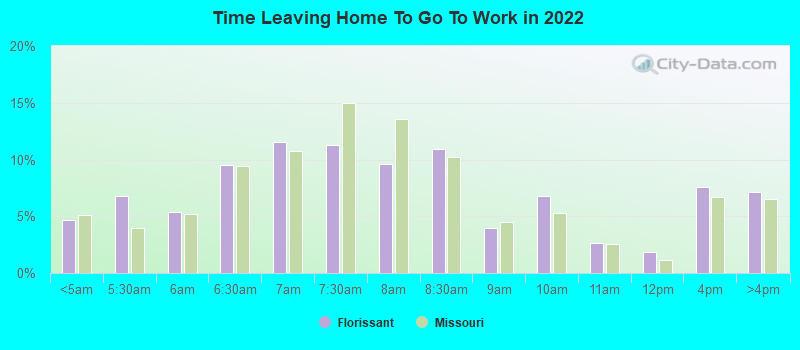
Travel time to work (commute)
- Less than 5 minutes: 458
- 5 to 9 minutes: 1,562
- 10 to 14 minutes: 2,079
- 15 to 19 minutes: 3,900
- 20 to 24 minutes: 3,531
- 25 to 29 minutes: 2,631
- 30 to 34 minutes: 4,391
- 35 to 39 minutes: 1,060
- 40 to 44 minutes: 859
- 45 to 59 minutes: 1,029
- 60 to 89 minutes: 344
- 90 or more minutes: 637
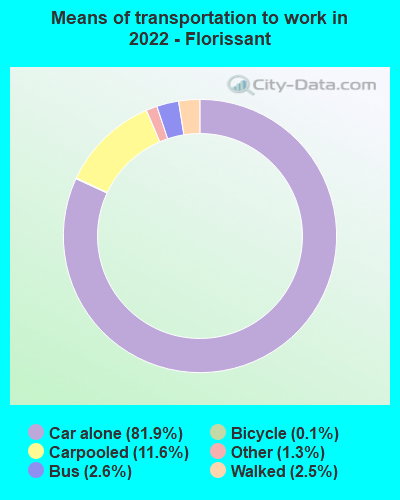
Means of transportation to work:
- Drove a car alone: 9,002 (65.4%)
- Carpooled: 1,207 (8.8%)
- Bus: 278 (2.0%)
- Taxi: 130 (0.9%)
- Bicycle: 19 (0.1%)
- Walked: 326 (2.4%)
- Worked at home: 3,054 (22.2%)
- Unemployment by race in 2022
- Unemployment rate for White non-Hispanic residents
- 5.2%Males
- 2.4%Females
- Unemployment rate for Black residents
- 6.5%Males
- 8.9%Females
- Unemployment rate for Asian residents
- 10.8%Males
- Unemployment rate for other race residents
- 17.5%Males
- 15.8%Females
- Unemployment rate for two or more race residents
- 0.5%Males
- 6.4%Females
- Unemployment rate for Hispanic or Latino residents
- 13.9%Males
- 9.9%Females
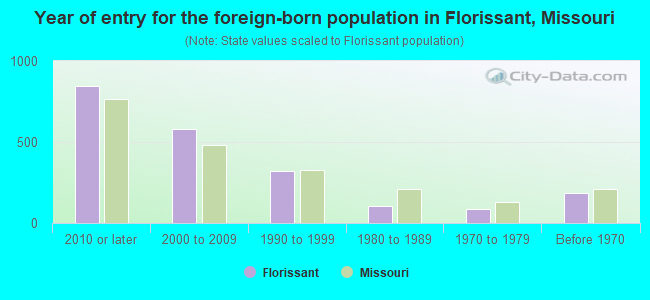
- Year of entry for the foreign-born population in Florissant, Missouri
- 8462010 or later
- 5822000 to 2009
- 3211990 to 1999
- 1051980 to 1989
- 851970 to 1979
- 183Before 1970
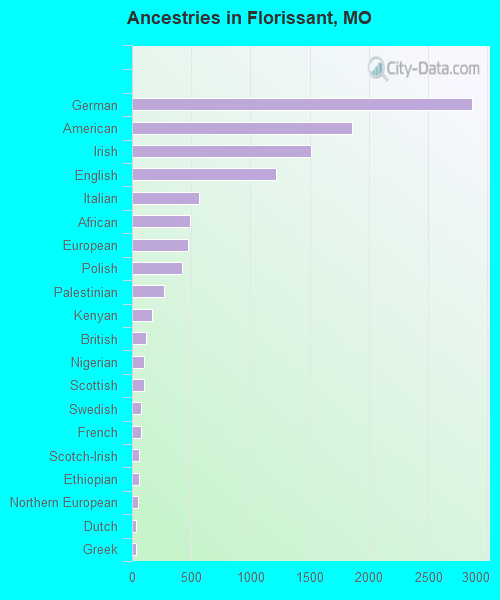
First ancestries reported:
- German: 2,871 (11.1%)
- American: 1,857 (7.2%)
- Irish: 1,509 (5.8%)
- English: 1,219 (4.7%)
- Italian: 568 (2.2%)
- African: 493 (1.9%)
- European: 469 (1.8%)
- Polish: 421 (1.6%)
- Palestinian: 266 (1.0%)
- Kenyan: 171 (0.7%)
- British: 114 (0.4%)
- Nigerian: 105 (0.4%)
- Scottish: 103 (0.4%)
- Swedish: 80 (0.3%)
- French: 76 (0.3%)
- Scotch-Irish: 57 (0.2%)
- Ethiopian: 56 (0.2%)
- Northern European: 51 (0.2%)
- Dutch: 35 (0.1%)
- Greek: 32 (0.1%)
- Eastern European: 26 (0.1%)
- Czech: 24 (0.09%)
- Scandinavian: 21 (0.08%)
- French Canadian: 20 (0.08%)
- Liberian: 18 (0.07%)
- Russian: 16 (0.06%)
- Lebanese: 12 (0.05%)
- Welsh: 10 (0.04%)
- Portuguese: 9 (0.03%)
- Egyptian: 9 (0.03%)
- Belgian: 8 (0.03%)
- Austrian: 8 (0.03%)
- Yugoslavian: 8 (0.03%)
- Danish: 6 (0.02%)
- Croatian: 5 (0.02%)
- Slovak: 5 (0.02%)
- Arab: 3 (0.01%)
Most common places of birth for foreign-born residents (%):
| Florissant: | 25.9% (519) |
| Missouri: | 1.7% (4,518) |
| Florissant: | 10.9% (219) |
| Missouri: | 1.2% (2,988) |
| Florissant: | 9.9% (198) |
| Missouri: | 14.9% (38,568) |
| Florissant: | 8.5% (171) |
| Missouri: | 4.1% (10,700) |
| Florissant: | 4.7% (95) |
| Missouri: | 0.3% (727) |
| Florissant: | 4.5% (91) |
| Missouri: | 1.4% (3,640) |
| Florissant: | 3.8% (77) |
| Missouri: | 2.1% (5,346) |
| Florissant: | 3.6% (72) |
| Missouri: | 4.2% (10,873) |
| Florissant: | 3.5% (70) |
| Missouri: | 0.2% (498) |
| Florissant: | 3.0% (61) |
| Missouri: | 0.4% (923) |
| Florissant: | 2.4% (48) |
| Missouri: | 2.9% (7,525) |
| Florissant: | 2.4% (48) |
| Missouri: | 0.4% (1,113) |
| Florissant: | 2.0% (41) |
| Missouri: | 0.7% (1,850) |
| Florissant: | 1.8% (36) |
| Missouri: | 0.3% (664) |
| Florissant: | 1.7% (35) |
| Missouri: | 1.1% (2,796) |
Place of birth for U.S.-born residents:
- This state: 38,376
- Other state: 11,009
- Northeast: 716
- Midwest: 4,514
- South: 3,937
- West: 1,792
88.4% of Florissant residents lived in the same house 1 years ago.
Out of people who lived in different houses, 37.6% lived in this county.
Out of people who lived in different counties, 56.0% lived in Missouri.
| Florissant: | 88.4% |
| State average: | 87.1% |
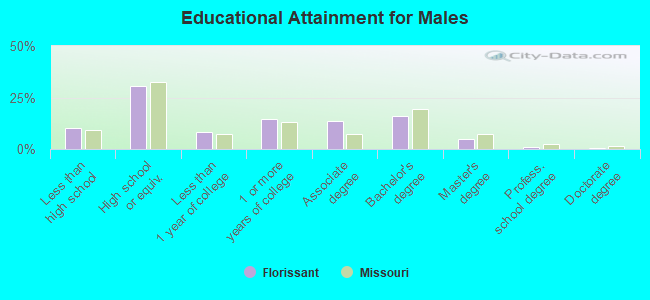
Education attainment for males 25 years and older:
- No schooling: 299
- Nursery to 4th grade: 0
- 5th and 6th grade: 64
- 7th and 8th grade: 188
- 9th grade: 114
- 10th grade: 176
- 11th grade: 341
- 12th grade, no diploma: 497
- High school graduate (or equivalency): 4,984
- Less than 1 year of college: 1,389
- Some college more than 1 year, no degree: 2,398
- Associate degree: 2,213
- Bachelor's degree: 2,652
- Master's degree: 799
- Professional school degree: 159
- Doctorate degree: 112
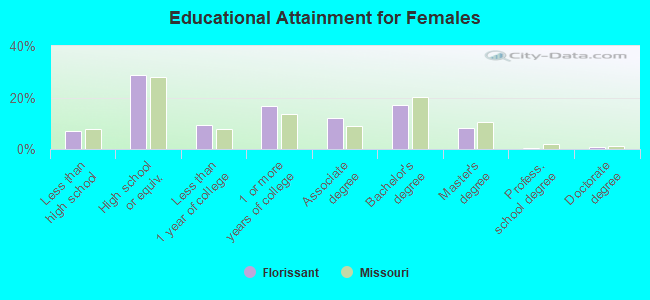
Education attainment for females 25 years and older:
- No schooling: 338
- Nursery to 4th grade: 12
- 5th and 6th grade: 39
- 7th and 8th grade: 81
- 9th grade: 153
- 10th grade: 313
- 11th grade: 208
- 12th grade, no diploma: 147
- High school graduate (or equivalency): 5,293
- Less than 1 year of college: 1,721
- Some college more than 1 year, no degree: 3,043
- Associate degree: 2,197
- Bachelor's degree: 3,144
- Master's degree: 1,474
- Professional school degree: 88
- Doctorate degree: 131
Housing units in structures:
- One, detached: 17,983
- One, attached: 374
- Two: 100
- 3 or 4: 1,084
- 5 to 9: 1,230
- 10 to 19: 988
- 20 to 49: 221
- 50 or more: 504
- Mobile homes: 68
- Boats, RVs, vans, etc.: 25
Housing units lacking complete kitchen facilities in 2022: 0.7%
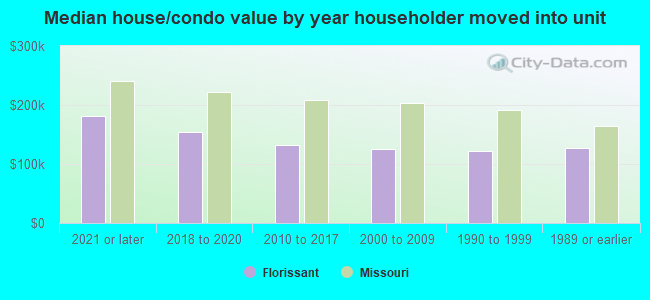
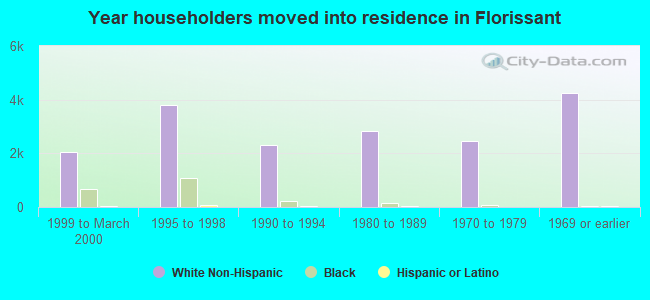
House/condo owner moved in on average 15 years ago
Renter moved in on average 4 years ago
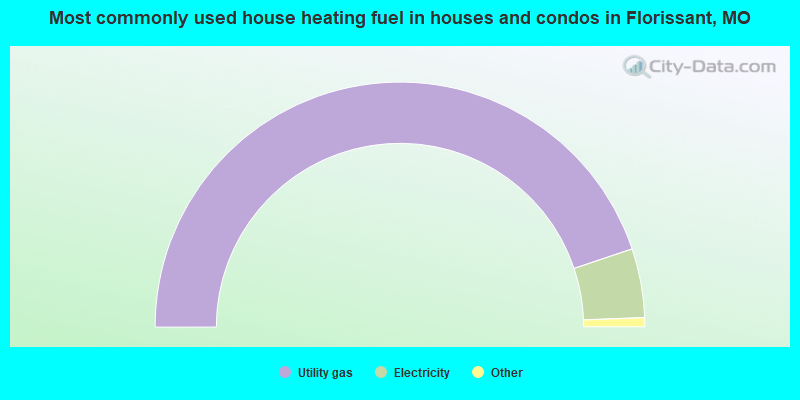
- 89.7%Utility gas
- 9.1%Electricity
- 0.6%Bottled, tank, or LP gas
- 0.3%Fuel oil, kerosene, etc.
- 0.2%No fuel used
- 0.1%Wood
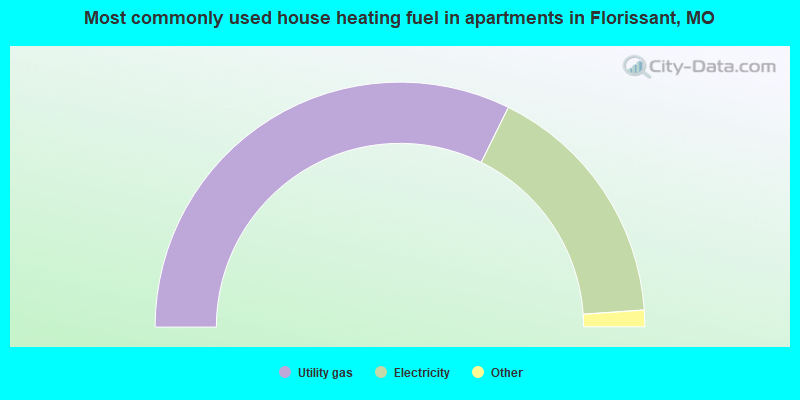
- 64.6%Utility gas
- 33.2%Electricity
- 1.6%Bottled, tank, or LP gas
- 0.5%Other fuel
- 0.1%No fuel used
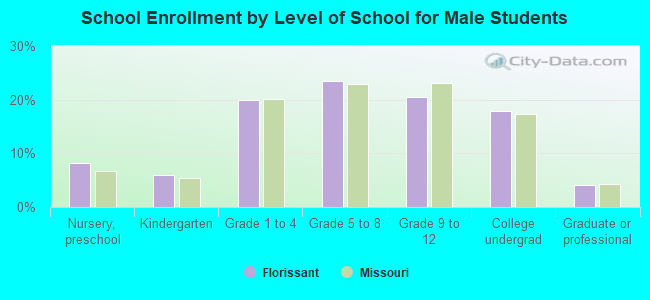
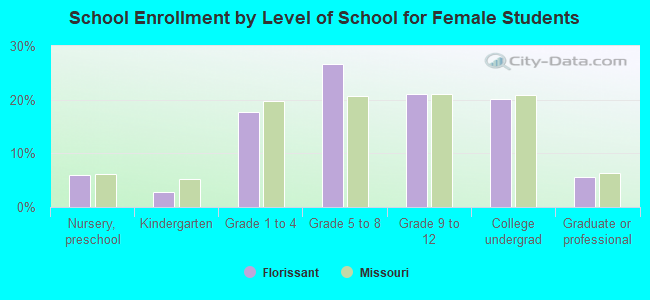
Private vs. public school enrollment:
| Here: | 16.9% |
| Missouri: | 15.4% |
| Here: | 22.2% |
| Missouri: | 13.9% |
| Here: | 14.4% |
| Missouri: | 22.6% |