Forest Hills, MI (Michigan) Houses and Residents
| Forest Hills: | $514,101 |
| Michigan: | $224,400 |
Total population: 25,867 (Urban population: 16,404, Rural population: 4,527 (13 farm, 4,514 nonfarm))
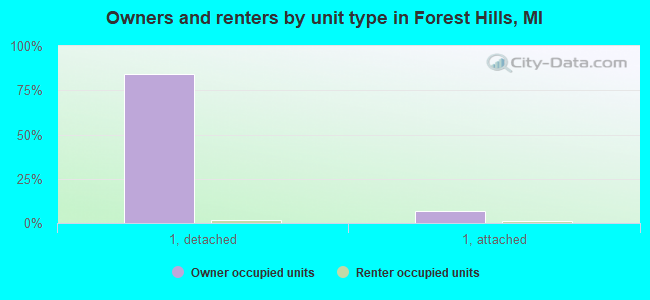
Houses: 10,467 (10,159 occupied: 9,618 owner occupied, 537 renter occupied)
| % of renters here: | 5% |
| State: | 27% |
Housing density: 212 houses/condos per square mile
Median price asked for vacant for-sale houses and condos in 2022: $283,396.
Median contract rent in 2022: $1,581 (lower quartile is $1,125, upper quartile is over $2,000)
Median rent asked for vacant for-rent units in 2022: $720
Median gross rent in Forest Hills, MI in 2022: $1,743
Housing units in Forest Hills with a mortgage: 5,703 (775 second mortgage, 0 home equity loan, 802 both second mortgage and home equity loan)
Houses without a mortgage: 134
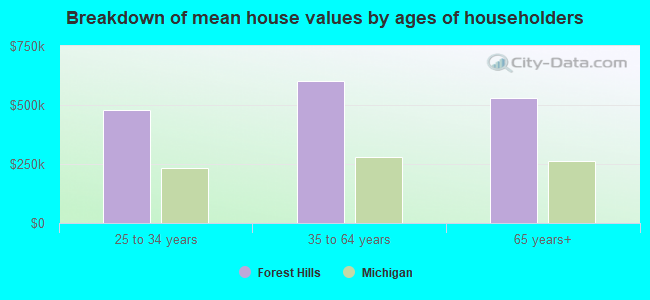
Median household income for houses/condos with a mortgage: $172,550
Median household income for apartments without a mortgage: $121,660
Median monthly housing costs: $1,709
Compare current foreclosures near Forest Hills, MI:
| Photo | Address | Area | Beds / Baths | Price | Details |
|---|---|---|---|---|---|

|
#1
Union Ave SE
Grand Rapids, MI 49548
|
1,467 sq. feet
|
2 baths 3 beds |
$295,000
|
show details |

|
#2
Sabal Pointe Dr SE
Grand Rapids, MI 49546
|
1,745 sq. feet
|
2 baths 2 beds |
show details | |

|
#3
Fenwick St NW
Grand Rapids, MI 49534
|
1,260 sq. feet
|
1 baths 3 beds |
show details | |

|
#4
Hunt St
Lowell, MI 49331
|
1,464 sq. feet
|
2 baths 4 beds |
show details | |

|
#5
Saint Charles Ave SW
Grand Rapids, MI 49507
|
975 sq. feet
|
1 baths 3 beds |
show details | |

|
#6
Fuller Ave NE
Grand Rapids, MI 49503
|
1,550 sq. feet
|
1 baths 3 beds |
show details | |

|
#7
Kenwood Ave
Belding, MI 48809
|
904 sq. feet
|
1 baths 2 beds |
show details | |

|
#8
Burton St SW
Grand Rapids, MI 49507
|
1,352 sq. feet
|
2 baths 5 beds |
show details | |

|
#9
Paramount Dr NE
Grand Rapids, MI 49525
|
1,623 sq. feet
|
3 baths 4 beds |
show details | |

|
#10
W Garbow Rd
Middleville, MI 49333
|
2,521 sq. feet
|
2 baths 3 beds |
show details |
| Photo | Address | Area | Beds / Baths | Price | Details |
|---|---|---|---|---|---|

|
#11
Alyssum Dr SE
Grand Rapids, MI 49512
|
1,560 sq. feet
|
2 baths 3 beds |
show details | |

|
#12
Creek Bluff Pl NW
Grand Rapids, MI 49504
|
1,805 sq. feet
|
1 baths 4 beds |
show details | |

|
#13
E Saxony Dr SE
Grand Rapids, MI 49508
|
1,193 sq. feet
|
1 baths 2 beds |
show details | |

|
#14
68th St SE
Caledonia, MI 49316
|
1,177 sq. feet
|
1 baths 3 beds |
show details | |

|
#15
Alger St SE
Grand Rapids, MI 49546
|
2,342 sq. feet
|
2 baths 4 beds |
show details | |

|
#16
52nd St SE
Grand Rapids, MI 49508
|
877 sq. feet
|
1 baths 2 beds |
show details | |

|
#17
Nevada Ridge Dr SW
Byron Center, MI 49315
|
979 sq. feet
|
1 baths 2 beds |
show details | |

|
#18
Mccarty St NW # 13
Grand Rapids, MI 49544
|
1,374 sq. feet
|
1 baths 3 beds |
show details | |

|
#19
Hanchett Ave NW
Grand Rapids, MI 49504
|
1,932 sq. feet
|
2 baths 3 beds |
show details | |

|
#20
Edgelawn Dr SE
Grand Rapids, MI 49508
|
1,280 sq. feet
|
2 baths 3 beds |
show details |
| Photo | Address | Area | Beds / Baths | Price | Details |
|---|---|---|---|---|---|

|
#21
Byron Center Ave SW
Wyoming, MI 49519
|
1,089 sq. feet
|
4 baths 3 beds |
show details | |

|
#22
Margaret Ave SE
Grand Rapids, MI 49507
|
1,278 sq. feet
|
1 baths 3 beds |
show details | |

|
#23
3rd St NW
Grand Rapids, MI 49504
|
876 sq. feet
|
1 baths 3 beds |
show details | |

|
#24
Longstreet Ave SW
Wyoming, MI 49509
|
924 sq. feet
|
1 baths 2 beds |
show details | |

|
#25
Rathbone St SW
Wyoming, MI 49509
|
- sq. feet
|
1 baths 4 beds |
show details | |

|
#26
Howard St SE
Grand Rapids, MI 49507
|
1,232 sq. feet
|
1 baths - beds |
show details | |

|
#27
Nelson Ave SE
Grand Rapids, MI 49507
|
1,088 sq. feet
|
1 baths - beds |
show details | |

|
#28
Masonic St
Belding, MI 48809
|
1,548 sq. feet
|
1 baths 4 beds |
show details | |

|
#29
S Broas St
Belding, MI 48809
|
2,306 sq. feet
|
3 baths 4 beds |
show details | |

|
#30
S Front St
Belding, MI 48809
|
1,698 sq. feet
|
1 baths 4 beds |
show details |
| Photo | Address | Area | Beds / Baths | Price | Details |
|---|---|---|---|---|---|

|
#31
Lafayette Ave SE
Grand Rapids, MI 49507
|
- sq. feet
|
1 baths 3 beds |
show details | |

|
#32
Cogswell St NW
Grand Rapids, MI 49544
|
- sq. feet
|
2 baths 3 beds |
show details | |

|
#33
Bentbrook St SE
Grand Rapids, MI 49508
|
- sq. feet
|
2 baths 3 beds |
show details | |

|
#34
W May St
Belding, MI 48809
|
1,341 sq. feet
|
2 baths 3 beds |
show details | |

|
#35
Hilltop Dr
Middleville, MI 49333
|
1,008 sq. feet
|
1 baths 3 beds |
show details | |

|
#36
Colrain St SE
Grand Rapids, MI 49548
|
- sq. feet
|
3 baths 4 beds |
show details | |

|
#37
W Ferney St
Clarksville, MI 48815
|
1,696 sq. feet
|
2 baths - beds |
show details | |

|
#38
Mill St
Saranac, MI 48881
|
2,258 sq. feet
|
1 baths - beds |
show details | |

|
#39
N Whitneyville Rd
Middleville, MI 49333
|
1,595 sq. feet
|
2 baths - beds |
show details | |

|
#40
W Parmalee Rd
Middleville, MI 49333
|
1,570 sq. feet
|
2 baths - beds |
show details |
| Photo | Address | Area | Beds / Baths | Price | Details |
|---|---|---|---|---|---|

|
#41
142nd Ave
Wayland, MI 49348
|
1,496 sq. feet
|
2 baths - beds |
show details | |

|
#42
Fawn Ridge Dr
Lowell, MI 49331
|
960 sq. feet
|
1 baths - beds |
show details | |

|
#43
W Peck Lake Rd
Lowell, MI 49331
|
1,200 sq. feet
|
4 baths - beds |
show details | |

|
#44
141st Ave
Wayland, MI 49348
|
2,305 sq. feet
|
2 baths - beds |
show details | |

|
#45
Button Rd
Belding, MI 48809
|
1,532 sq. feet
|
1 baths - beds |
show details | |

|
#46
Overfield Dr SE
Grand Rapids, MI 49508
|
- sq. feet
|
- baths - beds |
show details | |

|
#47
Bond Ave NW Apt 801
Grand Rapids, MI 49503
|
- sq. feet
|
- baths - beds |
show details | |

|
#48
Caulfield Ave SW
Grand Rapids, MI 49503
|
- sq. feet
|
- baths - beds |
show details | |

|
#49
Ingersoll St SW
Wyoming, MI 49519
|
- sq. feet
|
- baths - beds |
show details | |

|
Check over 1 million property listings on Foreclosure.com!
|
browse all offers | |||


 | Older Homes / Downtown Areas around GR (21 replies) |
| Rental HOUSE in Forest Hills, Ada, NE GR, Rockford, (1 reply) |
| Forbes just named GR #1 place to invest in house (50 replies) |
| Renting in EGR/Forest Hills (5 replies) |
| East Grand Rapids Input (4 replies) |
| Grand Rapids ranked as US hottest housing market -Trulia (31 replies) |
Median year apartment built: 1996
Household type by relationship:
Households: 28,501- Male householders: 5,300 (366 living alone), Female householders: 4,744 (835 living alone)
7,695 spouses (7,549 opposite-sex spouses), 273 unmarried partners, (273 opposite-sex unmarried partners), 9,758 children (9,325 natural, 155 adopted, 276 stepchildren), 15 grandchildren, 248 brothers or sisters, 101 parents, 0 foster children, 111 other relatives, 214 non-relatives
- In group quarters: 38
Size of family households: 3,597 2-persons, 1,603 3-persons, 1,779 4-persons, 1,025 5-persons, 165 6-persons, 66 7-or-more-persons.
Size of nonfamily households: 1,270 1-person, 241 2-persons, 21 5-persons.
7,008 married couples with children.
721 single-parent households (352 men, 369 women).
90.5% of residents of Forest Hills speak English at home.
3.0% of residents speak Spanish at home (66% speak English very well, 13% speak English well, 21% speak English not well).
2.0% of residents speak other Indo-European language at home (85% speak English very well, 15% speak English well).
3.3% of residents speak Asian or Pacific Island language at home (56% speak English very well, 19% speak English well, 25% speak English not well).
0.7% of residents speak other language at home (85% speak English very well, 15% speak English well).
Foreign born population: 1,498 (5.3%)
(69.8% of them are naturalized citizens)
| Here: | 10.1 |
| State: | 6.5 |
| Here: | 4.2 |
| State: | 4.3 |
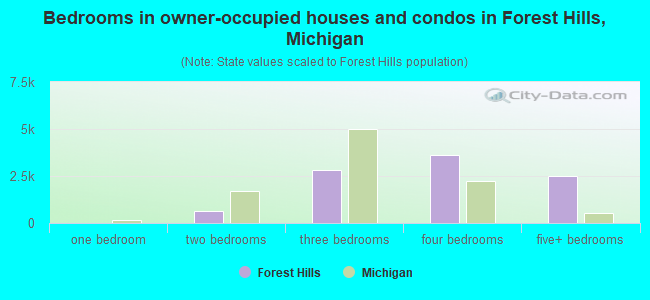
- Bedrooms in owner-occupied houses and condos in Forest Hills, Michigan
- 18no bedroom
- 01 bedroom
- 6472 bedrooms
- 2,8373 bedrooms
- 3,6304 bedrooms
- 2,4875+ bedrooms
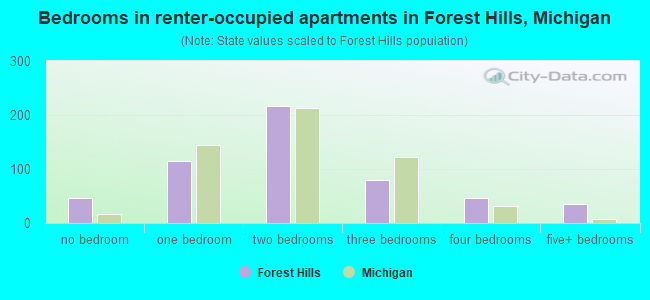
- Bedrooms in renter-occupied apartments in Forest Hills, Michigan
- 46no bedroom
- 1141 bedroom
- 2162 bedrooms
- 793 bedrooms
- 474 bedrooms
- 365+ bedrooms
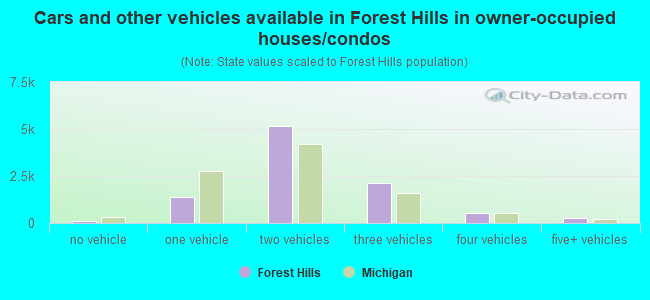
- Cars and other vehicles available in Forest Hills in owner-occupied houses/condos
- 96no vehicle
- 1,3591 vehicle
- 5,1862 vehicles
- 2,1403 vehicles
- 5444 vehicles
- 2925+ vehicles
- Cars and other vehicles available in Forest Hills in renter-occupied apartments
- 34no vehicle
- 2401 vehicle
- 2632 vehicles
- 03 vehicles
- 04 vehicles
- 05+ vehicles
- Rooms in owner-occupied houses in Forest Hills, Michigan
- 181 room
- 02 rooms
- 03 rooms
- 1504 rooms
- 6495 rooms
- 9846 rooms
- 1,1027 rooms
- 1,4098 rooms
- 5,3069+ rooms
- Rooms in renter-occupied apartments in Forest Hills, Michigan
- 461 room
- 302 rooms
- 923 rooms
- 1254 rooms
- 955 rooms
- 566 rooms
- 247 rooms
- 218 rooms
- 489+ rooms
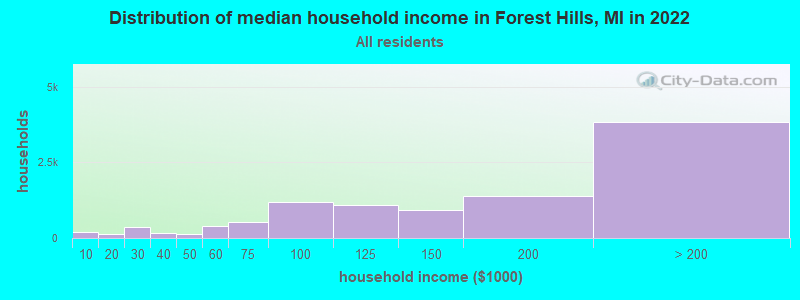
Forest Hills, MI household income distribution

- 182Less than $10,000
- 119$10,000 to $19,999
- 365$20,000 to $29,999
- 173$30,000 to $39,999
- 148$40,000 to $49,999
- 391$50,000 to $59,999
- 523$60,000 to $74,999
- 1,182$75,000 to $99,999
- 1,094$100,000 to $124,999
- 917$125,000 to $149,999
- 1,379$150,000 to $199,999
- 3,834$200,000 or more
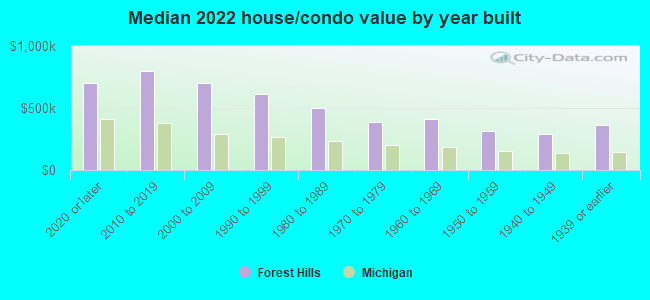
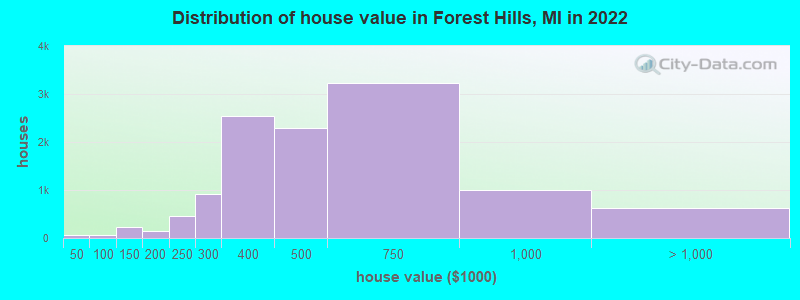
Home value of owner - occupied houses in 2022 in Forest Hills, MI
-
- 14Less than $10,000
- 14$20,000 to $24,999
- 24$40,000 to $49,999
- 29$50,000 to $59,999
- 5$90,000 to $99,999
- 224$100,000 to $124,999
- 2$125,000 to $149,999
- 98$150,000 to $174,999
- 52$175,000 to $199,999
- 457$200,000 to $249,999
- 913$250,000 to $299,999
- 2,532$300,000 to $399,999
- 2,282$400,000 to $499,999
- 3,237$500,000 to $749,999
- 1,000$750,000 to $999,999
- 436$1,000,000 to $1,499,999
- 127$1,500,000 to $1,999,999
- 62$2,000,000 or more
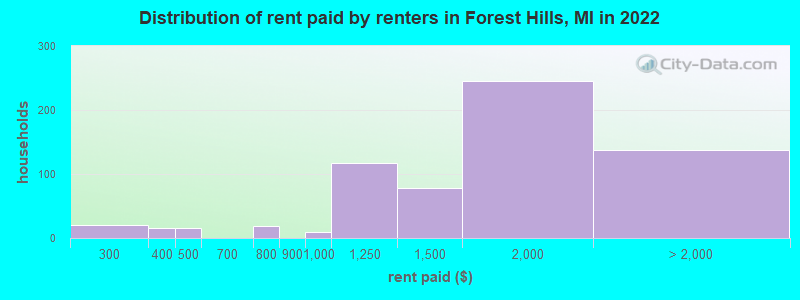
Rent paid by renters in 2022 in Forest Hills, MI
-
- 20$200 to $249
- 16$350 to $399
- 15$400 to $449
- 17$750 to $799
- 9$900 to $999
- 116$1,000 to $1,249
- 78$1,250 to $1,499
- 245$1,500 to $1,999
- 34$2,000 to $2,499
- 11$2,500 to $2,999
- 24$3,500 or more
- 67No cash rent
Percentage of workers working in this county: 94.1%
Number of people working at home: 3,476 (25.4% of all workers)
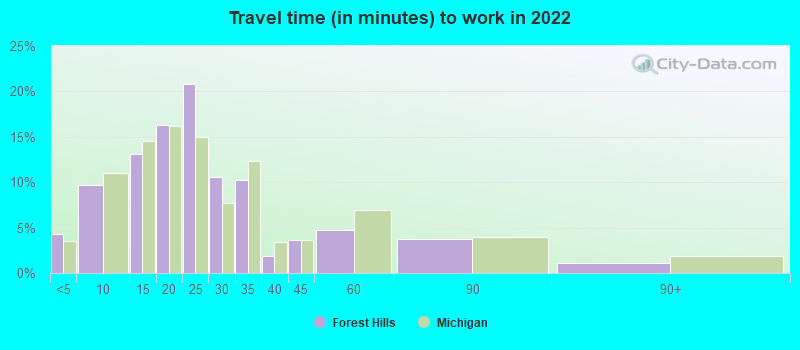
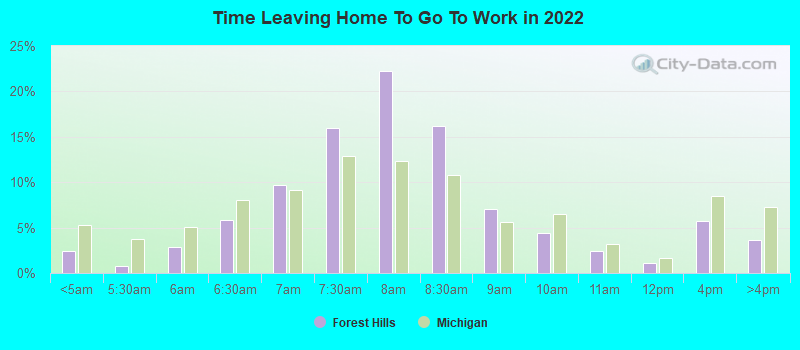
Travel time to work (commute)
- Less than 5 minutes: 438
- 5 to 9 minutes: 966
- 10 to 14 minutes: 1,721
- 15 to 19 minutes: 2,532
- 20 to 24 minutes: 2,140
- 25 to 29 minutes: 812
- 30 to 34 minutes: 888
- 35 to 39 minutes: 231
- 40 to 44 minutes: 179
- 45 to 59 minutes: 193
- 60 to 89 minutes: 376
- 90 or more minutes: 146
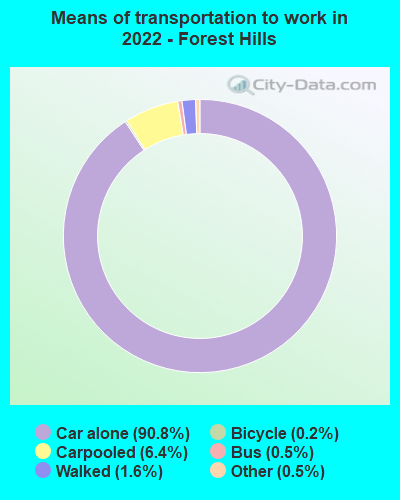
Means of transportation to work:
- Drove a car alone: 9,274 (70.1%)
- Carpooled: 671 (5.1%)
- Bus: 34 (0.3%)
- Taxi: 74 (0.6%)
- Bicycle: 17 (0.1%)
- Walked: 161 (1.2%)
- Worked at home: 3,476 (26.3%)
- Unemployment by race in 2022
- Unemployment rate for White non-Hispanic residents
- 1.2%Males
- 1.2%Females
- Unemployment rate for two or more race residents
- 2.0%Males
- 2.4%Females
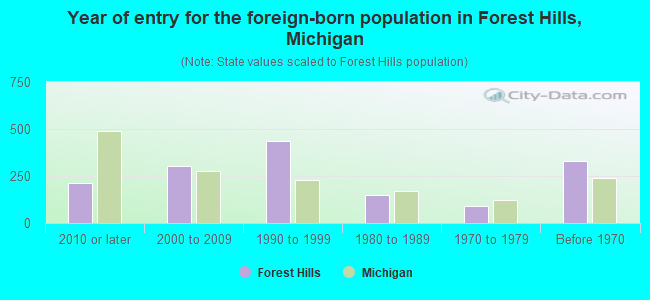
- Year of entry for the foreign-born population in Forest Hills, Michigan
- 2122010 or later
- 3032000 to 2009
- 4381990 to 1999
- 1491980 to 1989
- 931970 to 1979
- 328Before 1970
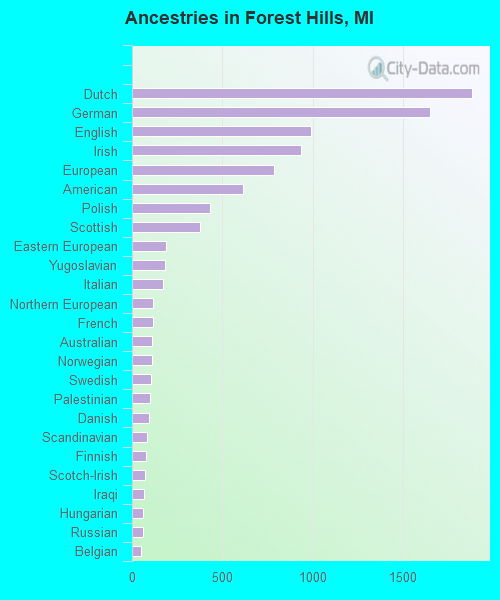
First ancestries reported:
- Dutch: 1,882 (15.7%)
- German: 1,647 (13.7%)
- English: 992 (8.3%)
- Irish: 934 (7.8%)
- European: 784 (6.5%)
- American: 612 (5.1%)
- Polish: 433 (3.6%)
- Scottish: 379 (3.2%)
- Eastern European: 188 (1.6%)
- Yugoslavian: 182 (1.5%)
- Italian: 170 (1.4%)
- Northern European: 117 (1.0%)
- French: 116 (1.0%)
- Australian: 113 (0.9%)
- Norwegian: 111 (0.9%)
- Swedish: 104 (0.9%)
- Palestinian: 100 (0.8%)
- Danish: 94 (0.8%)
- Scandinavian: 81 (0.7%)
- Finnish: 78 (0.6%)
- Scotch-Irish: 73 (0.6%)
- Iraqi: 65 (0.5%)
- Hungarian: 62 (0.5%)
- Russian: 61 (0.5%)
- Belgian: 51 (0.4%)
- Luxembourger: 50 (0.4%)
- Lebanese: 50 (0.4%)
- Estonian: 50 (0.4%)
- French Canadian: 47 (0.4%)
- Czechoslovakian: 37 (0.3%)
- British: 32 (0.3%)
- Portuguese: 30 (0.2%)
- Slovak: 29 (0.2%)
- Lithuanian: 27 (0.2%)
- Canadian: 20 (0.2%)
- Romanian: 20 (0.2%)
- Czech: 15 (0.1%)
- Latvian: 15 (0.1%)
- Greek: 13 (0.1%)
- Bulgarian: 12 (0.10%)
- Ukrainian: 12 (0.10%)
- Guyanese: 9 (0.07%)
Most common places of birth for foreign-born residents (%):
| Forest Hills: | 10.9% (157) |
| Michigan: | 4.9% (34,295) |
| Forest Hills: | 9.2% (133) |
| Michigan: | 3.0% (20,884) |
| Forest Hills: | 9.0% (130) |
| Michigan: | 11.1% (77,240) |
| Forest Hills: | 8.1% (117) |
| Michigan: | 1.5% (10,225) |
| Forest Hills: | 6.4% (92) |
| Michigan: | 5.0% (35,052) |
| Forest Hills: | 5.6% (81) |
| Michigan: | 0.9% (6,009) |
| Forest Hills: | 5.1% (74) |
| Michigan: | 0.2% (1,695) |
| Forest Hills: | 4.9% (71) |
| Michigan: | 1.8% (12,679) |
| Forest Hills: | 4.1% (59) |
| Michigan: | 0.0% (251) |
| Forest Hills: | 3.5% (50) |
| Michigan: | 2.3% (16,126) |
| Forest Hills: | 2.8% (40) |
| Michigan: | 1.5% (10,596) |
| Forest Hills: | 2.4% (34) |
| Michigan: | 10.9% (75,965) |
| Forest Hills: | 2.4% (34) |
| Michigan: | 0.6% (3,969) |
| Forest Hills: | 2.3% (33) |
| Michigan: | 0.9% (5,978) |
| Forest Hills: | 2.0% (29) |
| Michigan: | 3.7% (25,634) |
| Forest Hills: | 1.7% (24) |
| Michigan: | 1.6% (10,857) |
| Forest Hills: | 1.5% (22) |
| Michigan: | 0.2% (1,298) |
Place of birth for U.S.-born residents:
- This state: 18,986
- Other state: 7,833
- Northeast: 1,439
- Midwest: 3,444
- South: 1,553
- West: 1,311
93.8% of Forest Hills residents lived in the same house 1 years ago.
Out of people who lived in different houses, 36.7% lived in this county.
Out of people who lived in different counties, 56.3% lived in Michigan.
| Forest Hills: | 93.8% |
| State average: | 88.4% |
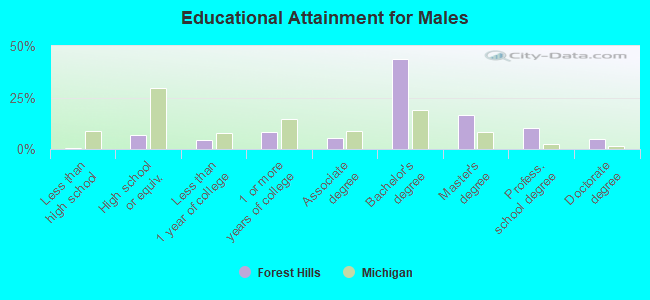
Education attainment for males 25 years and older:
- No schooling: 32
- Nursery to 4th grade: 0
- 5th and 6th grade: 0
- 7th and 8th grade: 0
- 9th grade: 0
- 10th grade: 20
- 11th grade: 9
- 12th grade, no diploma: 3
- High school graduate (or equivalency): 648
- Less than 1 year of college: 409
- Some college more than 1 year, no degree: 797
- Associate degree: 497
- Bachelor's degree: 4,128
- Master's degree: 1,558
- Professional school degree: 947
- Doctorate degree: 444
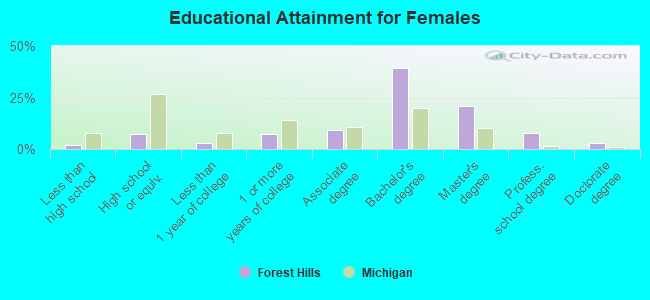
Education attainment for females 25 years and older:
- No schooling: 74
- Nursery to 4th grade: 0
- 5th and 6th grade: 0
- 7th and 8th grade: 0
- 9th grade: 15
- 10th grade: 0
- 11th grade: 61
- 12th grade, no diploma: 51
- High school graduate (or equivalency): 725
- Less than 1 year of college: 315
- Some college more than 1 year, no degree: 761
- Associate degree: 946
- Bachelor's degree: 4,011
- Master's degree: 2,103
- Professional school degree: 803
- Doctorate degree: 278
Housing units in structures:
- One, detached: 9,133
- One, attached: 748
- Two: 62
- 3 or 4: 28
- 5 to 9: 22
- 10 to 19: 305
- 20 to 49: 63
- Mobile homes: 102
Median worth of mobile homes: $307,738
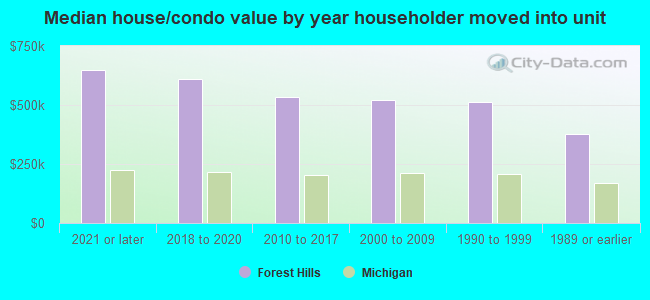
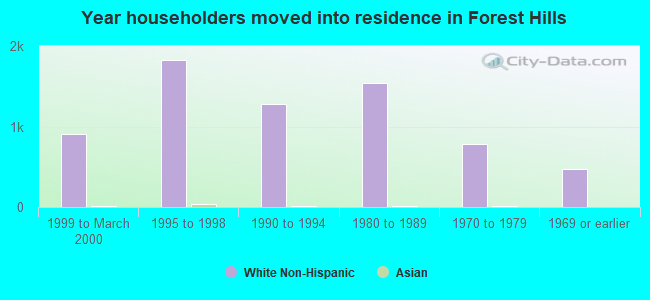
House/condo owner moved in on average 9 years ago
Renter moved in on average 4 years ago
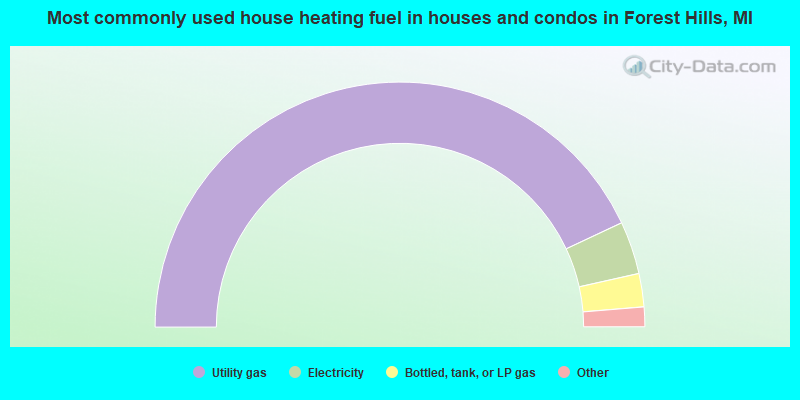
- 86.1%Utility gas
- 7.0%Electricity
- 4.4%Bottled, tank, or LP gas
- 1.3%Other fuel
- 0.7%Wood
- 0.3%No fuel used
- 0.2%Fuel oil, kerosene, etc.
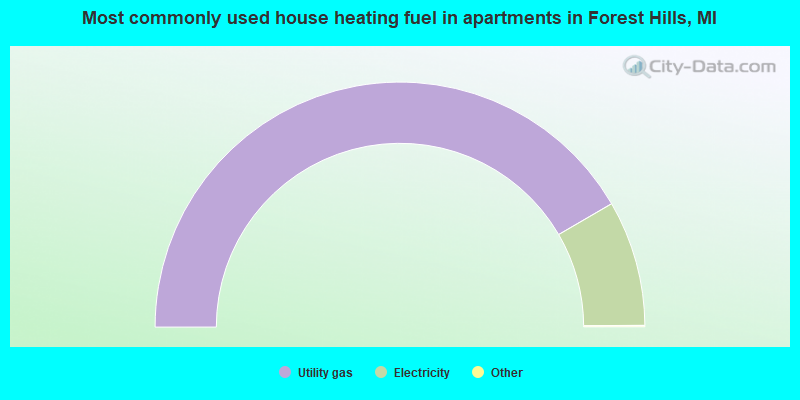
- 83.4%Utility gas
- 16.6%Electricity
Private vs. public school enrollment:
| Here: | 16.4% |
| Michigan: | 12.4% |
| Here: | 12.6% |
| Michigan: | 9.8% |
| Here: | 14.5% |
| Michigan: | 14.9% |