Fruitdale, CA (California) Houses and Residents
| Fruitdale: | $1,511,805 |
| California: | $715,900 |
Mean price in 2022:
Detached houses: $1,339,942
Here: $1,339,942 State: $988,808
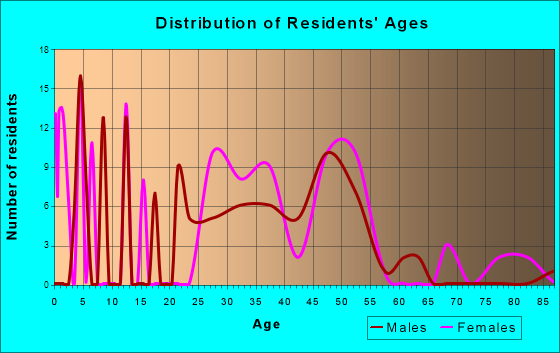
Total population: 935 (Urban population: 700, Rural population: 0)
Houses: 519 (470 occupied: 309 owner occupied, 159 renter occupied)
| % of renters here: | 34% |
| State: | 44% |
Housing density: 1,951 houses/condos per square mile
Median price asked for vacant for-sale houses and condos in 2022 in this county: $2,273,258.
Median contract rent in 2022: over $2,000 (lower quartile is $1,313, upper quartile is over $2,000)
Median rent asked for vacant for-rent units in 2022: $3,076
Median gross rent in Fruitdale, CA in 2022: over $2,000
Housing units in Fruitdale with a mortgage: 204 (82 second mortgage, 0 home equity loan, 86 both second mortgage and home equity loan)
Houses without a mortgage: 0
Median household income for houses/condos with a mortgage: $191,727
Median monthly housing costs: $3,217
Compare current foreclosures near Fruitdale, CA:
| Photo | Address | Area | Beds / Baths | Price | Details |
|---|---|---|---|---|---|

|
#1
Mulberry St
Newark, CA 94560
|
984 sq. feet
|
1 baths 3 beds |
show details | |

|
#2
Russell Ln
Milpitas, CA 95035
|
2,144 sq. feet
|
2 baths 4 beds |
show details | |

|
#3
Pescadero Ct
Milpitas, CA 95035
|
1,773 sq. feet
|
2 baths 4 beds |
show details | |

|
#4
Diamond Ave
San Jose, CA 95127
|
1,206 sq. feet
|
1 baths 3 beds |
show details | |

|
#5
E Mission St Unit 115
San Jose, CA 95112
|
1,253 sq. feet
|
1 baths 1 beds |
show details | |

|
#6
Rathmann Dr
San Jose, CA 95148
|
1,950 sq. feet
|
2 baths 4 beds |
show details | |

|
#7
Woodhaven Dr
San Jose, CA 95127
|
992 sq. feet
|
1 baths 3 beds |
show details | |

|
#8
Toyonita Rd
Los Altos, CA 94024
|
4,833 sq. feet
|
3 baths 5 beds |
show details | |

|
#9
Lavonne Ave
San Jose, CA 95116
|
1,130 sq. feet
|
2 baths 4 beds |
show details | |

|
#10
Rodney Dr
San Jose, CA 95118
|
1,525 sq. feet
|
2 baths 3 beds |
show details |
| Photo | Address | Area | Beds / Baths | Price | Details |
|---|---|---|---|---|---|

|
#11
Sunny Meadow Ln
San Jose, CA 95135
|
1,990 sq. feet
|
2 baths 4 beds |
show details | |

|
#12
Carmen Ct
San Jose, CA 95121
|
1,452 sq. feet
|
2 baths 4 beds |
show details | |

|
#13
Clayton Ave
San Jose, CA 95110
|
1,024 sq. feet
|
3 baths 6 beds |
show details | |

|
#14
Saratoga Ave
Palo Alto, CA 94303
|
750 sq. feet
|
1 baths 3 beds |
show details | |

|
#15
Middlefield Ave
Fremont, CA 94539
|
3,624 sq. feet
|
2 baths 3 beds |
show details | |

|
#16
Singletary Ave
San Jose, CA 95126
|
1,136 sq. feet
|
1 baths 2 beds |
show details | |

|
#17
Phinney Pl
San Jose, CA 95139
|
2,347 sq. feet
|
3 baths 5 beds |
show details | |

|
#18
Hall Ranch Rd
Santa Cruz, CA 95065
|
1,534 sq. feet
|
2 baths 2 beds |
show details | |

|
#19
Cove Ct
San Jose, CA 95148
|
1,106 sq. feet
|
2 baths 3 beds |
show details | |

|
#20
Fruitdale Ave
San Jose, CA 95128
|
990 sq. feet
|
1 baths 2 beds |
show details |
| Photo | Address | Area | Beds / Baths | Price | Details |
|---|---|---|---|---|---|

|
#21
Kendrick Cir
San Jose, CA 95121
|
1,444 sq. feet
|
2 baths 3 beds |
show details | |

|
#22
Potomac Ct
San Jose, CA 95136
|
2,743 sq. feet
|
3 baths 6 beds |
show details | |

|
#23
Euclid Ave
Palo Alto, CA 94303
|
1,600 sq. feet
|
2 baths 4 beds |
show details | |

|
#24
E Julian St
San Jose, CA 95112
|
1,488 sq. feet
|
2 baths 3 beds |
show details | |

|
#25
Dewey Pl
Fremont, CA 94538
|
1,232 sq. feet
|
2 baths 3 beds |
show details | |

|
#26
Ventura Ave
San Jose, CA 95111
|
1,458 sq. feet
|
2 baths 4 beds |
show details | |

|
#27
Vintage Crest Dr
San Jose, CA 95148
|
3,138 sq. feet
|
3 baths 6 beds |
show details | |

|
#28
Silver Ranch Ln
San Jose, CA 95138
|
2,265 sq. feet
|
4 baths 4 beds |
show details | |

|
#29
Heritage Estates Ct
San Jose, CA 95148
|
1,781 sq. feet
|
2 baths 4 beds |
show details | |

|
#30
Whitesand Dr
San Jose, CA 95148
|
2,845 sq. feet
|
3 baths 5 beds |
show details |
| Photo | Address | Area | Beds / Baths | Price | Details |
|---|---|---|---|---|---|

|
#31
Gordy Dr
San Jose, CA 95131
|
1,634 sq. feet
|
2 baths 4 beds |
show details | |

|
#32
Glenburry Way
San Jose, CA 95123
|
1,353 sq. feet
|
2 baths 4 beds |
show details | |

|
#33
Heath St
Milpitas, CA 95035
|
980 sq. feet
|
1 baths 3 beds |
show details | |

|
#34
Bamboo Dr
Sunnyvale, CA 94086
|
2,423 sq. feet
|
3 baths 6 beds |
show details | |

|
#35
Seville Way
San Jose, CA 95131
|
1,168 sq. feet
|
2 baths 4 beds |
show details | |

|
#36
Oak Valley Rd
Cupertino, CA 95014
|
3,350 sq. feet
|
3 baths 5 beds |
show details | |

|
#37
Sawyer Ct
Santa Clara, CA 95054
|
2,107 sq. feet
|
2 baths 4 beds |
show details | |

|
#38
Yosemite Dr
Milpitas, CA 95035
|
1,484 sq. feet
|
2 baths 3 beds |
show details | |

|
#39
Dixie Dr
San Jose, CA 95122
|
1,232 sq. feet
|
2 baths 3 beds |
show details | |

|
#40
Hillview Dr
Los Gatos, CA 95030
|
2,527 sq. feet
|
2 baths 2 beds |
show details |
| Photo | Address | Area | Beds / Baths | Price | Details |
|---|---|---|---|---|---|

|
#41
Senter Rd
San Jose, CA 95111
|
1,197 sq. feet
|
2 baths 3 beds |
show details | |

|
#42
Eulalie Dr
San Jose, CA 95121
|
1,618 sq. feet
|
2 baths 4 beds |
show details | |

|
#43
Parc Place Dr
Milpitas, CA 95035
|
1,530 sq. feet
|
2 baths 3 beds |
show details | |

|
#44
Thornmill Way
San Jose, CA 95121
|
2,134 sq. feet
|
2 baths 6 beds |
show details | |

|
#45
Chabot Way
San Jose, CA 95122
|
1,726 sq. feet
|
3 baths 5 beds |
show details | |

|
#46
Aldrich Way
San Jose, CA 95121
|
1,097 sq. feet
|
1 baths 3 beds |
show details | |

|
#47
Cerro Chico
Los Gatos, CA 95030
|
2,379 sq. feet
|
3 baths 4 beds |
show details | |

|
#48
Pleasant Row Ct
San Jose, CA 95148
|
1,532 sq. feet
|
2 baths 3 beds |
show details | |

|
#49
Montellano Dr
San Jose, CA 95120
|
2,278 sq. feet
|
2 baths 5 beds |
show details | |

|
Check over 1 million property listings on Foreclosure.com!
|
browse all offers | |||

Latest news about housing in Fruitdale, CA collected exclusively by city-data.com from local newspapers, TV, and radio stations

 | Growth of Afghan communities in California (81 replies) |
| California's Linguistic Diversity (73 replies) |
| Help Choosing 2 Apartments between 2 Neighborhoods (5 replies) |
| San Jose Home Prices (46 replies) |
| Changes in DTSJ (180 replies) |
| Apartment Hunting(Monterey Grove or Fruitsdale Station (3 replies) |
Median year apartment built: 1965
Household type by relationship:
Households: 1,189- Male householders: 171 (40 living alone), Female householders: 282 (85 living alone)
90 spouses (90 opposite-sex spouses), 46 unmarried partners, (30 opposite-sex unmarried partners), 294 children (294 natural, 0 adopted, 0 stepchildren), 0 grandchildren, 5 brothers or sisters, 5 parents, 0 foster children, 17 other relatives, 221 non-relatives
- In group quarters: 52
Size of family households: 69 2-persons, 140 3-persons, 39 4-persons.
Size of nonfamily households: 139 1-person, 44 2-persons, 39 3-persons, 4 5-persons.
26 married couples with children.
48 single-parent households (48 men, 0 women).
64.4% of residents of Fruitdale speak English at home.
14.7% of residents speak Spanish at home (81% speak English very well, 19% speak English well).
4.5% of residents speak other Indo-European language at home (100% speak English very well).
15.5% of residents speak Asian or Pacific Island language at home (73% speak English very well, 7% speak English well, 20% speak English not well).
Foreign born population: 225 (18.9%)
(32.0% of them are naturalized citizens)
| Here: | 5.8 |
| State: | 6.0 |
| Here: | 3.9 |
| State: | 3.9 |

- Bedrooms in owner-occupied houses and condos in Fruitdale, California
- 0no bedroom
- 181 bedroom
- 362 bedrooms
- 983 bedrooms
- 1524 bedrooms
- 55+ bedrooms

- Bedrooms in renter-occupied apartments in Fruitdale, California
- 16no bedroom
- 371 bedroom
- 792 bedrooms
- 03 bedrooms
- 04 bedrooms
- 275+ bedrooms

- Cars and other vehicles available in Fruitdale in owner-occupied houses/condos
- 10no vehicle
- 511 vehicle
- 442 vehicles
- 1763 vehicles
- 164 vehicles
- 125+ vehicles

- Cars and other vehicles available in Fruitdale in renter-occupied apartments
- 24no vehicle
- 621 vehicle
- 442 vehicles
- 293 vehicles
- 04 vehicles
- 05+ vehicles

- Rooms in owner-occupied houses in Fruitdale, California
- 01 room
- 182 rooms
- 03 rooms
- 364 rooms
- 655 rooms
- 1336 rooms
- 247 rooms
- 38 rooms
- 309+ rooms

- Rooms in renter-occupied apartments in Fruitdale, California
- 161 room
- 102 rooms
- 213 rooms
- 694 rooms
- 165 rooms
- 06 rooms
- 167 rooms
- 08 rooms
- 119+ rooms


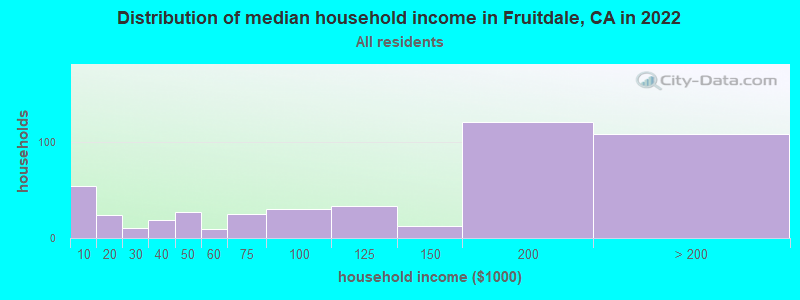
Fruitdale, CA household income distribution

- 54Less than $10,000
- 24$10,000 to $19,999
- 10$20,000 to $29,999
- 19$30,000 to $39,999
- 27$40,000 to $49,999
- 9$50,000 to $59,999
- 25$60,000 to $74,999
- 30$75,000 to $99,999
- 33$100,000 to $124,999
- 12$125,000 to $149,999
- 121$150,000 to $199,999
- 109$200,000 or more
Home value of owner - occupied houses in 2022 in Fruitdale, CA
-
- 23Less than $10,000
- 9$500,000 to $749,999
- 10$750,000 to $999,999
- 175$1,000,000 to $1,499,999
- 44$1,500,000 to $1,999,999
- 19$2,000,000 or more

Rent paid by renters in 2022 in Fruitdale, CA
-
- 6Less than $100
- 12$250 to $299
- 8$300 to $349
- 8$1,000 to $1,249
- 15$1,250 to $1,499
- 25$1,500 to $1,999
- 7$2,000 to $2,499
- 63$2,500 to $2,999
- 9$3,000 to $3,499
- 9$3,500 or more


Percentage of workers working in this county: 99.1%
Number of people working at home: 405 (52.4% of all workers)
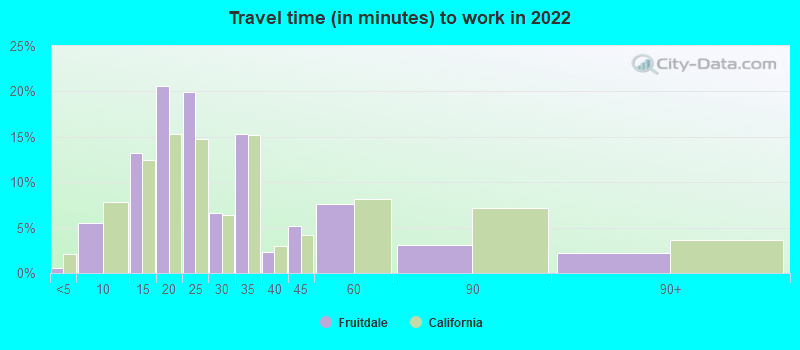
Travel time to work (commute)
- Less than 5 minutes: 0
- 5 to 9 minutes: 6
- 10 to 14 minutes: 44
- 15 to 19 minutes: 109
- 20 to 24 minutes: 151
- 25 to 29 minutes: 28
- 30 to 34 minutes: 76
- 35 to 39 minutes: 5
- 40 to 44 minutes: 6
- 45 to 59 minutes: 8
- 60 to 89 minutes: 0
- 90 or more minutes: 3
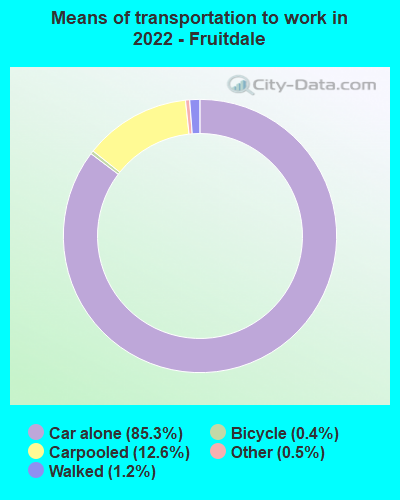
Means of transportation to work:
- Drove a car alone: 4,459 (76.1%)
- Carpooled: 677 (11.6%)
- Taxi: 30 (0.5%)
- Bicycle: 23 (0.4%)
- Walked: 62 (1.1%)
- Worked at home: 405 (6.9%)

- Unemployment by race in 2022
- Unemployment rate for Asian residents
- 19.7%Males

- Year of entry for the foreign-born population in Fruitdale, California
- 1452010 or later
- 622000 to 2009
- 01990 to 1999
- 151980 to 1989
- 01970 to 1979
- 10Before 1970

First ancestries reported:
- American: 41 (8.2%)
- Italian: 22 (4.4%)
- Romanian: 18 (3.6%)
- Lithuanian: 9 (1.8%)
- Czech: 8 (1.6%)
- English: 7 (1.4%)
- Portuguese: 6 (1.2%)
- German: 5 (1.0%)
- Norwegian: 5 (1.0%)
- Polish: 5 (1.0%)
- French: 4 (0.8%)
- Yugoslavian: 4 (0.8%)
- Northern European: 3 (0.6%)
Most common places of birth for foreign-born residents (%):
| Fruitdale: | 53.3% (120) |
| California: | 6.6% (684,672) |
| Fruitdale: | 13.3% (30) |
| California: | 4.9% (512,335) |
| Fruitdale: | 12.4% (28) |
| California: | 0.6% (66,590) |
| Fruitdale: | 12.0% (27) |
| California: | 0.2% (23,058) |
| Fruitdale: | 2.7% (6) |
| California: | 0.4% (40,224) |
| Fruitdale: | 1.8% (4) |
| California: | 0.2% (17,937) |
Place of birth for U.S.-born residents:
- This state: 778
- Other state: 167
- Northeast: 74
- Midwest: 56
- South: 23
- West: 13
76.4% of Fruitdale residents lived in the same house 1 years ago.
Out of people who lived in different houses, 14.7% lived in this county.
Out of people who lived in different counties, 72.4% lived in California.
| Fruitdale: | 76.4% |
| State average: | 88.9% |
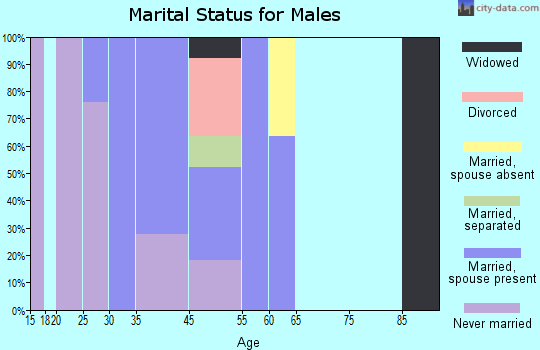
Education attainment for males 25 years and older:
- No schooling: 0
- Nursery to 4th grade: 0
- 5th and 6th grade: 0
- 7th and 8th grade: 0
- 9th grade: 0
- 10th grade: 0
- 11th grade: 0
- 12th grade, no diploma: 0
- High school graduate (or equivalency): 18
- Less than 1 year of college: 40
- Some college more than 1 year, no degree: 64
- Associate degree: 35
- Bachelor's degree: 165
- Master's degree: 114
- Professional school degree: 0
- Doctorate degree: 40

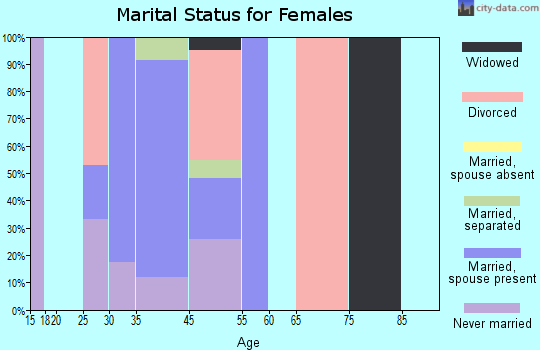
Education attainment for females 25 years and older:
- No schooling: 0
- Nursery to 4th grade: 7
- 5th and 6th grade: 0
- 7th and 8th grade: 0
- 9th grade: 0
- 10th grade: 0
- 11th grade: 0
- 12th grade, no diploma: 7
- High school graduate (or equivalency): 17
- Less than 1 year of college: 16
- Some college more than 1 year, no degree: 11
- Associate degree: 43
- Bachelor's degree: 56
- Master's degree: 149
- Professional school degree: 7
- Doctorate degree: 21

Housing units in structures:
- One, detached: 415
- One, attached: 13
- Two: 16
- 3 or 4: 21
- 5 to 9: 10
- 20 to 49: 6
- 50 or more: 27
- Boats, RVs, vans, etc.: 10
Housing units lacking complete kitchen facilities in 2022: 5.8%
House/condo owner moved in on average 32 years ago
Renter moved in on average 4 years ago

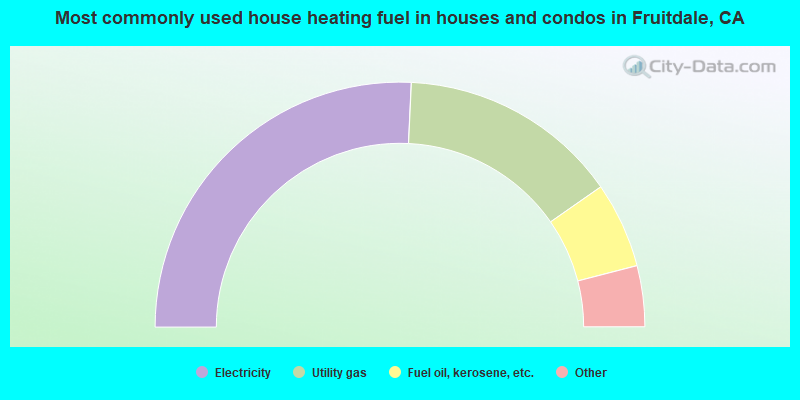
- 51.8%Electricity
- 29.3%Utility gas
- 11.4%Fuel oil, kerosene, etc.
- 3.3%No fuel used
- 2.6%Solar energy
- 1.6%Wood
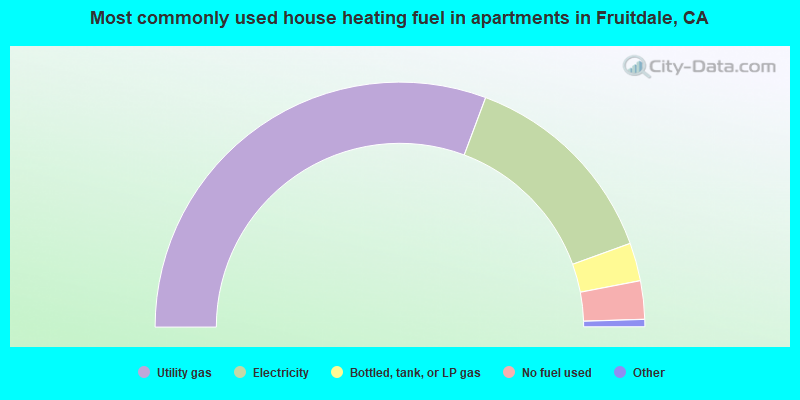
- 62.0%Utility gas
- 27.8%Electricity
- 5.1%Bottled, tank, or LP gas
- 5.1%No fuel used
Private vs. public school enrollment:
| Here: | 0.0% |
| California: | 10.5% |
| Here: | 0.0% |
| California: | 8.5% |
| Here: | 0.0% |
| California: | 15.9% |


