Housing density: 1,427 houses/condos per square mile
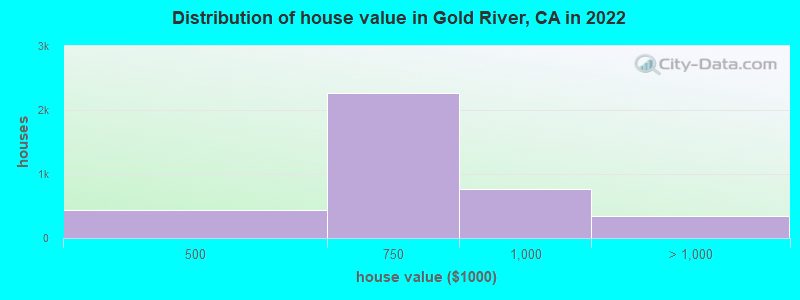
Median price asked for vacant for-sale houses and condos in 2022: $9,914,285.
Median contract rent in 2022: over $2,000 (lower quartile is $1,940, upper quartile is over $2,000)
Median rent asked for vacant for-rent units in 2022: $3,347
Median gross rent in Gold River, CA in 2022: over $2,000
Housing units in Gold River with a mortgage: 1,928 (351 second mortgage, 0 home equity loan, 242 both second mortgage and home equity loan) Houses without a mortgage: 16
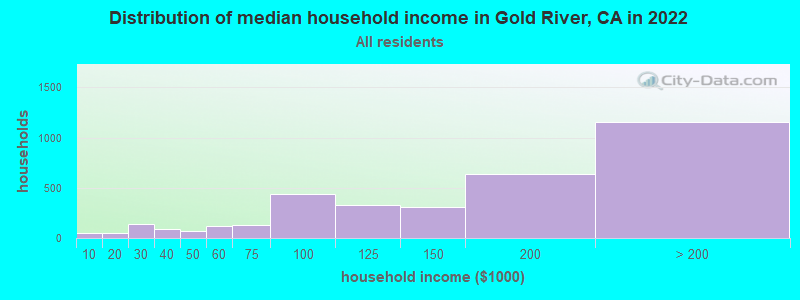
Median household income for houses/condos with a mortgage: $176,472
Median household income for apartments without a mortgage: $147,267
Size of family households: 1,553 2-persons, 485 3-persons, 421 4-persons, 109 5-persons, 12 6-persons.
Size of nonfamily households: 879 1-person, 94 2-persons, 5 3-persons.
1,110 married couples with children.
265 single-parent households (243 men, 22 women).
80.4% of residents of Gold River speak English at home.
1.9% of residents speak Spanish at home (69% speak English very well, 13% speak English well, 18% speak English not well).
7.1% of residents speak other Indo-European language at home (69% speak English very well, 18% speak English well, 14% speak English not well).
9.8% of residents speak Asian or Pacific Island language at home (72% speak English very well, 19% speak English well, 7% speak English not well, 1% don't speak English at all).
1.6% of residents speak other language at home (100% speak English very well).
Foreign born population: 1,429 (18.0%)
(92.9% of them are naturalized citizens)
Percentage of workers working in this county: 90.6% Number of people working at home: 1,050 (28.2% of all workers)
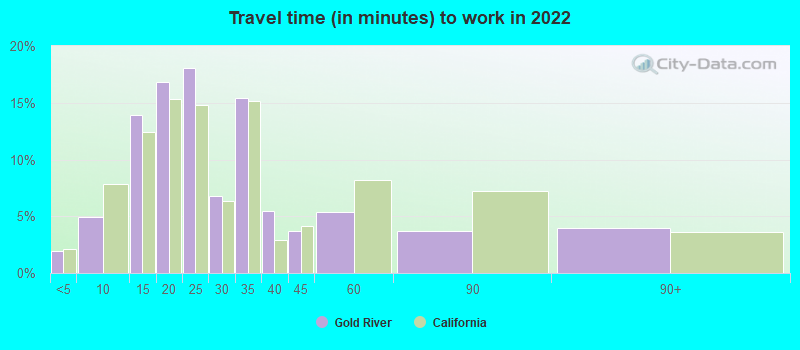
Travel time to work (commute)
Less than 5 minutes: 48
5 to 9 minutes: 127
10 to 14 minutes: 180
15 to 19 minutes: 532
20 to 24 minutes: 612
25 to 29 minutes: 383
30 to 34 minutes: 469
35 to 39 minutes: 151
40 to 44 minutes: 35
45 to 59 minutes: 116
60 to 89 minutes: 47
90 or more minutes: 66
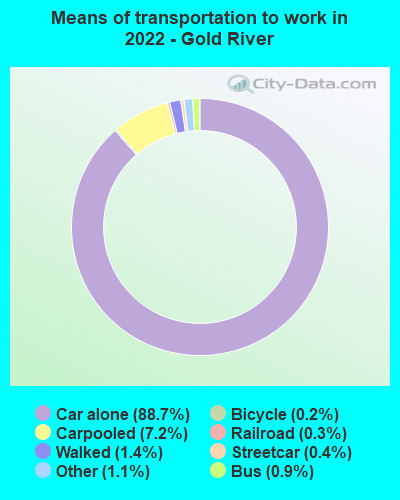
Means of transportation to work:
Drove a car alone: 3,292 (69.7%)
Carpooled: 275 (5.8%)
Bus: 17 (0.4%)
Subway or elevated rail: 8 (0.2%)
Light rail, streetcar or trolley: 6 (0.1%)
Taxi: 49 (1.0%)
Bicycle: 5 (0.1%)
Walked: 56 (1.2%)
Worked at home: 1,050 (22.2%)
Unemployment by race in 2022
Unemployment rate for White non-Hispanic residents
2.3%Males
1.9%Females
Unemployment rate for Asian residents
6.3%Males
4.1%Females
Unemployment rate for two or more race residents
6.6%Males
Year of entry for the foreign-born population in Gold River, California
2932010 or later
2872000 to 2009
2681990 to 1999
4391980 to 1989
3321970 to 1979
242Before 1970
First ancestries reported:
American: 366 (9.4%)
English: 316 (8.1%)
German: 279 (7.2%)
European: 190 (4.9%)
Irish: 171 (4.4%)
Iranian: 153 (3.9%)
Ukrainian: 115 (3.0%)
Italian: 70 (1.8%)
Norwegian: 58 (1.5%)
Portuguese: 56 (1.4%)
Moroccan: 38 (1.0%)
Swedish: 38 (1.0%)
Scottish: 31 (0.8%)
Croatian: 30 (0.8%)
Dutch: 28 (0.7%)
Northern European: 26 (0.7%)
Polish: 23 (0.6%)
British: 22 (0.6%)
Welsh: 21 (0.5%)
Eastern European: 20 (0.5%)
Russian: 18 (0.5%)
French Canadian: 12 (0.3%)
Canadian: 11 (0.3%)
Basque: 10 (0.3%)
French: 10 (0.3%)
Greek: 10 (0.3%)
Swiss: 7 (0.2%)
Most common places of birth for foreign-born residents (%):
India
Gold River:
18.3% (254)
California:
5.2% (539,184)
Korea
Gold River:
14.7% (204)
California:
3.0% (315,248)
Iran
Gold River:
12.4% (172)
California:
2.0% (206,004)
Philippines
Gold River:
9.4% (130)
California:
7.8% (818,297)
Pakistan
Gold River:
5.3% (74)
California:
0.5% (49,399)
Kenya
Gold River:
4.6% (64)
California:
0.1% (12,503)
Taiwan
Gold River:
4.5% (63)
California:
1.7% (176,274)
China, excluding Hong Kong and Taiwan
Gold River:
4.0% (56)
California:
6.6% (684,672)
South Africa
Gold River:
3.5% (49)
California:
0.2% (20,614)
Morocco
Gold River:
3.2% (44)
California:
0.1% (6,612)
Canada
Gold River:
3.2% (44)
California:
1.2% (127,477)
Vietnam
Gold River:
3.1% (43)
California:
4.9% (512,335)
Colombia
Gold River:
2.7% (37)
California:
0.5% (55,249)
Mexico
Gold River:
2.4% (33)
California:
37.2% (3,881,193)
Hong Kong
Gold River:
1.9% (27)
California:
1.0% (105,215)
Thailand
Gold River:
1.8% (25)
California:
0.6% (65,335)
Ireland
Gold River:
1.5% (21)
California:
0.2% (16,042)
Place of birth for U.S.-born residents:
This state: 4,044
Other state: 2,226
Northeast: 599
Midwest: 799
South: 492
West: 291
86.7% of Gold River residents lived in the same house 1 years ago. Out of people who lived in different houses, 42.6% lived in this county. Out of people who lived in different counties, 78.9% lived in California.
Gold River:
86.7%
State average:
88.9%
Education attainment for males 25 years and older:
No schooling: 8
Nursery to 4th grade: 0
5th and 6th grade: 0
7th and 8th grade: 0
9th grade: 0
10th grade: 0
11th grade: 0
12th grade, no diploma: 0
High school graduate (or equivalency): 151
Less than 1 year of college: 136
Some college more than 1 year, no degree: 219
Associate degree: 276
Bachelor's degree: 1,235
Master's degree: 674
Professional school degree: 418
Doctorate degree: 109
Education attainment for females 25 years and older:
No schooling: 67
Nursery to 4th grade: 0
5th and 6th grade: 0
7th and 8th grade: 0
9th grade: 0
10th grade: 0
11th grade: 0
12th grade, no diploma: 0
High school graduate (or equivalency): 247
Less than 1 year of college: 119
Some college more than 1 year, no degree: 366
Associate degree: 236
Bachelor's degree: 1,298
Master's degree: 396
Professional school degree: 292
Doctorate degree: 145
Housing units in structures:
One, detached: 3,113
One, attached: 259
Two: 14
3 or 4: 18
5 to 9: 105
10 to 19: 103
20 to 49: 49
50 or more: 137
Housing units lacking complete kitchen facilities in 2022: 0.8%
House/condo owner moved in on average 13 years ago