Grand Rapids, MI (Michigan) Houses and Residents
Estimated median house or condo value in 2022: $237,900 (it was $91,100 in 2000 )
Grand Rapids:
$237,900Michigan:
$224,400
Lower value quartile - upper value quartile: $179,000 - $314,100Mean price in 2022: Detached houses: $241,543 Here:
$241,543State:
$280,038
Townhouses or other attached units: $214,934 Here:
$214,934State:
$239,520
In 2-unit structures: $287,408 Here:
$287,408State:
$219,481
In 3-to-4-unit structures: $199,749 Here:
$199,749State:
$207,067
In 5-or-more-unit structures: $221,136 Here:
$221,136State:
$192,733
Mobile homes: $19,470 Here:
$19,470State:
$72,868
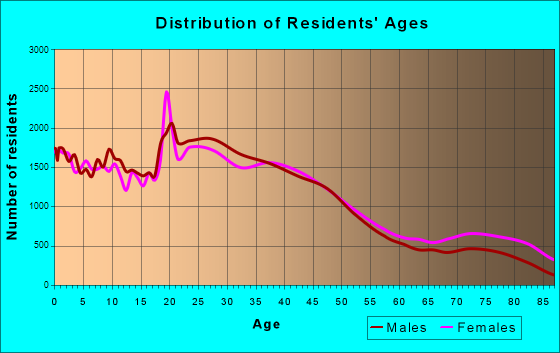
Total population: 193,792 (All urban)
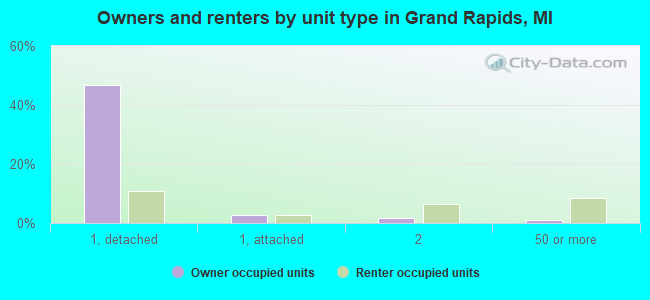
Houses: 88,725 (84,397 occupied: 44,659 owner occupied, 39,738 renter occupied )
% of renters here:
47%State:
27%
Housing density: 1,988 houses/condos per square mile
Median price asked for vacant for-sale houses and condos in 2022: $268,947.
Median contract rent in 2022: $1,117 (lower quartile is $845, upper quartile is $1,409)
Median rent asked for vacant for-rent units in 2022: $1,645
Median gross rent in Grand Rapids, MI in 2022: $1,276
Housing units in Grand Rapids with a mortgage: 29,989 (2,749 second mortgage, 52 home equity loan, 2,340 both second mortgage and home equity loan )Houses without a mortgage: 794
Median household income for houses/condos with a mortgage: $92,266
Median household income for apartments without a mortgage: $68,769
Median monthly housing costs: $1,170
Data:
Median house or condo value ($)
Median house or condo value ($ change since 2000)
Median house or condo value ($) - White
Median house or condo value ($) - Black or African American
Median house or condo value ($) - Asian
Median house or condo value ($) - Hispanic or Latino
Median house or condo value ($) - American Indian and Alaska Native
Median house or condo value ($) - Multirace
Median house or condo value ($) - Other Race
Median price asked for mobile homes ($)
Household density (households per square mile)
Mean house or condo value by units in structure - 1, detached ($)
Mean house or condo value by units in structure - 1, attached ($)
Mean house or condo value by units in structure - 2 ($)
Mean house or condo value by units in structure by units in structure - 3 or 4 ($)
Mean house or condo value by units in structure - 5 or more ($)
Mean house or condo value by units in structure - Boat, RV, van, etc. ($)
Mean house or condo value by units in structure - Mobile home ($)
Median contract rent ($)
Median contract rent - Lower quartile ($)
Median contract rent - Upper quartile ($)
Median gross rent ($)
Urban houses (%)
Rural houses (%)
Houses occupied (%)
Houses occupied (% change since 2000)
Houses owner occupied (%)
Houses owner occupied (% change since 2000)
Houses renter occupied (%)
Houses renter occupied (% change since 2000)
Vacant housing units - For rent (%)
Vacant housing units - For rent (% change since 2000)
Vacant housing units - For sale only (%)
Vacant housing units - For sale only (% change since 2000)
Vacant housing units - Rented or sold, not occupied (%)
Vacant housing units - Rented or sold, not occupied (% change since 2000)
Vacant housing units - For seasonal, recreational, or occasional use (%)
Vacant housing units - For seasonal, recreational, or occasional use (% change since 2000)
Vacant housing units - For migrant workers (%)
Vacant housing units - For migrant workers (% change since 2000)
Vacant housing units - Other vacant (%)
Vacant housing units - Other vacant (% change since 2000)
Median monthly housing costs ($)
Median household income for houses/condos with a mortgage ($)
Median household income for houses/condos without a mortgage ($)
Median household income ($)
Median household income ($) - White
Median household income ($) - Black or African American
Median household income ($) - Asian
Median household income ($) - Hispanic or Latino
Median household income ($) - American Indian and Alaska Native
Median household income ($) - Multirace
Median household income ($) - Other Race
Mortgage status - with mortgage (%)
Mortgage status - with second mortgage (%)
Mortgage status - with home equity loan (%)
Mortgage status - with both second mortgage and home equity loan (%)
Mortgage status - without a mortgage (%)
Median year house/condo built
Median year apartment built
Household type by relationship - Male householder living alone (%)
Household type by relationship - Male householder not living alone (%)
Household type by relationship - Female householder living alone (%)
Household type by relationship - Female householder not living alone (%)
Household type by relationship - Opposite-Sex spouse (%)
Household type by relationship - Same-Sex spouse (%)
Household type by relationship - Opposite-Sex unmarried partner (%)
Household type by relationship - Same-Sex unmarried partner (%)
Household type by relationship - In group quarters (%)
Size of family households - 2-person household (%)
Size of family households - 3-person household (%)
Size of family households - 4-person household (%)
Size of family households - 5-person household (%)
Size of family households - 6-person household (%)
Size of family households - 7-or-more-person household (%)
Size of nonfamily households - 1-person household (%)
Size of nonfamily households - 2-person household (%)
Size of nonfamily households - 3-person household (%)
Size of nonfamily households - 4-person household (%)
Size of nonfamily households - 5-person household (%)
Size of nonfamily households - 6-person household (%)
Size of nonfamily households - 7-or-moreperson household (%)
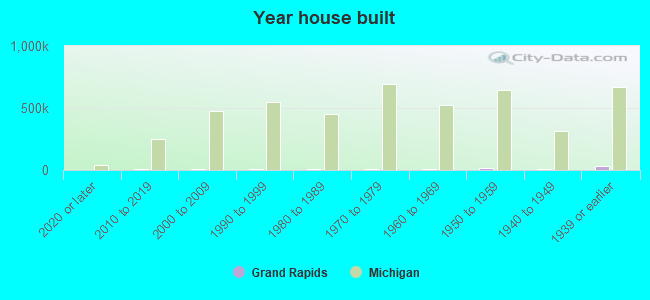
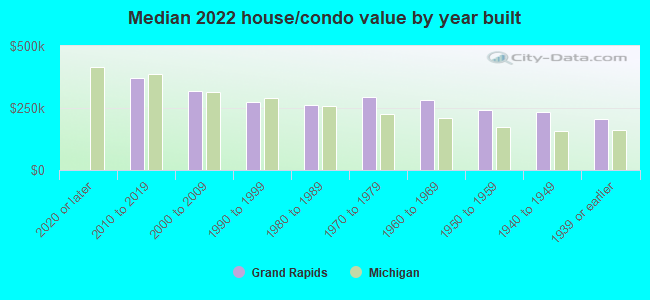
Year house built - Built 2010 or later (%)
Year house built - Built 2000 to 2009 (%)
Year house built - Built 1990 to 1999 (%)
Year house built - Built 1980 to 1989 (%)
Year house built - Built 1970 to 1979 (%)
Year house built - Built 1960 to 1969 (%)
Year house built - Built 1950 to 1959 (%)
Year house built - Built 1940 to 1949 (%)
Year house built - Built 1939 or earlier (%)
Median number of rooms in houses and condos
Median number of rooms in apartments
Median number of bedrooms in owner occupied houses
Mean number of bedrooms in owner occupied houses
Median number of bedrooms in renter occupied houses
Mean number of bedrooms in renter occupied houses
Median number of vehichles in owner occupied houses
Mean number of vehichles in owner occupied houses
Median number of vehichles in renter occupied houses
Mean number of vehichles in renter occupied houses
Rooms in owner-occupied houses - 1 room (%)
Rooms in owner-occupied houses - 2 rooms (%)
Rooms in owner-occupied houses - 3 rooms (%)
Rooms in owner-occupied houses - 4 rooms (%)
Rooms in owner-occupied houses - 5 rooms (%)
Rooms in owner-occupied houses - 6 rooms (%)
Rooms in owner-occupied houses - 7 rooms (%)
Rooms in owner-occupied houses - 8 rooms (%)
Rooms in owner-occupied houses - 9+ rooms (%)
Rooms in renter-occupied houses - 1 room (%)
Rooms in renter-occupied houses - 2 rooms (%)
Rooms in renter-occupied houses - 3 rooms (%)
Rooms in renter-occupied houses - 4 rooms (%)
Rooms in renter-occupied houses - 5 rooms (%)
Rooms in renter-occupied houses - 6 rooms (%)
Rooms in renter-occupied houses - 7 rooms (%)
Rooms in renter-occupied houses - 8 rooms (%)
Rooms in renter-occupied houses - 9+ rooms (%)
Bedrooms in owner-occupied houses - no bedrooms (%)
Bedrooms in owner-occupied houses - 1 bedroom (%)
Bedrooms in owner-occupied houses - 2 bedrooms (%)
Bedrooms in owner-occupied houses - 3 bedrooms (%)
Bedrooms in owner-occupied houses - 4 bedrooms (%)
Bedrooms in owner-occupied houses - 5+ bedrooms (%)
Bedrooms in renter-occupied houses - no bedrooms (%)
Bedrooms in renter-occupied houses - 1 bedroom (%)
Bedrooms in renter-occupied houses - 2 bedrooms (%)
Bedrooms in renter-occupied houses - 3 bedrooms (%)
Bedrooms in renter-occupied houses - 4 bedrooms (%)
Bedrooms in renter-occupied houses - 5+ bedrooms (%)
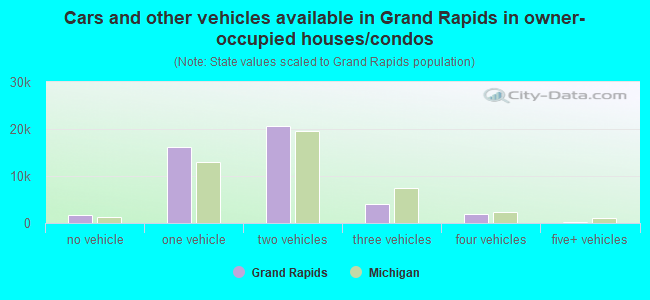
Vehicles available in owner-occupied houses - no vehicle available (%)
Vehicles available in owner-occupied houses - 1 vehicle available(%)
Vehicles available in owner-occupied houses - 2 Vehicles available (%)
Vehicles available in owner-occupied houses - 3 Vehicles available (%)
Vehicles available in owner-occupied houses - 4 Vehicles available (%)
Vehicles available in owner-occupied houses - 5+ Vehicles available (%)
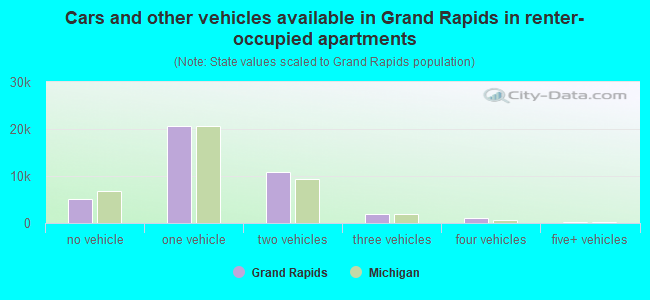
Vehicles available in renter-occupied houses - no vehicle available (%)
Vehicles available in renter-occupied houses - 1 vehicle available (%)
Vehicles available in renter-occupied houses - 2 Vehicles available (%)
Vehicles available in renter-occupied houses - 3 Vehicles available (%)
Vehicles available in renter-occupied houses - 4 Vehicles available (%)
Vehicles available in renter-occupied houses - 5+ Vehicles available (%)
Housing units in structures - 1, detached (%)
Housing units in structures - 1, attached (%)
Housing units in structures - 2 (%)
Housing units in structures - 3 or 4 (%)
Housing units in structures - 5 to 9 (%)
Housing units in structures - 10 to 19 (%)
Housing units in structures - 20 to 49 (%)
Housing units in structures - 50 or more (%)
Housing units in structures - Mobile home (%)
Housing units in structures - Boat, RV, van, etc. (%)
Housing units in structures - Owners - 1, detached (%)
Housing units in structures - Owners - 1, attached (%)
Housing units in structures - Owners - 2 (%)
Housing units in structures - Owners - 3 or 4 (%)
Housing units in structures - Owners - 5 to 9 (%)
Housing units in structures - Owners - 10 to 19 (%)
Housing units in structures - Owners - 20 to 49 (%)
Housing units in structures - Owners - 50 or more (%)
Housing units in structures - Owners - Mobile home (%)
Housing units in structures - Owners - Boat, RV, van, etc. (%)
Housing units in structures - Renters - 1, detached (%)
Housing units in structures - Renters - 1, attached (%)
Housing units in structures - Renters - 2 (%)
Housing units in structures - Renters - 3 or 4 (%)
Housing units in structures - Renters - 5 to 9 (%)
Housing units in structures - Renters - 10 to 19 (%)
Housing units in structures - Renters - 20 to 49 (%)
Housing units in structures - Renters - 50 or more (%)
Housing units in structures - Renters - Mobile home (%)
Housing units in structures - Renters - Boat, RV, van, etc. (%)
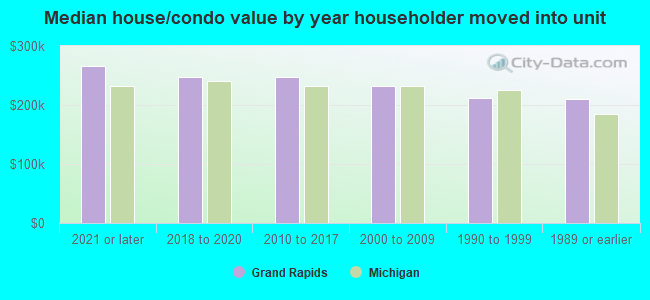
House/condo owner moved in on average (years ago)
Renter moved in on average (years ago)
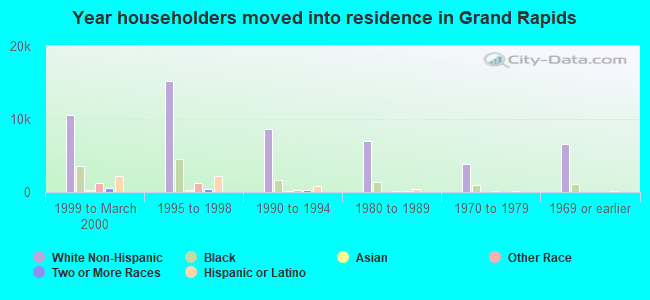
Year householder moved into unit - Moved in 1999 to March 2000 (%)
Year householder moved into unit - Moved in 1999 to March 2000 (%) - White
Year householder moved into unit - Moved in 1999 to March 2000 (%) - Black or African American
Year householder moved into unit - Moved in 1999 to March 2000 (%) - Asian
Year householder moved into unit - Moved in 1999 to March 2000 (%) - Hispanic or Latino
Year householder moved into unit - Moved in 1999 to March 2000 (%) - American Indian and Alaska Native
Year householder moved into unit - Moved in 1999 to March 2000 (%) - Multirace
Year householder moved into unit - Moved in 1999 to March 2000 (%) - Other Race
Year householder moved into unit - Moved in 1995 to 1998 (%)
Year householder moved into unit - Moved in 1995 to 1998 (%) - White
Year householder moved into unit - Moved in 1995 to 1998 (%) - Black or African American
Year householder moved into unit - Moved in 1995 to 1998 (%) - Asian
Year householder moved into unit - Moved in 1995 to 1998 (%) - Hispanic or Latino
Year householder moved into unit - Moved in 1995 to 1998 (%) - American Indian and Alaska Native
Year householder moved into unit - Moved in 1995 to 1998 (%) - Multirace
Year householder moved into unit - Moved in 1995 to 1998 (%) - Other Race
Year householder moved into unit - Moved in 1990 to 1994 (%)
Year householder moved into unit - Moved in 1990 to 1994 (%) - White
Year householder moved into unit - Moved in 1990 to 1994 (%) - Black or African American
Year householder moved into unit - Moved in 1990 to 1994 (%) - Asian
Year householder moved into unit - Moved in 1990 to 1994 (%) - Hispanic or Latino
Year householder moved into unit - Moved in 1990 to 1994 (%) - American Indian and Alaska Native
Year householder moved into unit - Moved in 1990 to 1994 (%) - Multirace
Year householder moved into unit - Moved in 1990 to 1994 (%) - Other Race
Year householder moved into unit - Moved in 1980 to 1989 (%)
Year householder moved into unit - Moved in 1980 to 1989 (%) - White
Year householder moved into unit - Moved in 1980 to 1989 (%) - Black or African American
Year householder moved into unit - Moved in 1980 to 1989 (%) - Asian
Year householder moved into unit - Moved in 1980 to 1989 (%) - Hispanic or Latino
Year householder moved into unit - Moved in 1980 to 1989 (%) - American Indian and Alaska Native
Year householder moved into unit - Moved in 1980 to 1989 (%) - Multirace
Year householder moved into unit - Moved in 1980 to 1989 (%) - Other Race
Year householder moved into unit - Moved in 1970 to 1979 (%)
Year householder moved into unit - Moved in 1970 to 1979 (%) - White
Year householder moved into unit - Moved in 1970 to 1979 (%) - Black or African American
Year householder moved into unit - Moved in 1970 to 1979 (%) - Asian
Year householder moved into unit - Moved in 1970 to 1979 (%) - Hispanic or Latino
Year householder moved into unit - Moved in 1970 to 1979 (%) - American Indian and Alaska Native
Year householder moved into unit - Moved in 1970 to 1979 (%) - Multirace
Year householder moved into unit - Moved in 1970 to 1979 (%) - Other Race
Year householder moved into unit - Moved in 1969 or earlier (%)
Year householder moved into unit - Moved in 1969 or earlier (%) - White
Year householder moved into unit - Moved in 1969 or earlier (%) - Black or African American
Year householder moved into unit - Moved in 1969 or earlier (%) - Asian
Year householder moved into unit - Moved in 1969 or earlier (%) - Hispanic or Latino
Year householder moved into unit - Moved in 1969 or earlier (%) - American Indian and Alaska Native
Year householder moved into unit - Moved in 1969 or earlier (%) - Multirace
Year householder moved into unit - Moved in 1969 or earlier (%) - Other Race
Housing units lacking complete plumbing facilities (%)
Housing units lacking complete kitchen facilities (%)
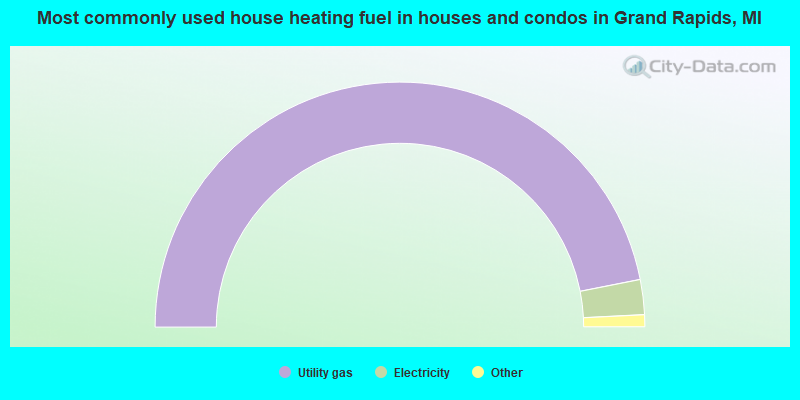
House heating fuel used in houses and condos - Utility gas (%)
House heating fuel used in houses and condos - Bottled, tank, or LP gas (%)
House heating fuel used in houses and condos - Electricity (%)
House heating fuel used in houses and condos - Fuel oil, kerosene, etc. (%)
House heating fuel used in houses and condos - Coal or coke (%)
House heating fuel used in houses and condos - Wood (%)
House heating fuel used in houses and condos - Solar energy (%)
House heating fuel used in houses and condos - Other fuel (%)
House heating fuel used in houses and condos - No fuel used (%)
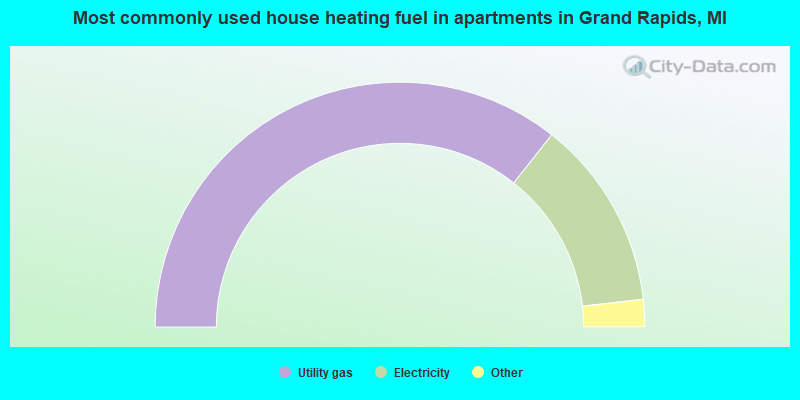
House heating fuel used in apartments - Utility gas (%)
House heating fuel used in apartments - Bottled, tank, or LP gas (%)
House heating fuel used in apartments - Electricity (%)
House heating fuel used in apartments - Fuel oil, kerosene, etc. (%)
House heating fuel used in apartments - Coal or coke (%)
House heating fuel used in apartments - Wood (%)
House heating fuel used in apartments - Solar energy (%)
House heating fuel used in apartments - Other fuel (%)
House heating fuel used in apartments - No fuel used (%)
Median year house/condo built: 1951Median year apartment built: 1959Household type by relationship:
Households: 196,904
Male householders: 39,523 (12,711 living alone ), Female householders: 44,874 (18,026 living alone )25,833 spouses (25,529 opposite-sex spouses ), 10,097 unmarried partners , (8,650 opposite-sex unmarried partners ), 46,365 children (44,032 natural , 1,273 adopted , 1,060 stepchildren ), 1,723 grandchildren , 2,577 brothers or sisters , 2,211 parents , 0 foster children , 4,019 other relatives , 12,575 non-relatives In group quarters: 7,107
Size of family households: 19,045 2-persons , 10,301 3-persons , 5,846 4-persons , 2,668 5-persons , 1,858 6-persons , 749 7-or-more-persons .
Size of nonfamily households: 30,737 1-person , 10,699 2-persons , 1,252 3-persons , 1,045 4-persons , 152 5-persons , 45 6-persons .
19,640 married couples with children. single-parent households (2,501 men , 11,463 women ).
83.0% of residents of Grand Rapids speak English at home. of residents speak Spanish at home (46% speak English very well , 20% speak English well , 22% speak English not well , 12% don't speak English at all ).of residents speak other Indo-European language at home (68% speak English very well , 13% speak English well , 14% speak English not well , 5% don't speak English at all ).of residents speak Asian or Pacific Island language at home (41% speak English very well , 42% speak English well , 13% speak English not well , 4% don't speak English at all ).of residents speak other language at home (31% speak English very well , 34% speak English well , 25% speak English not well , 10% don't speak English at all ).
Foreign born population: 21,359 (10.8%)of them are naturalized citizens )
Median number of rooms in houses and condos:
Median number of rooms in apartments
Owner-occupied Renter-occupied
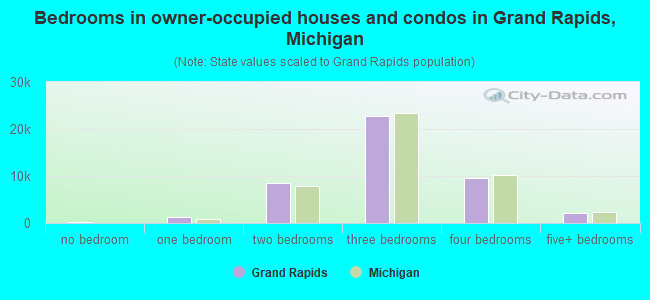
Bedrooms in owner-occupied houses and condos in Grand Rapids, Michigan
311 no bedroom 1,314 1 bedroom 8,469 2 bedrooms 22,687 3 bedrooms 9,649 4 bedrooms 2,229 5+ bedrooms
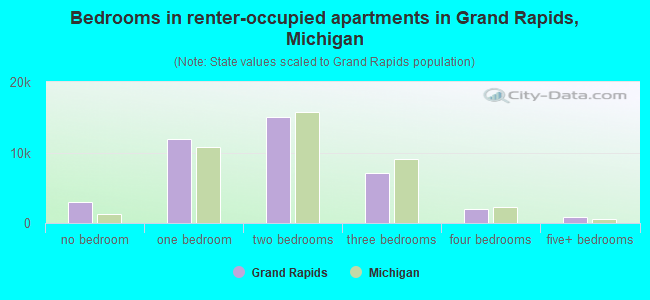
Bedrooms in renter-occupied apartments in Grand Rapids, Michigan
2,950 no bedroom 11,869 1 bedroom 15,068 2 bedrooms 7,051 3 bedrooms 1,946 4 bedrooms 854 5+ bedrooms
Owner-occupied Renter-occupied
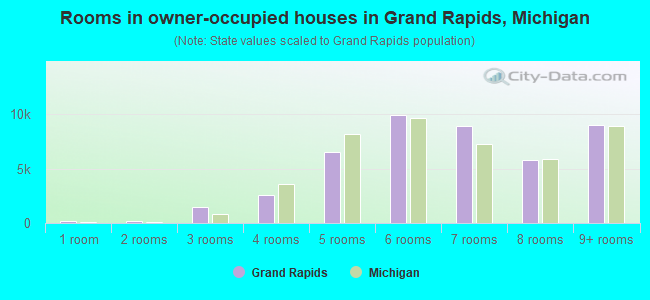
Rooms in owner-occupied houses in Grand Rapids, Michigan
195 1 room 167 2 rooms 1,500 3 rooms 2,584 4 rooms 6,508 5 rooms 9,952 6 rooms 8,904 7 rooms 5,844 8 rooms 9,005 9+ rooms
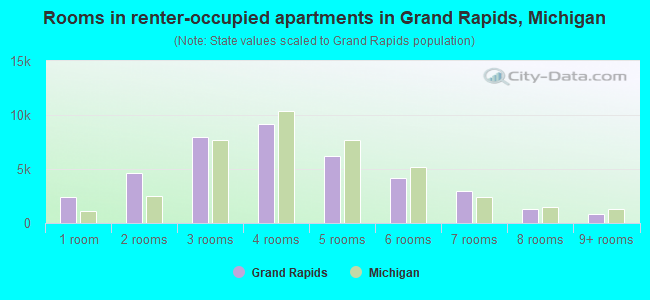
Rooms in renter-occupied apartments in Grand Rapids, Michigan
2,380 1 room 4,666 2 rooms 7,980 3 rooms 9,147 4 rooms 6,237 5 rooms 4,173 6 rooms 2,978 7 rooms 1,301 8 rooms 876 9+ rooms
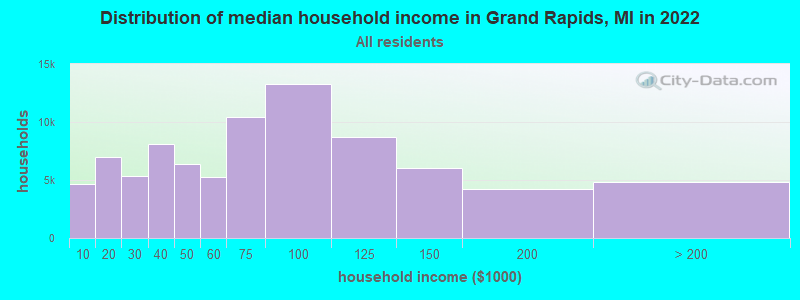
Grand Rapids, MI household income distribution 4,666 Less than $10,0007,001 $10,000 to $19,9995,375 $20,000 to $29,9998,141 $30,000 to $39,9996,394 $40,000 to $49,9995,301 $50,000 to $59,99910,460 $60,000 to $74,99913,244 $75,000 to $99,9998,746 $100,000 to $124,9996,032 $125,000 to $149,9994,200 $150,000 to $199,9994,837 $200,000 or more
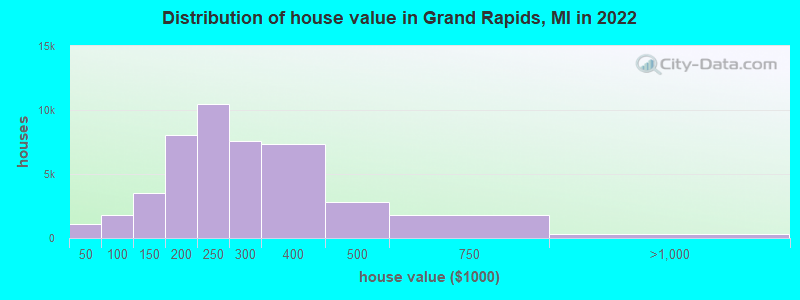
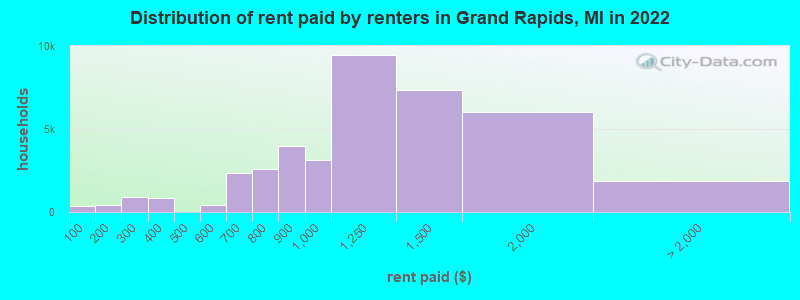
Home value of owner - occupied houses in 2022 in Grand Rapids, MI 233 Less than $10,000165 $10,000 to $14,999455 $15,000 to $19,999148 $20,000 to $24,99932 $25,000 to $29,99985 $40,000 to $49,99996 $50,000 to $59,999167 $60,000 to $69,999343 $70,000 to $79,999769 $80,000 to $89,999310 $90,000 to $99,9992,363 $100,000 to $124,9991,177 $125,000 to $149,9994,191 $150,000 to $174,9993,894 $175,000 to $199,99910,431 $200,000 to $249,9997,596 $250,000 to $299,9997,374 $300,000 to $399,9992,774 $400,000 to $499,9991,780 $500,000 to $749,999243 $750,000 to $999,99933 $1,000,000 to $1,499,999Rent paid by renters in 2022 in Grand Rapids, MI 355 Less than $100205 $100 to $149212 $150 to $199469 $200 to $249423 $250 to $299545 $300 to $349320 $350 to $399260 $500 to $549184 $550 to $599705 $600 to $6491,627 $650 to $6991,487 $700 to $7491,105 $750 to $7993,996 $800 to $8993,109 $900 to $9999,469 $1,000 to $1,2497,347 $1,250 to $1,4996,032 $1,500 to $1,999615 $2,000 to $2,49955 $2,500 to $2,999325 $3,500 or more893 No cash rent
Percentage of workers working in this county: 91.9%Number of people working at home: 14,401 (13.1% of all workers )
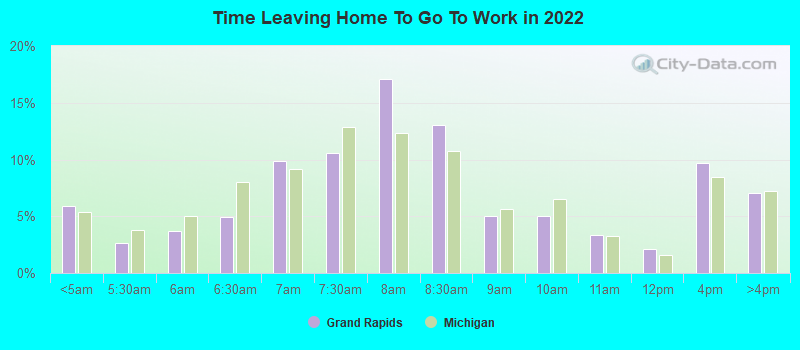
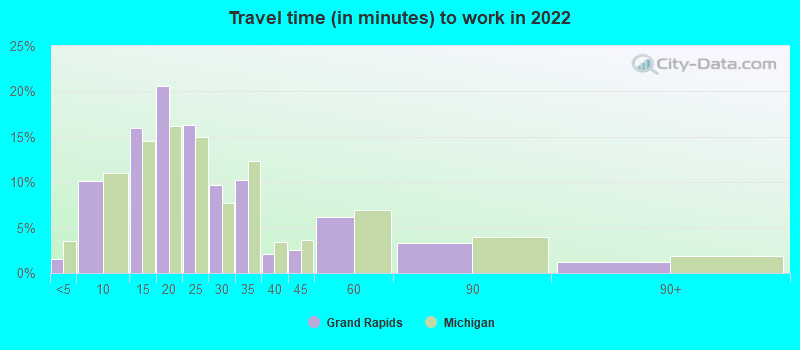
Travel time to work (commute)
Less than 5 minutes: 1,6525 to 9 minutes: 12,51110 to 14 minutes: 18,80915 to 19 minutes: 23,28120 to 24 minutes: 16,54025 to 29 minutes: 7,72030 to 34 minutes: 5,56135 to 39 minutes: 1,57740 to 44 minutes: 1,05245 to 59 minutes: 2,94660 to 89 minutes: 2,94990 or more minutes: 796
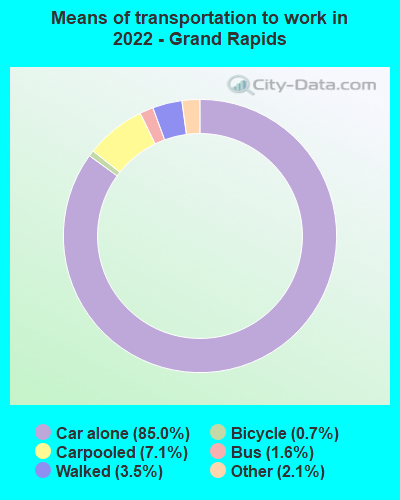
Means of transportation to work:
Drove a car alone: 111,730 (76.6%)Carpooled: 9,272 (6.4%)Bus : 2,132 (1.5%)Light rail, streetcar or trolley : 56 (0.0%)Taxi: 2,769 (1.9%)Bicycle: 981 (0.7%)Walked: 4,574 (3.1%)Worked at home: 14,401 (9.9%)
Unemployment by race in 2022
Unemployment rate for White non-Hispanic residents 3.9% Males2.1% FemalesUnemployment rate for Black residents 10.8% Males3.3% FemalesUnemployment rate for American Indian and Alaska Native residents 1.7% MalesUnemployment rate for Asian residents 3.3% Males1.6% FemalesUnemployment rate for other race residents 4.8% Males10.2% FemalesUnemployment rate for two or more race residents 5.8% Males5.7% FemalesUnemployment rate for Hispanic or Latino residents 7.0% Males9.1% Females
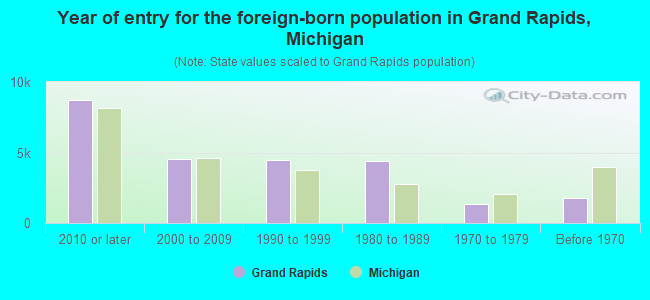
Year of entry for the foreign-born population in Grand Rapids, Michigan
8,754 2010 or later 4,569 2000 to 2009 4,459 1990 to 1999 4,386 1980 to 1989 1,367 1970 to 1979 1,767 Before 1970
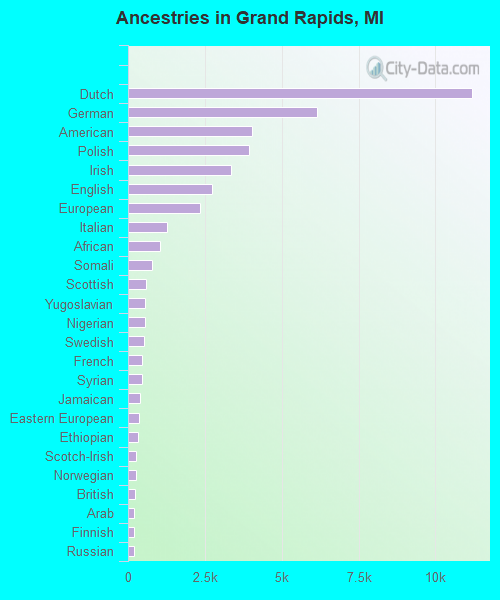
First ancestries reported:
Dutch: 11,181 (12.0%)
German: 6,141 (6.6%)
American: 4,044 (4.3%)
Polish: 3,928 (4.2%)
Irish: 3,341 (3.6%)
English: 2,730 (2.9%)
European: 2,342 (2.5%)
Italian: 1,267 (1.4%)
African: 1,056 (1.1%)
Somali: 789 (0.8%)
Scottish: 572 (0.6%)
Yugoslavian: 562 (0.6%)
Nigerian: 540 (0.6%)
Swedish: 516 (0.6%)
French: 461 (0.5%)
Syrian: 449 (0.5%)
Jamaican: 395 (0.4%)
Eastern European: 347 (0.4%)
Ethiopian: 319 (0.3%)
Scotch-Irish: 275 (0.3%)
Norwegian: 271 (0.3%)
British: 222 (0.2%)
Arab: 205 (0.2%)
Finnish: 186 (0.2%)
Russian: 183 (0.2%)
Liberian: 176 (0.2%)
Danish: 176 (0.2%)
Hungarian: 174 (0.2%)
Greek: 161 (0.2%)
French Canadian: 148 (0.2%)
Lithuanian: 143 (0.2%)
Haitian: 143 (0.2%)
Northern European: 140 (0.1%)
Ukrainian: 127 (0.1%)
Latvian: 126 (0.1%)
Canadian: 123 (0.1%)
Portuguese: 121 (0.1%)
Iraqi: 118 (0.1%)
Czech: 107 (0.1%)
Zimbabwean: 99 (0.1%)
Lebanese: 87 (0.09%)
Scandinavian: 73 (0.08%)
Welsh: 71 (0.08%)
Sudanese: 66 (0.07%)
Albanian: 54 (0.06%)
Ghanaian: 48 (0.05%)
Swiss: 48 (0.05%)
Romanian: 46 (0.05%)
Iranian: 45 (0.05%)
Serbian: 45 (0.05%)
Czechoslovakian: 40 (0.04%)
Palestinian: 33 (0.04%)
Armenian: 25 (0.03%)
Israeli: 21 (0.02%)
Maltese: 20 (0.02%)
Slovak: 20 (0.02%)
Austrian: 18 (0.02%)
Turkish: 13 (0.01%)
Kenyan: 11 (0.01%)
Belgian: 10 (0.01%)
Pennsylvania German: 9 (0.01%)
Moroccan: 9 (0.01%)
Trinidadian and Tobagonian: 8 (0.01%)
Brazilian: 6 (0.01%)
South African: 5 (0.01%)
Slovene: 5 (0.01%)
Most common places of birth for foreign-born residents (%): Mexico Grand Rapids:
28.5% (5,954)Michigan:
10.9% (75,965)
Guatemala Grand Rapids:
15.1% (3,151)Michigan:
1.0% (7,097)
Other Eastern Africa Grand Rapids:
6.7% (1,394)Michigan:
0.5% (3,687)
Korea Grand Rapids:
4.1% (854)Michigan:
3.0% (20,884)
Democratic Republic of Congo (Zaire) Grand Rapids:
3.5% (726)Michigan:
0.2% (1,416)
India Grand Rapids:
3.4% (706)Michigan:
11.1% (77,240)
China, excluding Hong Kong and Taiwan Grand Rapids:
3.3% (698)Michigan:
4.9% (34,295)
Burma (Myanmar) Grand Rapids:
2.7% (561)Michigan:
0.6% (4,087)
Congo Grand Rapids:
2.1% (431)Michigan:
0.1% (963)
Honduras Grand Rapids:
1.9% (399)Michigan:
0.5% (3,798)
Vietnam Grand Rapids:
1.9% (388)Michigan:
1.8% (12,679)
Netherlands Grand Rapids:
1.8% (381)Michigan:
0.5% (3,681)
Bosnia and Herzegovina Grand Rapids:
1.7% (350)Michigan:
0.9% (6,009)
Canada Grand Rapids:
1.7% (349)Michigan:
5.0% (35,052)
Iraq Grand Rapids:
1.6% (338)Michigan:
8.1% (55,954)
Cuba Grand Rapids:
1.6% (338)Michigan:
0.9% (6,481)
Place of birth for U.S.-born residents:
This state: 138,039Other state: 35,580Northeast: 4,609Midwest: 13,740South: 11,046West: 6,185 79.9% of Grand Rapids residents lived in the same house 1 years ago.
Out of people who lived in different houses, 39.1% lived in this county.
Out of people who lived in different counties, 72.4% lived in Michigan.
Grand Rapids:
79.9%State average:
88.4%
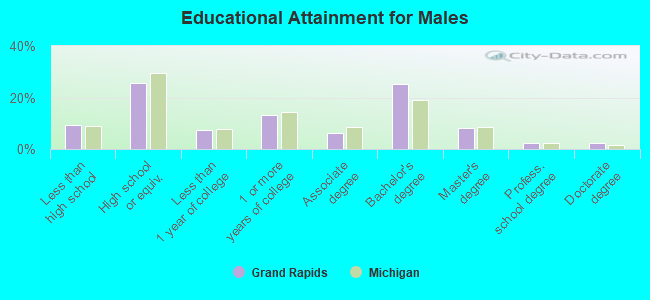
Education attainment for males 25 years and older:
No schooling: 883Nursery to 4th grade: 6905th and 6th grade: 3117th and 8th grade: 7949th grade: 65110th grade: 71711th grade: 84612th grade, no diploma: 1,310High school graduate (or equivalency): 17,002Less than 1 year of college: 4,899Some college more than 1 year, no degree: 8,632Associate degree: 4,113Bachelor's degree: 16,583Master's degree: 5,358Professional school degree: 1,527Doctorate degree: 1,633
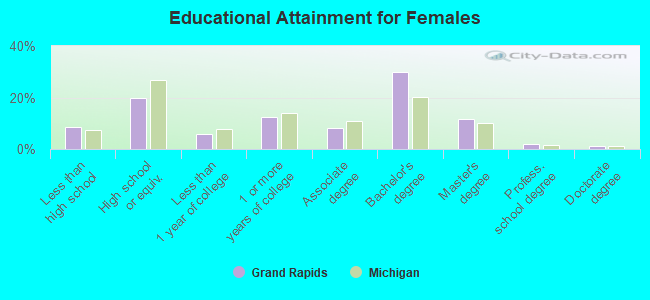
Education attainment for females 25 years and older:
No schooling: 1,809Nursery to 4th grade: 6475th and 6th grade: 6957th and 8th grade: 4539th grade: 41510th grade: 32311th grade: 42512th grade, no diploma: 1,232High school graduate (or equivalency): 13,709Less than 1 year of college: 4,132Some college more than 1 year, no degree: 8,685Associate degree: 5,646Bachelor's degree: 20,494Master's degree: 8,023Professional school degree: 1,339Doctorate degree: 854
Housing units in structures:
One, detached: 48,443One, attached: 5,473Two: 7,5153 or 4: 6,3105 to 9: 4,86710 to 19: 2,94420 to 49: 3,86350 or more: 9,143Mobile homes: 167Housing units lacking complete plumbing facilities in 2022: 0.4%Housing units lacking complete kitchen facilities in 2022: 1.5%House/condo owner moved in on average 10 years ago
Renter moved in on average 2 years ago
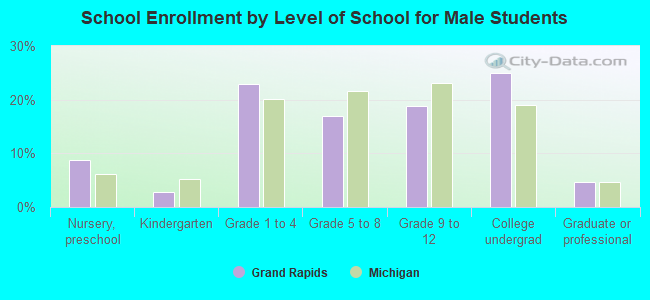
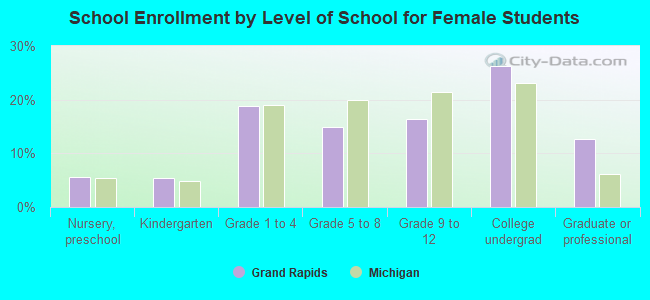
Private vs. public school enrollment:
Students in private schools in grades 1 to 8 (elementary and middle school): 4,270 Students in private schools in grades 9 to 12 (high school): 1,704 Students in private undergraduate colleges: 4,132