Housing density: 1,500 houses/condos per square mile
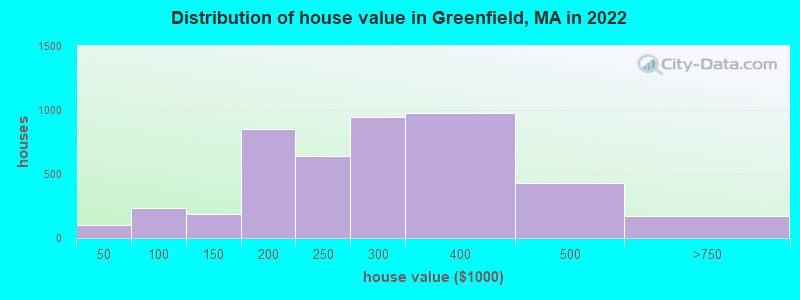
Median price asked for vacant for-sale houses and condos in 2022 in this county: $191,319.
Median contract rent in 2022: $806 (lower quartile is $374, upper quartile is $1,102)
Median rent asked for vacant for-rent units in 2022: $767
Median gross rent in Greenfield, MA in 2022: $910
Housing units in Greenfield with a mortgage: 2,903 (337 second mortgage, 0 home equity loan, 289 both second mortgage and home equity loan) Houses without a mortgage: 254
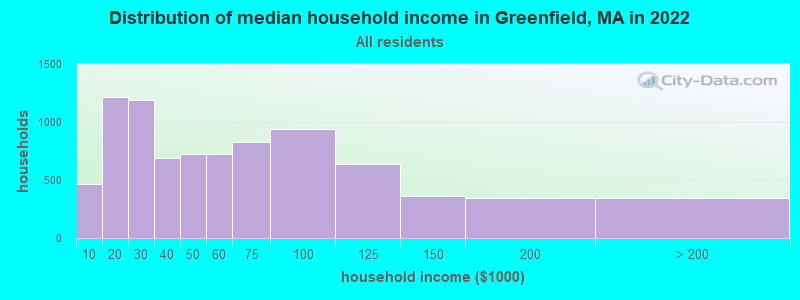
Median household income for houses/condos with a mortgage: $69,983
Median household income for apartments without a mortgage: $64,659
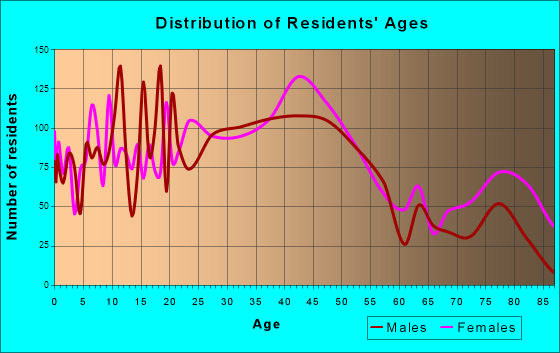
1,673 married couples with children.
1,063 single-parent households (336 men, 727 women).
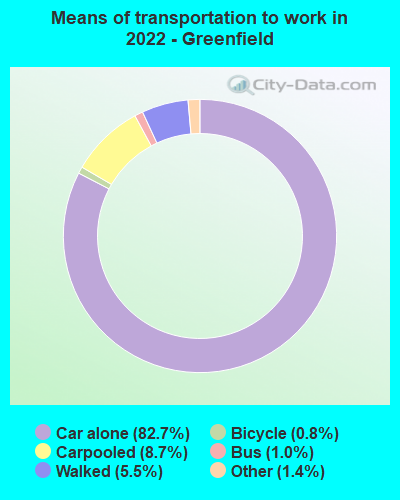
91.5% of residents of Greenfield speak English at home.
4.3% of residents speak Spanish at home (55% speak English very well, 25% speak English well, 11% speak English not well, 9% don't speak English at all).
2.4% of residents speak other Indo-European language at home (41% speak English very well, 18% speak English well, 31% speak English not well, 10% don't speak English at all).
1.5% of residents speak Asian or Pacific Island language at home (24% speak English very well, 35% speak English well, 40% speak English not well).
0.3% of residents speak other language at home (62% speak English very well, 38% speak English well).
Foreign born population: 1,066 (6.0%)
(64.2% of them are naturalized citizens)
Year of entry for the foreign-born population in Greenfield, Massachusetts
2062010 or later
3082000 to 2009
1351990 to 1999
531980 to 1989
611970 to 1979
199Before 1970
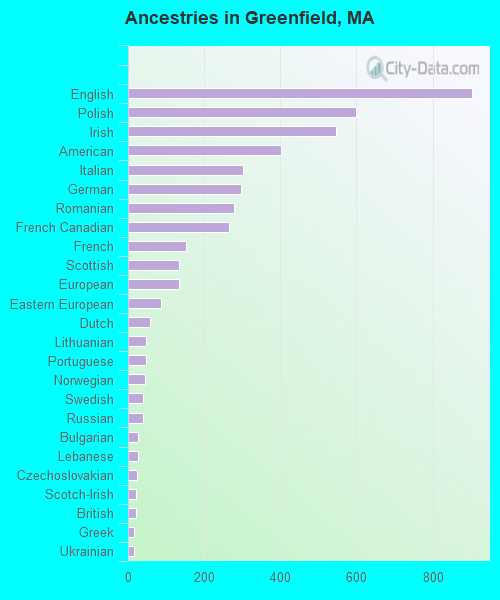
First ancestries reported:
English: 903 (14.8%)
Polish: 598 (9.8%)
Irish: 547 (9.0%)
American: 402 (6.6%)
Italian: 302 (4.9%)
German: 298 (4.9%)
Romanian: 278 (4.6%)
French Canadian: 266 (4.4%)
French: 152 (2.5%)
Scottish: 135 (2.2%)
European: 134 (2.2%)
Eastern European: 87 (1.4%)
Dutch: 57 (0.9%)
Lithuanian: 47 (0.8%)
Portuguese: 47 (0.8%)
Norwegian: 44 (0.7%)
Swedish: 40 (0.7%)
Russian: 39 (0.6%)
Bulgarian: 26 (0.4%)
Lebanese: 25 (0.4%)
Czechoslovakian: 23 (0.4%)
Scotch-Irish: 22 (0.4%)
British: 20 (0.3%)
Greek: 17 (0.3%)
Ukrainian: 15 (0.2%)
Iraqi: 12 (0.2%)
Danish: 12 (0.2%)
Swiss: 10 (0.2%)
Australian: 9 (0.1%)
Scandinavian: 6 (0.10%)
Celtic: 3 (0.05%)
Czech: 3 (0.05%)
Most common places of birth for foreign-born residents (%):
Moldova
Greenfield:
20.6% (196)
Massachusetts:
0.2% (2,537)
Venezuela
Greenfield:
11.5% (109)
Massachusetts:
0.4% (5,265)
Portugal
Greenfield:
5.9% (56)
Massachusetts:
4.1% (50,360)
Dominican Republic
Greenfield:
4.9% (47)
Massachusetts:
8.3% (101,767)
Costa Rica
Greenfield:
4.9% (47)
Massachusetts:
0.2% (2,160)
Vietnam
Greenfield:
4.3% (41)
Massachusetts:
3.0% (37,197)
Canada
Greenfield:
4.3% (41)
Massachusetts:
2.3% (28,158)
Cambodia
Greenfield:
4.2% (40)
Massachusetts:
1.2% (14,305)
China, excluding Hong Kong and Taiwan
Greenfield:
3.8% (36)
Massachusetts:
8.4% (103,233)
Japan
Greenfield:
3.4% (32)
Massachusetts:
0.6% (7,301)
Brazil
Greenfield:
3.3% (31)
Massachusetts:
7.6% (92,959)
Bulgaria
Greenfield:
2.7% (26)
Massachusetts:
0.3% (3,184)
Russia
Greenfield:
2.5% (24)
Massachusetts:
1.5% (18,278)
El Salvador
Greenfield:
2.3% (22)
Massachusetts:
3.7% (45,667)
England
Greenfield:
1.9% (18)
Massachusetts:
0.9% (10,698)
Colombia
Greenfield:
1.9% (18)
Massachusetts:
2.3% (27,810)
Philippines
Greenfield:
1.8% (17)
Massachusetts:
0.9% (10,810)
Place of birth for U.S.-born residents:
This state: 11,546
Other state: 4,723
Northeast: 2,608
Midwest: 818
South: 599
West: 751
87.0% of Greenfield residents lived in the same house 1 years ago. Out of people who lived in different houses, 32.9% lived in this county. Out of people who lived in different counties, 79.5% lived in Massachusetts.
Greenfield:
87.0%
State average:
87.7%
Education attainment for males 25 years and older:
No schooling: 140
Nursery to 4th grade: 0
5th and 6th grade: 37
7th and 8th grade: 82
9th grade: 53
10th grade: 74
11th grade: 98
12th grade, no diploma: 139
High school graduate (or equivalency): 1,691
Less than 1 year of college: 381
Some college more than 1 year, no degree: 723
Associate degree: 506
Bachelor's degree: 1,352
Master's degree: 543
Professional school degree: 136
Doctorate degree: 198
Education attainment for females 25 years and older:
No schooling: 82
Nursery to 4th grade: 29
5th and 6th grade: 17
7th and 8th grade: 89
9th grade: 29
10th grade: 74
11th grade: 160
12th grade, no diploma: 23
High school graduate (or equivalency): 1,912
Less than 1 year of college: 348
Some college more than 1 year, no degree: 634
Associate degree: 952
Bachelor's degree: 1,289
Master's degree: 918
Professional school degree: 262
Doctorate degree: 296
Housing units in structures:
One, detached: 4,286
One, attached: 504
Two: 1,302
3 or 4: 1,090
5 to 9: 600
10 to 19: 240
20 to 49: 114
50 or more: 432
Mobile homes: 31
Median worth of mobile homes: $38,448
Housing units lacking complete plumbing facilities in 2022: 0.1%
Housing units lacking complete kitchen facilities in 2022: 0.5%
House/condo owner moved in on average 14 years ago