Gresham, OR (Oregon) Houses and Residents
Estimated median house or condo value in 2022: $446,000 (it was $155,800 in 2000 )
Gresham:
$446,000Oregon:
$475,600
Lower value quartile - upper value quartile: $353,300 - $561,900Mean price in 2022: Detached houses: $451,436 Here:
$451,436State:
$562,872
Townhouses or other attached units: $307,933 Here:
$307,933State:
$463,029
In 2-unit structures: $235,684 Here:
$235,684State:
$505,105
In 3-to-4-unit structures: $310,903 Here:
$310,903State:
$419,673
In 5-or-more-unit structures: $268,342 Here:
$268,342State:
$420,389
Mobile homes: $63,102 Here:
$63,102State:
$214,044
Occupied boats, RVs, vans, etc.: $650,518 Here:
$650,518State:
$122,960
Total population: 109,892 (Urban population: 89,927, Rural population: 231 (77 farm, 154 nonfarm ))
Houses: 48,063 (44,816 occupied: 24,580 owner occupied, 20,236 renter occupied )
% of renters here:
45%State:
37%
Housing density: 2,169 houses/condos per square mile
Median price asked for vacant for-sale houses and condos in 2022: $402,102.
Median contract rent in 2022: $1,271 (lower quartile is $1,045, upper quartile is $1,489)
Median rent asked for vacant for-rent units in 2022: $2,692
Median gross rent in Gresham, OR in 2022: $1,386
Housing units in Gresham with a mortgage: 17,651 (1,215 second mortgage, 162 home equity loan, 808 both second mortgage and home equity loan )Houses without a mortgage: 468
Median household income for houses/condos with a mortgage: $108,201
Median household income for apartments without a mortgage: $73,863
Median monthly housing costs: $1,465
Data:
Median house or condo value ($)
Median house or condo value ($ change since 2000)
Median house or condo value ($) - White
Median house or condo value ($) - Black or African American
Median house or condo value ($) - Asian
Median house or condo value ($) - Hispanic or Latino
Median house or condo value ($) - American Indian and Alaska Native
Median house or condo value ($) - Multirace
Median house or condo value ($) - Other Race
Median price asked for mobile homes ($)
Household density (households per square mile)
Mean house or condo value by units in structure - 1, detached ($)
Mean house or condo value by units in structure - 1, attached ($)
Mean house or condo value by units in structure - 2 ($)
Mean house or condo value by units in structure by units in structure - 3 or 4 ($)
Mean house or condo value by units in structure - 5 or more ($)
Mean house or condo value by units in structure - Boat, RV, van, etc. ($)
Mean house or condo value by units in structure - Mobile home ($)
Median contract rent ($)
Median contract rent - Lower quartile ($)
Median contract rent - Upper quartile ($)
Median gross rent ($)
Urban houses (%)
Rural houses (%)
Houses occupied (%)
Houses occupied (% change since 2000)
Houses owner occupied (%)
Houses owner occupied (% change since 2000)
Houses renter occupied (%)
Houses renter occupied (% change since 2000)
Vacant housing units - For rent (%)
Vacant housing units - For rent (% change since 2000)
Vacant housing units - For sale only (%)
Vacant housing units - For sale only (% change since 2000)
Vacant housing units - Rented or sold, not occupied (%)
Vacant housing units - Rented or sold, not occupied (% change since 2000)
Vacant housing units - For seasonal, recreational, or occasional use (%)
Vacant housing units - For seasonal, recreational, or occasional use (% change since 2000)
Vacant housing units - For migrant workers (%)
Vacant housing units - For migrant workers (% change since 2000)
Vacant housing units - Other vacant (%)
Vacant housing units - Other vacant (% change since 2000)
Median monthly housing costs ($)
Median household income for houses/condos with a mortgage ($)
Median household income for houses/condos without a mortgage ($)
Median household income ($)
Median household income ($) - White
Median household income ($) - Black or African American
Median household income ($) - Asian
Median household income ($) - Hispanic or Latino
Median household income ($) - American Indian and Alaska Native
Median household income ($) - Multirace
Median household income ($) - Other Race
Mortgage status - with mortgage (%)
Mortgage status - with second mortgage (%)
Mortgage status - with home equity loan (%)
Mortgage status - with both second mortgage and home equity loan (%)
Mortgage status - without a mortgage (%)
Median year house/condo built
Median year apartment built
Household type by relationship - Male householder living alone (%)
Household type by relationship - Male householder not living alone (%)
Household type by relationship - Female householder living alone (%)
Household type by relationship - Female householder not living alone (%)
Household type by relationship - Opposite-Sex spouse (%)
Household type by relationship - Same-Sex spouse (%)
Household type by relationship - Opposite-Sex unmarried partner (%)
Household type by relationship - Same-Sex unmarried partner (%)
Household type by relationship - In group quarters (%)
Size of family households - 2-person household (%)
Size of family households - 3-person household (%)
Size of family households - 4-person household (%)
Size of family households - 5-person household (%)
Size of family households - 6-person household (%)
Size of family households - 7-or-more-person household (%)
Size of nonfamily households - 1-person household (%)
Size of nonfamily households - 2-person household (%)
Size of nonfamily households - 3-person household (%)
Size of nonfamily households - 4-person household (%)
Size of nonfamily households - 5-person household (%)
Size of nonfamily households - 6-person household (%)
Size of nonfamily households - 7-or-moreperson household (%)
Year house built - Built 2010 or later (%)
Year house built - Built 2000 to 2009 (%)
Year house built - Built 1990 to 1999 (%)
Year house built - Built 1980 to 1989 (%)
Year house built - Built 1970 to 1979 (%)
Year house built - Built 1960 to 1969 (%)
Year house built - Built 1950 to 1959 (%)
Year house built - Built 1940 to 1949 (%)
Year house built - Built 1939 or earlier (%)
Median number of rooms in houses and condos
Median number of rooms in apartments
Median number of bedrooms in owner occupied houses
Mean number of bedrooms in owner occupied houses
Median number of bedrooms in renter occupied houses
Mean number of bedrooms in renter occupied houses
Median number of vehichles in owner occupied houses
Mean number of vehichles in owner occupied houses
Median number of vehichles in renter occupied houses
Mean number of vehichles in renter occupied houses
Rooms in owner-occupied houses - 1 room (%)
Rooms in owner-occupied houses - 2 rooms (%)
Rooms in owner-occupied houses - 3 rooms (%)
Rooms in owner-occupied houses - 4 rooms (%)
Rooms in owner-occupied houses - 5 rooms (%)
Rooms in owner-occupied houses - 6 rooms (%)
Rooms in owner-occupied houses - 7 rooms (%)
Rooms in owner-occupied houses - 8 rooms (%)
Rooms in owner-occupied houses - 9+ rooms (%)
Rooms in renter-occupied houses - 1 room (%)
Rooms in renter-occupied houses - 2 rooms (%)
Rooms in renter-occupied houses - 3 rooms (%)
Rooms in renter-occupied houses - 4 rooms (%)
Rooms in renter-occupied houses - 5 rooms (%)
Rooms in renter-occupied houses - 6 rooms (%)
Rooms in renter-occupied houses - 7 rooms (%)
Rooms in renter-occupied houses - 8 rooms (%)
Rooms in renter-occupied houses - 9+ rooms (%)
Bedrooms in owner-occupied houses - no bedrooms (%)
Bedrooms in owner-occupied houses - 1 bedroom (%)
Bedrooms in owner-occupied houses - 2 bedrooms (%)
Bedrooms in owner-occupied houses - 3 bedrooms (%)
Bedrooms in owner-occupied houses - 4 bedrooms (%)
Bedrooms in owner-occupied houses - 5+ bedrooms (%)
Bedrooms in renter-occupied houses - no bedrooms (%)
Bedrooms in renter-occupied houses - 1 bedroom (%)
Bedrooms in renter-occupied houses - 2 bedrooms (%)
Bedrooms in renter-occupied houses - 3 bedrooms (%)
Bedrooms in renter-occupied houses - 4 bedrooms (%)
Bedrooms in renter-occupied houses - 5+ bedrooms (%)
Vehicles available in owner-occupied houses - no vehicle available (%)
Vehicles available in owner-occupied houses - 1 vehicle available(%)
Vehicles available in owner-occupied houses - 2 Vehicles available (%)
Vehicles available in owner-occupied houses - 3 Vehicles available (%)
Vehicles available in owner-occupied houses - 4 Vehicles available (%)
Vehicles available in owner-occupied houses - 5+ Vehicles available (%)
Vehicles available in renter-occupied houses - no vehicle available (%)
Vehicles available in renter-occupied houses - 1 vehicle available (%)
Vehicles available in renter-occupied houses - 2 Vehicles available (%)
Vehicles available in renter-occupied houses - 3 Vehicles available (%)
Vehicles available in renter-occupied houses - 4 Vehicles available (%)
Vehicles available in renter-occupied houses - 5+ Vehicles available (%)
Housing units in structures - 1, detached (%)
Housing units in structures - 1, attached (%)
Housing units in structures - 2 (%)
Housing units in structures - 3 or 4 (%)
Housing units in structures - 5 to 9 (%)
Housing units in structures - 10 to 19 (%)
Housing units in structures - 20 to 49 (%)
Housing units in structures - 50 or more (%)
Housing units in structures - Mobile home (%)
Housing units in structures - Boat, RV, van, etc. (%)
Housing units in structures - Owners - 1, detached (%)
Housing units in structures - Owners - 1, attached (%)
Housing units in structures - Owners - 2 (%)
Housing units in structures - Owners - 3 or 4 (%)
Housing units in structures - Owners - 5 to 9 (%)
Housing units in structures - Owners - 10 to 19 (%)
Housing units in structures - Owners - 20 to 49 (%)
Housing units in structures - Owners - 50 or more (%)
Housing units in structures - Owners - Mobile home (%)
Housing units in structures - Owners - Boat, RV, van, etc. (%)
Housing units in structures - Renters - 1, detached (%)
Housing units in structures - Renters - 1, attached (%)
Housing units in structures - Renters - 2 (%)
Housing units in structures - Renters - 3 or 4 (%)
Housing units in structures - Renters - 5 to 9 (%)
Housing units in structures - Renters - 10 to 19 (%)
Housing units in structures - Renters - 20 to 49 (%)
Housing units in structures - Renters - 50 or more (%)
Housing units in structures - Renters - Mobile home (%)
Housing units in structures - Renters - Boat, RV, van, etc. (%)
House/condo owner moved in on average (years ago)
Renter moved in on average (years ago)
Year householder moved into unit - Moved in 1999 to March 2000 (%)
Year householder moved into unit - Moved in 1999 to March 2000 (%) - White
Year householder moved into unit - Moved in 1999 to March 2000 (%) - Black or African American
Year householder moved into unit - Moved in 1999 to March 2000 (%) - Asian
Year householder moved into unit - Moved in 1999 to March 2000 (%) - Hispanic or Latino
Year householder moved into unit - Moved in 1999 to March 2000 (%) - American Indian and Alaska Native
Year householder moved into unit - Moved in 1999 to March 2000 (%) - Multirace
Year householder moved into unit - Moved in 1999 to March 2000 (%) - Other Race
Year householder moved into unit - Moved in 1995 to 1998 (%)
Year householder moved into unit - Moved in 1995 to 1998 (%) - White
Year householder moved into unit - Moved in 1995 to 1998 (%) - Black or African American
Year householder moved into unit - Moved in 1995 to 1998 (%) - Asian
Year householder moved into unit - Moved in 1995 to 1998 (%) - Hispanic or Latino
Year householder moved into unit - Moved in 1995 to 1998 (%) - American Indian and Alaska Native
Year householder moved into unit - Moved in 1995 to 1998 (%) - Multirace
Year householder moved into unit - Moved in 1995 to 1998 (%) - Other Race
Year householder moved into unit - Moved in 1990 to 1994 (%)
Year householder moved into unit - Moved in 1990 to 1994 (%) - White
Year householder moved into unit - Moved in 1990 to 1994 (%) - Black or African American
Year householder moved into unit - Moved in 1990 to 1994 (%) - Asian
Year householder moved into unit - Moved in 1990 to 1994 (%) - Hispanic or Latino
Year householder moved into unit - Moved in 1990 to 1994 (%) - American Indian and Alaska Native
Year householder moved into unit - Moved in 1990 to 1994 (%) - Multirace
Year householder moved into unit - Moved in 1990 to 1994 (%) - Other Race
Year householder moved into unit - Moved in 1980 to 1989 (%)
Year householder moved into unit - Moved in 1980 to 1989 (%) - White
Year householder moved into unit - Moved in 1980 to 1989 (%) - Black or African American
Year householder moved into unit - Moved in 1980 to 1989 (%) - Asian
Year householder moved into unit - Moved in 1980 to 1989 (%) - Hispanic or Latino
Year householder moved into unit - Moved in 1980 to 1989 (%) - American Indian and Alaska Native
Year householder moved into unit - Moved in 1980 to 1989 (%) - Multirace
Year householder moved into unit - Moved in 1980 to 1989 (%) - Other Race
Year householder moved into unit - Moved in 1970 to 1979 (%)
Year householder moved into unit - Moved in 1970 to 1979 (%) - White
Year householder moved into unit - Moved in 1970 to 1979 (%) - Black or African American
Year householder moved into unit - Moved in 1970 to 1979 (%) - Asian
Year householder moved into unit - Moved in 1970 to 1979 (%) - Hispanic or Latino
Year householder moved into unit - Moved in 1970 to 1979 (%) - American Indian and Alaska Native
Year householder moved into unit - Moved in 1970 to 1979 (%) - Multirace
Year householder moved into unit - Moved in 1970 to 1979 (%) - Other Race
Year householder moved into unit - Moved in 1969 or earlier (%)
Year householder moved into unit - Moved in 1969 or earlier (%) - White
Year householder moved into unit - Moved in 1969 or earlier (%) - Black or African American
Year householder moved into unit - Moved in 1969 or earlier (%) - Asian
Year householder moved into unit - Moved in 1969 or earlier (%) - Hispanic or Latino
Year householder moved into unit - Moved in 1969 or earlier (%) - American Indian and Alaska Native
Year householder moved into unit - Moved in 1969 or earlier (%) - Multirace
Year householder moved into unit - Moved in 1969 or earlier (%) - Other Race
Housing units lacking complete plumbing facilities (%)
Housing units lacking complete kitchen facilities (%)
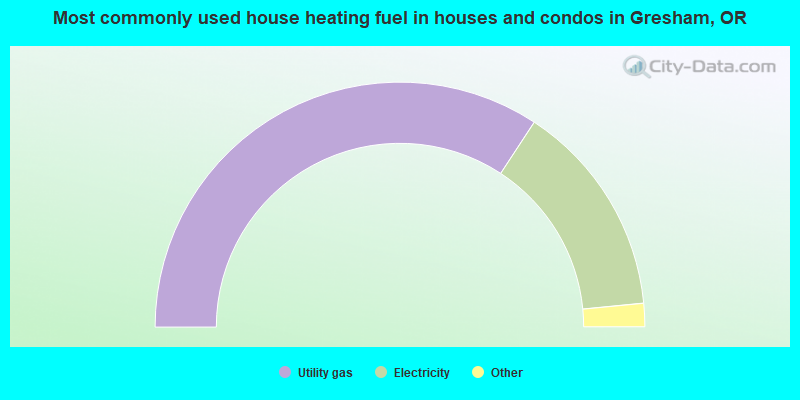
House heating fuel used in houses and condos - Utility gas (%)
House heating fuel used in houses and condos - Bottled, tank, or LP gas (%)
House heating fuel used in houses and condos - Electricity (%)
House heating fuel used in houses and condos - Fuel oil, kerosene, etc. (%)
House heating fuel used in houses and condos - Coal or coke (%)
House heating fuel used in houses and condos - Wood (%)
House heating fuel used in houses and condos - Solar energy (%)
House heating fuel used in houses and condos - Other fuel (%)
House heating fuel used in houses and condos - No fuel used (%)
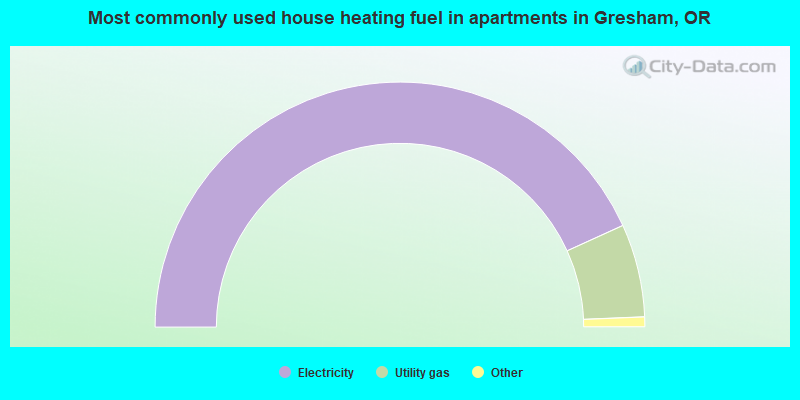
House heating fuel used in apartments - Utility gas (%)
House heating fuel used in apartments - Bottled, tank, or LP gas (%)
House heating fuel used in apartments - Electricity (%)
House heating fuel used in apartments - Fuel oil, kerosene, etc. (%)
House heating fuel used in apartments - Coal or coke (%)
House heating fuel used in apartments - Wood (%)
House heating fuel used in apartments - Solar energy (%)
House heating fuel used in apartments - Other fuel (%)
House heating fuel used in apartments - No fuel used (%)
Latest news about housing in Gresham, OR collected exclusively by city-data.com from local newspapers, TV, and radio stations
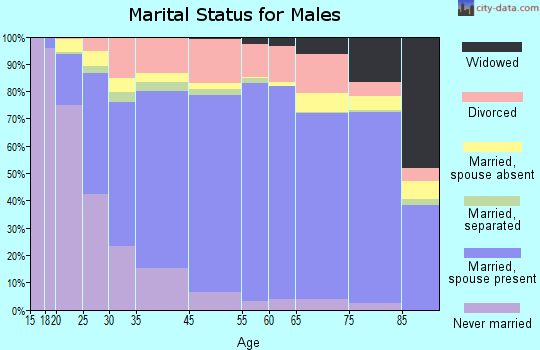
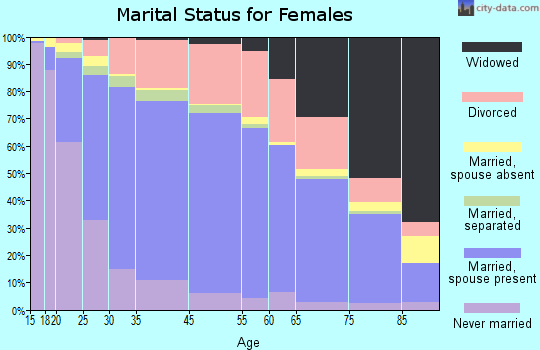
Median year house/condo built: 1980Median year apartment built: 1981Household type by relationship:
Households: 111,634
Male householders: 19,575 (5,828 living alone ), Female householders: 25,241 (7,786 living alone )18,557 spouses (17,843 opposite-sex spouses ), 3,172 unmarried partners , (2,999 opposite-sex unmarried partners ), 31,257 children (28,533 natural , 477 adopted , 2,247 stepchildren ), 1,749 grandchildren , 1,487 brothers or sisters , 2,191 parents , 208 foster children , 2,352 other relatives , 3,860 non-relatives In group quarters: 1,985
Size of family households: 11,990 2-persons , 6,383 3-persons , 5,413 4-persons , 1,383 5-persons , 2,011 6-persons , 259 7-or-more-persons .
Size of nonfamily households: 13,614 1-person , 2,895 2-persons , 763 3-persons , 53 4-persons , 52 6-persons .
13,507 married couples with children. single-parent households (1,212 men , 5,406 women ).
74.5% of residents of Gresham speak English at home. of residents speak Spanish at home (55% speak English very well , 22% speak English well , 13% speak English not well , 9% don't speak English at all ).of residents speak other Indo-European language at home (51% speak English very well , 20% speak English well , 25% speak English not well , 3% don't speak English at all ).of residents speak Asian or Pacific Island language at home (48% speak English very well , 28% speak English well , 22% speak English not well , 2% don't speak English at all ).of residents speak other language at home (48% speak English very well , 43% speak English well , 5% speak English not well , 3% don't speak English at all ).
Foreign born population: 18,687 (16.7%)of them are naturalized citizens )
Median number of rooms in houses and condos:
Median number of rooms in apartments
Owner-occupied Renter-occupied
Rooms in owner-occupied houses in Gresham, Oregon
126 1 room 107 2 rooms 488 3 rooms 2,622 4 rooms 3,329 5 rooms 6,557 6 rooms 4,248 7 rooms 3,788 8 rooms 3,315 9+ rooms
Rooms in renter-occupied apartments in Gresham, Oregon
1,338 1 room 2,142 2 rooms 4,860 3 rooms 5,291 4 rooms 3,584 5 rooms 2,007 6 rooms 568 7 rooms 233 8 rooms 213 9+ rooms
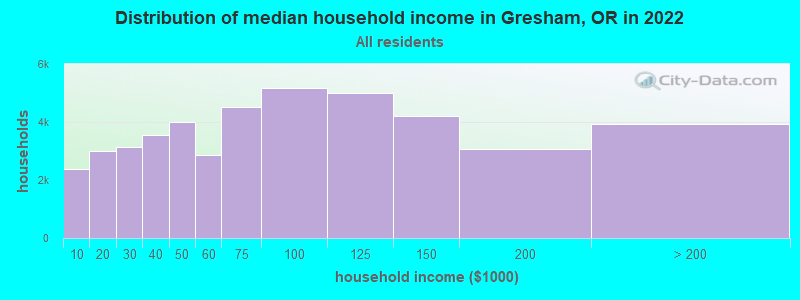
Gresham, OR household income distribution 2,375 Less than $10,0003,007 $10,000 to $19,9993,155 $20,000 to $29,9993,541 $30,000 to $39,9993,988 $40,000 to $49,9992,879 $50,000 to $59,9994,524 $60,000 to $74,9995,159 $75,000 to $99,9995,010 $100,000 to $124,9994,193 $125,000 to $149,9993,062 $150,000 to $199,9993,923 $200,000 or more
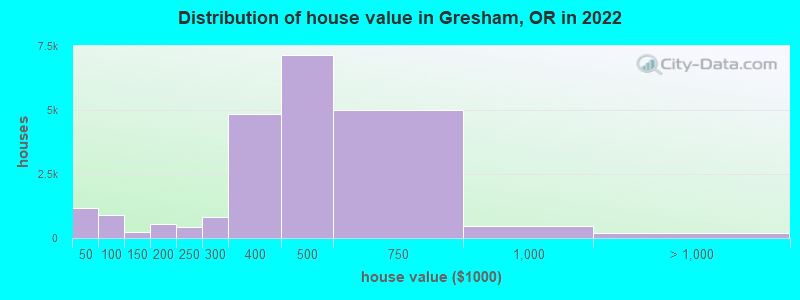
Home value of owner - occupied houses in 2022 in Gresham, OR 191 Less than $10,00053 $10,000 to $14,99965 $15,000 to $19,99961 $20,000 to $24,99967 $25,000 to $29,99991 $30,000 to $34,999100 $35,000 to $39,999541 $40,000 to $49,99984 $50,000 to $59,999163 $60,000 to $69,99927 $70,000 to $79,99935 $80,000 to $89,99927 $90,000 to $99,99978 $100,000 to $124,999146 $125,000 to $149,999357 $150,000 to $174,999193 $175,000 to $199,999448 $200,000 to $249,999803 $250,000 to $299,9994,829 $300,000 to $399,9997,135 $400,000 to $499,9994,981 $500,000 to $749,999463 $750,000 to $999,999144 $1,000,000 to $1,499,99948 $2,000,000 or moreRent paid by renters in 2022 in Gresham, OR 38 Less than $100169 $100 to $149264 $150 to $19939 $200 to $24997 $250 to $299210 $300 to $349334 $350 to $39938 $400 to $449112 $500 to $54966 $550 to $599123 $600 to $649115 $650 to $69980 $700 to $749334 $750 to $799681 $800 to $8991,105 $900 to $9995,505 $1,000 to $1,2495,994 $1,250 to $1,4993,590 $1,500 to $1,999632 $2,000 to $2,499201 $2,500 to $2,999117 $3,000 to $3,499119 $3,500 or more514 No cash rent
Percentage of workers working in this county: 81.6%Number of people working at home: 7,044 (13.0% of all workers )
Travel time to work (commute)
Less than 5 minutes: 1,3775 to 9 minutes: 5,38610 to 14 minutes: 6,98915 to 19 minutes: 9,38020 to 24 minutes: 6,27325 to 29 minutes: 3,65730 to 34 minutes: 9,04035 to 39 minutes: 1,66140 to 44 minutes: 1,66145 to 59 minutes: 3,01260 to 89 minutes: 2,07290 or more minutes: 1,534
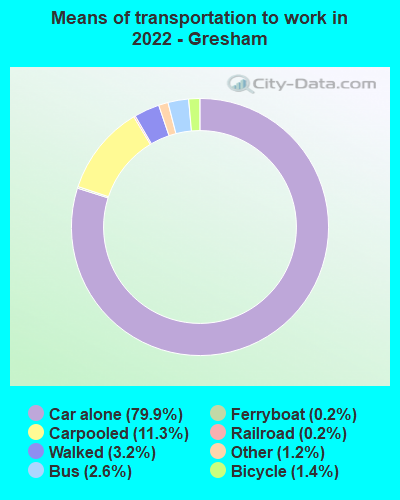
Means of transportation to work:
Drove a car alone: 24,925 (66.4%)Carpooled: 3,193 (8.5%)Bus : 601 (1.6%)Subway or elevated rail : 18 (0.0%)Light rail, streetcar or trolley : 42 (0.1%)Ferryboat: 57 (0.2%)Taxi: 433 (1.2%)Bicycle: 359 (1.0%)Walked: 1,116 (3.0%)Worked at home: 7,044 (18.8%)
Unemployment by race in 2022
Unemployment rate for White non-Hispanic residents 2.5% Males4.2% FemalesUnemployment rate for Black residents 14.6% Males3.6% FemalesUnemployment rate for American Indian and Alaska Native residents 26.0% FemalesUnemployment rate for Asian residents 4.1% Males0.9% FemalesUnemployment rate for other race residents 6.7% Males2.0% FemalesUnemployment rate for two or more race residents 2.1% Males4.4% FemalesUnemployment rate for Hispanic or Latino residents 2.0% Males3.7% Females
Year of entry for the foreign-born population in Gresham, Oregon
4,354 2010 or later 5,176 2000 to 2009 3,515 1990 to 1999 2,640 1980 to 1989 876 1970 to 1979 1,156 Before 1970
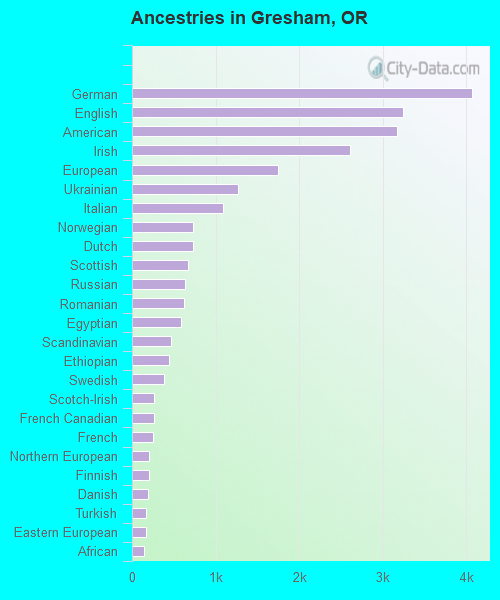
First ancestries reported:
German: 4,069 (6.7%)
English: 3,244 (5.3%)
American: 3,173 (5.2%)
Irish: 2,609 (4.3%)
European: 1,753 (2.9%)
Ukrainian: 1,266 (2.1%)
Italian: 1,087 (1.8%)
Norwegian: 727 (1.2%)
Dutch: 727 (1.2%)
Scottish: 674 (1.1%)
Russian: 629 (1.0%)
Romanian: 626 (1.0%)
Egyptian: 591 (1.0%)
Scandinavian: 469 (0.8%)
Ethiopian: 443 (0.7%)
Swedish: 381 (0.6%)
Scotch-Irish: 266 (0.4%)
French Canadian: 259 (0.4%)
French: 252 (0.4%)
Northern European: 205 (0.3%)
Finnish: 198 (0.3%)
Danish: 192 (0.3%)
Turkish: 166 (0.3%)
Eastern European: 162 (0.3%)
African: 142 (0.2%)
Welsh: 138 (0.2%)
Hungarian: 122 (0.2%)
Celtic: 118 (0.2%)
Slavic: 116 (0.2%)
British: 96 (0.2%)
Polish: 89 (0.1%)
Portuguese: 69 (0.1%)
Somali: 60 (0.10%)
Moroccan: 52 (0.09%)
Czech: 51 (0.08%)
Kenyan: 46 (0.08%)
Greek: 45 (0.07%)
Estonian: 44 (0.07%)
Belgian: 44 (0.07%)
Jamaican: 44 (0.07%)
Yugoslavian: 41 (0.07%)
Czechoslovakian: 40 (0.07%)
South African: 37 (0.06%)
Arab: 35 (0.06%)
Trinidadian and Tobagonian: 35 (0.06%)
Lebanese: 32 (0.05%)
Icelander: 27 (0.04%)
Swiss: 27 (0.04%)
Canadian: 23 (0.04%)
Cape Verdean: 21 (0.03%)
Ghanaian: 18 (0.03%)
Bulgarian: 18 (0.03%)
West Indian: 15 (0.02%)
Australian: 14 (0.02%)
Latvian: 13 (0.02%)
Afghan: 7 (0.01%)
Brazilian: 7 (0.01%)
Luxembourger: 4 (0.01%)
Most common places of birth for foreign-born residents (%): Mexico Gresham:
39.9% (7,691)Oregon:
33.9% (140,109)
Ukraine Gresham:
7.5% (1,453)Oregon:
2.1% (8,469)
Vietnam Gresham:
6.2% (1,201)Oregon:
5.5% (22,563)
Philippines Gresham:
5.6% (1,072)Oregon:
3.5% (14,530)
Cuba Gresham:
2.2% (429)Oregon:
0.5% (2,247)
Laos Gresham:
1.9% (369)Oregon:
0.8% (3,218)
China, excluding Hong Kong and Taiwan Gresham:
1.9% (364)Oregon:
5.2% (21,429)
Guatemala Gresham:
1.8% (344)Oregon:
1.7% (7,103)
Ethiopia Gresham:
1.8% (343)Oregon:
0.9% (3,555)
Egypt Gresham:
1.6% (312)Oregon:
0.3% (1,195)
El Salvador Gresham:
1.5% (297)Oregon:
1.0% (4,175)
Place of birth for U.S.-born residents:
This state: 54,645Other state: 35,732Northeast: 2,177Midwest: 7,164South: 4,560West: 21,831 83.6% of Gresham residents lived in the same house 1 years ago.
Out of people who lived in different houses, 41.8% lived in this county.
Out of people who lived in different counties, 63.1% lived in Oregon.
Gresham:
83.6%State average:
85.5%
Education attainment for males 25 years and older:
No schooling: 838Nursery to 4th grade: 3125th and 6th grade: 6897th and 8th grade: 3119th grade: 62510th grade: 1,05311th grade: 33912th grade, no diploma: 769High school graduate (or equivalency): 11,399Less than 1 year of college: 3,381Some college more than 1 year, no degree: 8,216Associate degree: 2,050Bachelor's degree: 6,448Master's degree: 2,245Professional school degree: 444Doctorate degree: 133
Education attainment for females 25 years and older:
No schooling: 642Nursery to 4th grade: 565th and 6th grade: 8127th and 8th grade: 1659th grade: 17310th grade: 79211th grade: 41912th grade, no diploma: 909High school graduate (or equivalency): 10,292Less than 1 year of college: 4,533Some college more than 1 year, no degree: 8,327Associate degree: 4,124Bachelor's degree: 6,024Master's degree: 2,993Professional school degree: 392Doctorate degree: 52
Housing units in structures:
One, detached: 25,712One, attached: 3,231Two: 1,3733 or 4: 2,9355 to 9: 2,94310 to 19: 3,46420 to 49: 2,58650 or more: 4,378Mobile homes: 1,389Boats, RVs, vans, etc.: 52Median worth of mobile homes: $45,200
Housing units lacking complete plumbing facilities in 2022: 0.4%Housing units lacking complete kitchen facilities in 2022: 1.6%House/condo owner moved in on average 11 years ago
Renter moved in on average 2 years ago
Private vs. public school enrollment:
Students in private schools in grades 1 to 8 (elementary and middle school): 737 Students in private schools in grades 9 to 12 (high school): 472 Students in private undergraduate colleges: 1,417