Housing density: 1,527 houses/condos per square mile
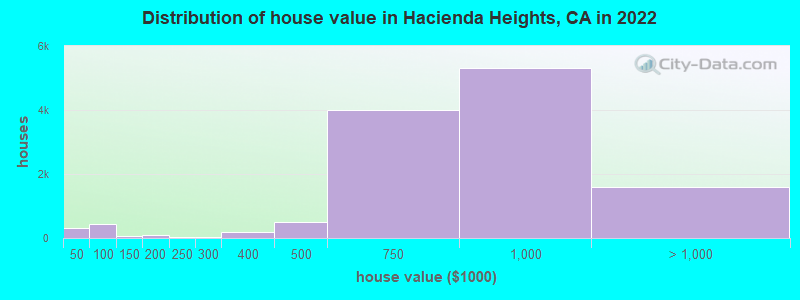
Median price asked for vacant for-sale houses and condos in 2022: $778,979.
Median contract rent in 2022: $1,949 (lower quartile is $1,523, upper quartile is over $2,000)
Median rent asked for vacant for-rent units in 2022: $2,613
Median gross rent in Hacienda Heights, CA in 2022: over $2,000
Housing units in Hacienda Heights with a mortgage: 7,231 (630 second mortgage, 4 home equity loan, 465 both second mortgage and home equity loan) Houses without a mortgage: 177
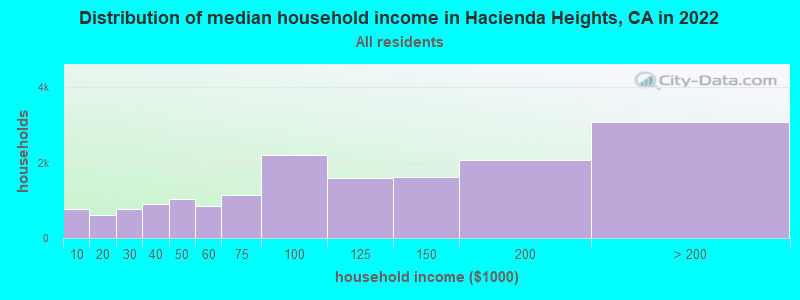
Median household income for houses/condos with a mortgage: $133,139
Median household income for apartments without a mortgage: $88,284
Median monthly housing costs: $1,896
Compare current foreclosures near Hacienda Heights, CA:
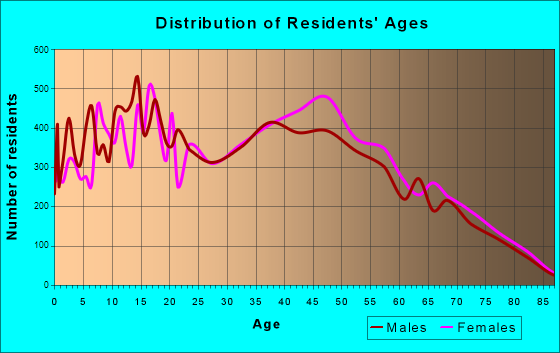
6,095 married couples with children.
1,493 single-parent households (334 men, 1,159 women).
36.5% of residents of Hacienda Heights speak English at home.
28.5% of residents speak Spanish at home (71% speak English very well, 16% speak English well, 9% speak English not well, 3% don't speak English at all).
2.0% of residents speak other Indo-European language at home (72% speak English very well, 20% speak English well, 4% speak English not well, 4% don't speak English at all).
32.8% of residents speak Asian or Pacific Island language at home (35% speak English very well, 32% speak English well, 26% speak English not well, 8% don't speak English at all).
0.4% of residents speak other language at home (86% speak English very well, 3% speak English well, 11% speak English not well).
Foreign born population: 21,876 (40.3%)
(73.2% of them are naturalized citizens)
Percentage of workers working in this county: 85.9% Number of people working at home: 3,767 (14.8% of all workers)
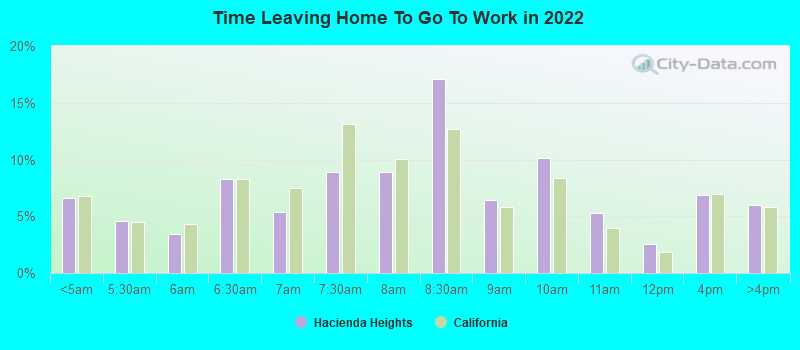
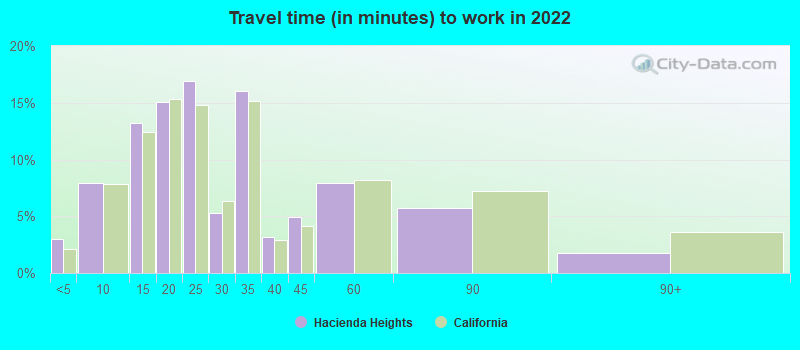
Travel time to work (commute)
Less than 5 minutes: 274
5 to 9 minutes: 931
10 to 14 minutes: 2,306
15 to 19 minutes: 2,067
20 to 24 minutes: 2,747
25 to 29 minutes: 1,413
30 to 34 minutes: 3,811
35 to 39 minutes: 899
40 to 44 minutes: 1,184
45 to 59 minutes: 2,623
60 to 89 minutes: 2,344
90 or more minutes: 892
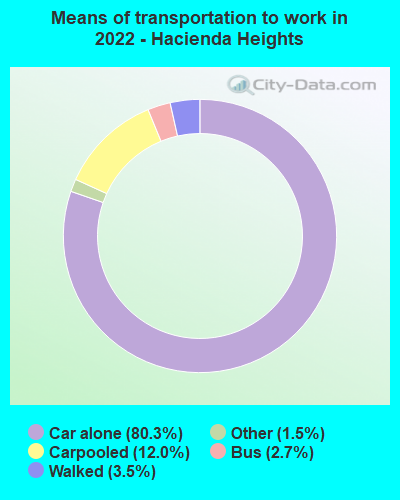
Means of transportation to work:
Drove a car alone: 4,780 (52.0%)
Carpooled: 792 (8.6%)
Bus: 145 (1.6%)
Taxi: 94 (1.0%)
Walked: 227 (2.5%)
Worked at home: 3,767 (41.0%)
Unemployment by race in 2022
Unemployment rate for White non-Hispanic residents
4.8%Males
1.8%Females
Unemployment rate for American Indian and Alaska Native residents
11.9%Males
11.8%Females
Unemployment rate for Asian residents
3.8%Males
3.3%Females
Unemployment rate for other race residents
3.7%Males
6.5%Females
Unemployment rate for two or more race residents
5.3%Males
3.7%Females
Unemployment rate for Hispanic or Latino residents
4.7%Males
6.6%Females
Year of entry for the foreign-born population in Hacienda Heights, California
3,3552010 or later
3,4782000 to 2009
4,4021990 to 1999
7,1041980 to 1989
4,3741970 to 1979
3,113Before 1970
First ancestries reported:
American: 472 (1.3%)
English: 418 (1.1%)
German: 278 (0.7%)
Italian: 249 (0.7%)
Irish: 228 (0.6%)
Armenian: 140 (0.4%)
Eastern European: 129 (0.3%)
Scottish: 95 (0.3%)
French: 86 (0.2%)
Russian: 86 (0.2%)
Egyptian: 61 (0.2%)
Iranian: 42 (0.1%)
Belizean: 42 (0.1%)
Polish: 38 (0.1%)
European: 37 (0.10%)
African: 32 (0.09%)
Jamaican: 29 (0.08%)
Slavic: 22 (0.06%)
Australian: 21 (0.06%)
Brazilian: 19 (0.05%)
Welsh: 18 (0.05%)
Ukrainian: 17 (0.05%)
Swedish: 15 (0.04%)
Jordanian: 14 (0.04%)
Lithuanian: 14 (0.04%)
Dutch: 12 (0.03%)
Norwegian: 12 (0.03%)
British: 10 (0.03%)
Scotch-Irish: 10 (0.03%)
Assyrian: 8 (0.02%)
Greek: 8 (0.02%)
Maltese: 7 (0.02%)
Hungarian: 7 (0.02%)
Danish: 5 (0.01%)
Guyanese: 5 (0.01%)
Canadian: 4 (0.01%)
Northern European: 3 (0.01%)
Yugoslavian: 3 (0.01%)
Most common places of birth for foreign-born residents (%):
China, excluding Hong Kong and Taiwan
Hacienda Heights:
23.7% (5,176)
California:
6.6% (684,672)
Mexico
Hacienda Heights:
17.8% (3,886)
California:
37.2% (3,881,193)
Taiwan
Hacienda Heights:
16.5% (3,612)
California:
1.7% (176,274)
Philippines
Hacienda Heights:
6.4% (1,405)
California:
7.8% (818,297)
Vietnam
Hacienda Heights:
5.6% (1,219)
California:
4.9% (512,335)
Korea
Hacienda Heights:
5.0% (1,092)
California:
3.0% (315,248)
Hong Kong
Hacienda Heights:
4.0% (875)
California:
1.0% (105,215)
El Salvador
Hacienda Heights:
2.1% (452)
California:
4.2% (440,287)
Cambodia
Hacienda Heights:
1.6% (347)
California:
0.5% (51,974)
Guatemala
Hacienda Heights:
1.5% (335)
California:
2.8% (290,436)
Place of birth for U.S.-born residents:
This state: 28,407
Other state: 3,159
Northeast: 695
Midwest: 1,062
South: 727
West: 643
93.7% of Hacienda Heights residents lived in the same house 1 years ago. Out of people who lived in different houses, 38.7% lived in this county. Out of people who lived in different counties, 81.1% lived in California.
Hacienda Heights:
93.7%
State average:
88.9%
Education attainment for males 25 years and older:
No schooling: 762
Nursery to 4th grade: 141
5th and 6th grade: 285
7th and 8th grade: 150
9th grade: 212
10th grade: 270
11th grade: 233
12th grade, no diploma: 547
High school graduate (or equivalency): 4,467
Less than 1 year of college: 1,028
Some college more than 1 year, no degree: 2,857
Associate degree: 1,365
Bachelor's degree: 4,966
Master's degree: 1,547
Professional school degree: 319
Doctorate degree: 302
Education attainment for females 25 years and older:
No schooling: 836
Nursery to 4th grade: 164
5th and 6th grade: 435
7th and 8th grade: 228
9th grade: 197
10th grade: 84
11th grade: 244
12th grade, no diploma: 652
High school graduate (or equivalency): 4,795
Less than 1 year of college: 1,094
Some college more than 1 year, no degree: 2,459
Associate degree: 2,169
Bachelor's degree: 4,890
Master's degree: 1,787
Professional school degree: 398
Doctorate degree: 303
Housing units in structures:
One, detached: 13,814
One, attached: 1,125
Two: 78
3 or 4: 432
5 to 9: 347
10 to 19: 25
20 to 49: 184
50 or more: 899
Mobile homes: 451
Boats, RVs, vans, etc.: 13
Median worth of mobile homes: $116,024
Housing units lacking complete plumbing facilities in 2022: 0.2%
Housing units lacking complete kitchen facilities in 2022: 1.9%
House/condo owner moved in on average 19 years ago