Hainesville, IL (Illinois) Houses and Residents
| Hainesville: | $201,048 |
| Illinois: | $251,600 |
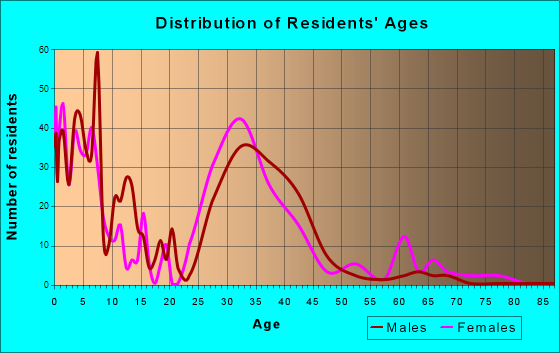
Total population: 3,682 (Urban population: 2,226, Rural population: 33 (all nonfarm))
Houses: 1,263 (1,263 occupied: 1,108 owner occupied, 179 renter occupied)
| % of renters here: | 14% |
| State: | 33% |
Housing density: 724 houses/condos per square mile
Median price asked for vacant for-sale houses and condos in 2022 in this county: $314,142.
Median contract rent in 2022: $998 (lower quartile is $971, upper quartile is $1,614)
Median gross rent in Hainesville, IL in 2022: $1,269
Housing units in Hainesville with a mortgage: 762 (20 second mortgage, 0 home equity loan, 12 both second mortgage and home equity loan)
Houses without a mortgage: 12
Median household income for houses/condos with a mortgage: $116,173
Median household income for apartments without a mortgage: $138,216
Median monthly housing costs: $1,481
Compare current foreclosures near Hainesville, IL:
| Photo | Address | Area | Beds / Baths | Price | Details |
|---|---|---|---|---|---|

|
#1
N Wren Ave
Palatine, IL 60067
|
1,303 sq. feet
|
1 baths 3 beds |
$409,000
|
show details |

|
#2
Wisconsin Ave
Barrington, IL 60010
|
1,297 sq. feet
|
2 baths 3 beds |
$499,000
|
show details |

|
#3
W Washington St
Waukegan, IL 60085
|
2,512 sq. feet
|
4 baths 4 beds |
$108,200
|
show details |

|
#4
Carriage Way Dr
Arlington Heights, IL 60004
|
- sq. feet
|
2 baths 2 beds |
$192,400
|
show details |

|
#5
N Lake Vista Ter
Spring Grove, IL 60081
|
874 sq. feet
|
1 baths 2 beds |
$109,900
|
show details |

|
#6
N Lewis Ave
Waukegan, IL 60085
|
1,054 sq. feet
|
1 baths 3 beds |
$119,600
|
show details |

|
#7
359th Ave
Twin Lakes, WI 53181
|
1,053 sq. feet
|
1 baths 2 beds |
$212,000
|
show details |

|
#8
Bentley Pl
Buffalo Grove, IL 60089
|
1,592 sq. feet
|
2 baths 2 beds |
show details | |

|
#9
S Sheridan Rd
Mchenry, IL 60051
|
999 sq. feet
|
1 baths 2 beds |
show details | |

|
#10
W Kinley Blvd
Mchenry, IL 60050
|
1,068 sq. feet
|
3 baths 3 beds |
show details |
| Photo | Address | Area | Beds / Baths | Price | Details |
|---|---|---|---|---|---|

|
#11
Meadow Hill Ln
Round Lake, IL 60073
|
1,176 sq. feet
|
1 baths 3 beds |
show details | |

|
#12
S Hough St
Barrington, IL 60010
|
1,100 sq. feet
|
1 baths 2 beds |
show details | |

|
#13
Harbor Rd
Wonder Lake, IL 60097
|
2,100 sq. feet
|
2 baths 4 beds |
show details | |

|
#14
Cherokee Dr
Round Lake, IL 60073
|
1,136 sq. feet
|
2 baths 4 beds |
show details | |

|
#15
Salem Rd
Wonder Lake, IL 60097
|
1,212 sq. feet
|
1 baths 2 beds |
show details | |

|
#16
N Old Lake Ave
Antioch, IL 60002
|
2,904 sq. feet
|
2 baths 3 beds |
show details | |

|
#17
Wildwood Dr
Mchenry, IL 60051
|
1,340 sq. feet
|
3 baths 2 beds |
show details | |

|
#18
Willow Crest Dr
Zion, IL 60099
|
2,011 sq. feet
|
2 baths 4 beds |
show details | |

|
#19
Oak Leaf Cir
Lake Villa, IL 60046
|
2,344 sq. feet
|
2 baths 4 beds |
show details | |

|
#20
Longwood Dr
Buffalo Grove, IL 60089
|
1,083 sq. feet
|
1 baths 3 beds |
show details |
| Photo | Address | Area | Beds / Baths | Price | Details |
|---|---|---|---|---|---|

|
#21
Tall Oaks Dr
Antioch, IL 60002
|
2,160 sq. feet
|
2 baths 3 beds |
show details | |

|
#22
N Gilmer Rd
Mundelein, IL 60060
|
1,908 sq. feet
|
2 baths 4 beds |
show details | |

|
#23
Crossland Dr
Grayslake, IL 60030
|
1,562 sq. feet
|
1 baths 3 beds |
show details | |

|
#24
Heartland Park Ln
Antioch, IL 60002
|
2,950 sq. feet
|
3 baths 4 beds |
show details | |

|
#25
Hillside Ave
Antioch, IL 60002
|
2,448 sq. feet
|
3 baths 5 beds |
show details | |

|
#26
Enoch Ave
Zion, IL 60099
|
1,462 sq. feet
|
2 baths 3 beds |
show details | |

|
#27
Broadway Ave
North Chicago, IL 60064
|
1,482 sq. feet
|
2 baths 3 beds |
show details | |

|
#28
Otis Rd
Barrington, IL 60010
|
5,900 sq. feet
|
9 baths 7 beds |
show details | |

|
#29
N Park Ave
Lake Villa, IL 60046
|
1,184 sq. feet
|
1 baths 3 beds |
show details | |

|
#30
Sprucewood Ln
Lake Villa, IL 60046
|
1,291 sq. feet
|
1 baths 3 beds |
show details |
| Photo | Address | Area | Beds / Baths | Price | Details |
|---|---|---|---|---|---|

|
#31
N Hidden Trl
Spring Grove, IL 60081
|
2,463 sq. feet
|
2 baths 3 beds |
show details | |

|
#32
Lindy St
Ingleside, IL 60041
|
1,926 sq. feet
|
2 baths 3 beds |
show details | |

|
#33
Amber Ct
Lake Villa, IL 60046
|
2,988 sq. feet
|
2 baths 3 beds |
show details | |

|
#34
S Butrick St
Waukegan, IL 60085
|
2,043 sq. feet
|
2 baths 4 beds |
show details | |

|
#35
Eddy Ln
Lake Zurich, IL 60047
|
1,629 sq. feet
|
2 baths 4 beds |
show details | |

|
#36
N Buck Ct
Lake Villa, IL 60046
|
3,192 sq. feet
|
3 baths 5 beds |
show details | |

|
#37
Lippincott Rd
Fox Lake, IL 60020
|
1,247 sq. feet
|
1 baths 3 beds |
show details | |

|
#38
N Cherokee Ct
Grayslake, IL 60030
|
768 sq. feet
|
1 baths 2 beds |
show details | |

|
#39
Brookwood Trl
Mchenry, IL 60050
|
1,140 sq. feet
|
3 baths 3 beds |
show details | |

|
#40
Shagbark Ln
Lake Villa, IL 60046
|
1,296 sq. feet
|
2 baths 3 beds |
show details |
| Photo | Address | Area | Beds / Baths | Price | Details |
|---|---|---|---|---|---|

|
#41
W Meadowview Dr
Round Lake, IL 60073
|
2,756 sq. feet
|
2 baths 4 beds |
show details | |

|
#42
Sussex Dr
Mchenry, IL 60050
|
1,110 sq. feet
|
2 baths 2 beds |
show details | |

|
#43
S Fulton Ave
Waukegan, IL 60085
|
1,365 sq. feet
|
1 baths 4 beds |
show details | |

|
#44
N Greentree Rd
Grayslake, IL 60030
|
2,008 sq. feet
|
2 baths 4 beds |
show details | |

|
#45
Luke Ave
Zion, IL 60099
|
1,524 sq. feet
|
2 baths 3 beds |
show details | |

|
#46
Fieldbrook Dr
Wauconda, IL 60084
|
2,286 sq. feet
|
3 baths 3 beds |
show details | |

|
#47
Tilche Ln
Crystal Lake, IL 60014
|
1,449 sq. feet
|
4 baths 3 beds |
show details | |

|
#48
Chandler Dr
Mundelein, IL 60060
|
1,344 sq. feet
|
1 baths 3 beds |
show details | |

|
#49
W Engle Dr
Lake Villa, IL 60046
|
1,456 sq. feet
|
1 baths 3 beds |
show details | |

|
Check over 1 million property listings on Foreclosure.com!
|
browse all offers | |||

Latest news about housing in Hainesville, IL collected exclusively by city-data.com from local newspapers, TV, and radio stations

 | Southern Wisconsin or Lake County? (11 replies) |
| May be getting a job in Lincolnshire. Looking at areas North and West (6 replies) |
| LIndenhurst High School? (6 replies) |
| is volo a good community!!! (17 replies) |
| Help with possible move to Lake County! (23 replies) |
| Schools in Lake County (5 replies) |
Median year apartment built: 1995
Household type by relationship:
Households: 3,527- Male householders: 683 (147 living alone), Female householders: 567 (60 living alone)
738 spouses (738 opposite-sex spouses), 112 unmarried partners, (93 opposite-sex unmarried partners), 1,195 children (1,151 natural, 0 adopted, 43 stepchildren), 0 grandchildren, 15 brothers or sisters, 64 parents, 28 foster children, 33 other relatives, 86 non-relatives
Size of family households: 311 2-persons, 211 3-persons, 280 4-persons, 54 5-persons, 61 6-persons.
Size of nonfamily households: 219 1-person, 134 2-persons, 9 3-persons.
632 married couples with children.
107 single-parent households (22 men, 85 women).
76.6% of residents of Hainesville speak English at home.
13.5% of residents speak Spanish at home (53% speak English very well, 33% speak English well, 15% speak English not well).
1.2% of residents speak other Indo-European language at home (87% speak English very well, 13% speak English not well).
6.3% of residents speak Asian or Pacific Island language at home (54% speak English very well, 36% speak English well, 11% speak English not well).
0.5% of residents speak other language at home (82% speak English well, 18% speak English not well).
Foreign born population: 536 (15.2%)
(52.8% of them are naturalized citizens)
| Here: | 6.4 |
| State: | 6.4 |
| Here: | 5.5 |
| State: | 4.1 |

- Bedrooms in owner-occupied houses and condos in Hainesville, Illinois
- 0no bedroom
- 01 bedroom
- 3572 bedrooms
- 4843 bedrooms
- 2674 bedrooms
- 05+ bedrooms

- Bedrooms in renter-occupied apartments in Hainesville, Illinois
- 0no bedroom
- 01 bedroom
- 1392 bedrooms
- 403 bedrooms
- 04 bedrooms
- 05+ bedrooms

- Cars and other vehicles available in Hainesville in owner-occupied houses/condos
- 0no vehicle
- 2161 vehicle
- 5342 vehicles
- 1743 vehicles
- 1844 vehicles
- 05+ vehicles

- Cars and other vehicles available in Hainesville in renter-occupied apartments
- 7no vehicle
- 621 vehicle
- 752 vehicles
- 243 vehicles
- 114 vehicles
- 05+ vehicles

- Rooms in owner-occupied houses in Hainesville, Illinois
- 01 room
- 02 rooms
- 73 rooms
- 944 rooms
- 2705 rooms
- 2136 rooms
- 2757 rooms
- 1478 rooms
- 1019+ rooms

- Rooms in renter-occupied apartments in Hainesville, Illinois
- 01 room
- 02 rooms
- 03 rooms
- 244 rooms
- 695 rooms
- 276 rooms
- 547 rooms
- 68 rooms
- 09+ rooms


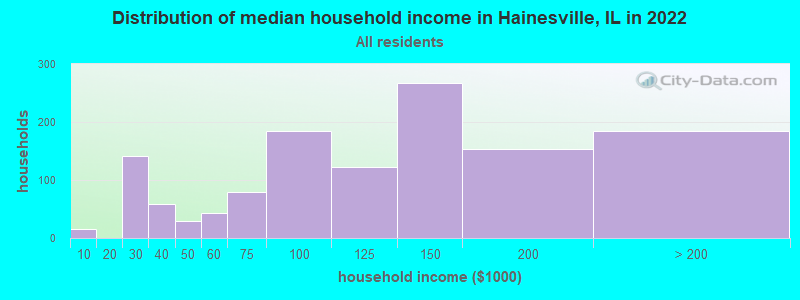
Hainesville, IL household income distribution

- 15Less than $10,000
- 142$20,000 to $29,999
- 59$30,000 to $39,999
- 30$40,000 to $49,999
- 43$50,000 to $59,999
- 79$60,000 to $74,999
- 185$75,000 to $99,999
- 122$100,000 to $124,999
- 268$125,000 to $149,999
- 154$150,000 to $199,999
- 185$200,000 or more
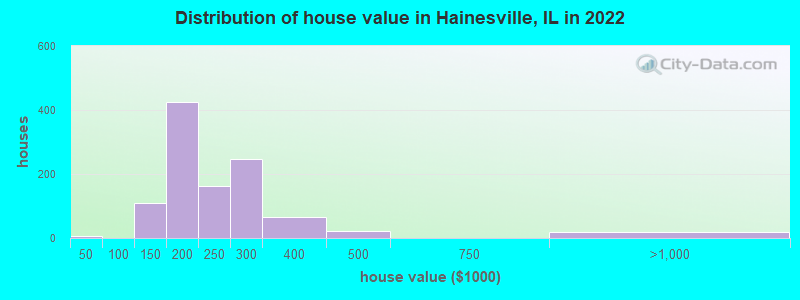
Home value of owner - occupied houses in 2022 in Hainesville, IL
-
- 7Less than $10,000
- 68$100,000 to $124,999
- 40$125,000 to $149,999
- 290$150,000 to $174,999
- 134$175,000 to $199,999
- 160$200,000 to $249,999
- 247$250,000 to $299,999
- 65$300,000 to $399,999
- 21$400,000 to $499,999
- 18$750,000 to $999,999
Rent paid by renters in 2022 in Hainesville, IL
-
- 104$900 to $999
- 31$1,000 to $1,249
- 30$1,500 to $1,999
- 16$2,000 to $2,499
- 31No cash rent


Percentage of workers working in this county: 81.5%
Number of people working at home: 351 (15.6% of all workers)
Travel time to work (commute)
- Less than 5 minutes: 0
- 5 to 9 minutes: 319
- 10 to 14 minutes: 21
- 15 to 19 minutes: 193
- 20 to 24 minutes: 301
- 25 to 29 minutes: 153
- 30 to 34 minutes: 236
- 35 to 39 minutes: 112
- 40 to 44 minutes: 120
- 45 to 59 minutes: 209
- 60 to 89 minutes: 132
- 90 or more minutes: 88
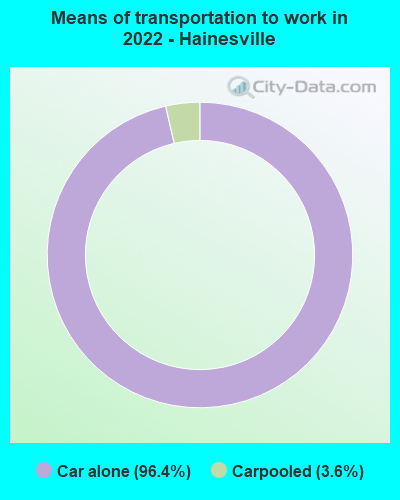
Means of transportation to work:
- Drove a car alone: 491 (80.4%)
- Carpooled: 17 (2.8%)
- Worked at home: 195 (31.9%)

- Unemployment by race in 2022
- Unemployment rate for White non-Hispanic residents
- 0.6%Females
- Unemployment rate for Black residents
- 23.9%Males
- Unemployment rate for other race residents
- 38.1%Males
- Unemployment rate for two or more race residents
- 0.7%Males
- Unemployment rate for Hispanic or Latino residents
- 4.6%Males

- Year of entry for the foreign-born population in Hainesville, Illinois
- 1452010 or later
- 402000 to 2009
- 1581990 to 1999
- 881980 to 1989
- 251970 to 1979
- 17Before 1970

First ancestries reported:
- German: 101 (7.9%)
- European: 74 (5.8%)
- Irish: 61 (4.8%)
- Polish: 53 (4.1%)
- West Indian: 52 (4.1%)
- Italian: 37 (2.9%)
- Swedish: 31 (2.4%)
- Slovene: 16 (1.3%)
- American: 14 (1.1%)
- Scandinavian: 12 (0.9%)
- Arab: 9 (0.7%)
- Iraqi: 2 (0.2%)
Most common places of birth for foreign-born residents (%):
| Hainesville: | 35.9% (184) |
| Illinois: | 34.7% (626,958) |
| Hainesville: | 12.5% (64) |
| Illinois: | 0.2% (3,065) |
| Hainesville: | 8.0% (41) |
| Illinois: | 2.2% (40,393) |
| Hainesville: | 7.6% (39) |
| Illinois: | 0.4% (7,171) |
| Hainesville: | 7.0% (36) |
| Illinois: | 6.9% (124,474) |
| Hainesville: | 6.8% (35) |
| Illinois: | 5.2% (93,003) |
| Hainesville: | 6.4% (33) |
| Illinois: | 0.1% (1,403) |
| Hainesville: | 3.1% (16) |
| Illinois: | 0.1% (1,954) |
| Hainesville: | 2.9% (15) |
| Illinois: | 1.0% (18,753) |
| Hainesville: | 2.9% (15) |
| Illinois: | 0.9% (16,553) |
| Hainesville: | 2.3% (12) |
| Illinois: | 0.7% (13,214) |
Place of birth for U.S.-born residents:
- This state: 2,388
- Other state: 502
- Northeast: 131
- Midwest: 243
- South: 110
- West: 10
92.1% of Hainesville residents lived in the same house 1 years ago.
Out of people who lived in different houses, 48.3% lived in this county.
| Hainesville: | 92.1% |
| State average: | 88.3% |
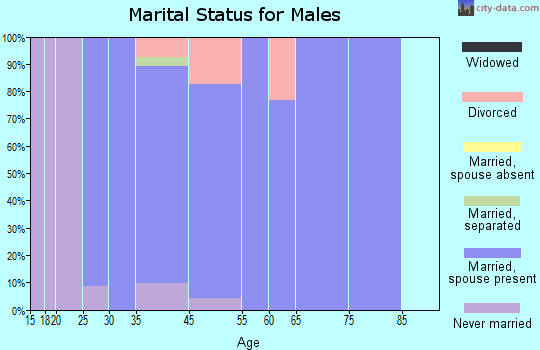
Education attainment for males 25 years and older:
- No schooling: 14
- Nursery to 4th grade: 18
- 5th and 6th grade: 20
- 7th and 8th grade: 0
- 9th grade: 0
- 10th grade: 0
- 11th grade: 0
- 12th grade, no diploma: 0
- High school graduate (or equivalency): 353
- Less than 1 year of college: 74
- Some college more than 1 year, no degree: 147
- Associate degree: 108
- Bachelor's degree: 326
- Master's degree: 137
- Professional school degree: 0
- Doctorate degree: 32

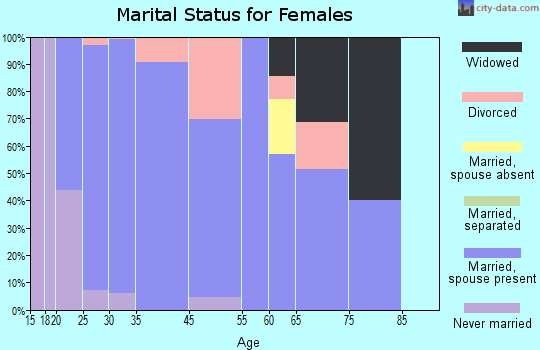
Education attainment for females 25 years and older:
- No schooling: 17
- Nursery to 4th grade: 0
- 5th and 6th grade: 19
- 7th and 8th grade: 0
- 9th grade: 20
- 10th grade: 0
- 11th grade: 5
- 12th grade, no diploma: 9
- High school graduate (or equivalency): 242
- Less than 1 year of college: 87
- Some college more than 1 year, no degree: 90
- Associate degree: 76
- Bachelor's degree: 359
- Master's degree: 166
- Professional school degree: 0
- Doctorate degree: 0

Housing units in structures:
- One, detached: 731
- One, attached: 405
- 3 or 4: 52
- 5 to 9: 54
- Mobile homes: 20
House/condo owner moved in on average 9 years ago
Renter moved in on average 7 years ago

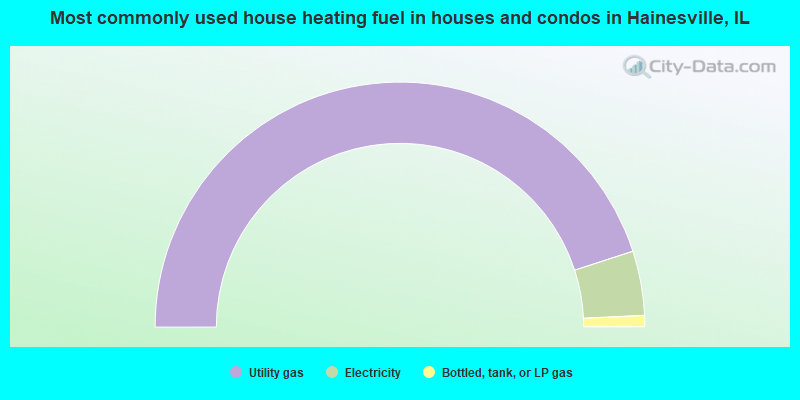
- 90.0%Utility gas
- 8.5%Electricity
- 1.5%Bottled, tank, or LP gas
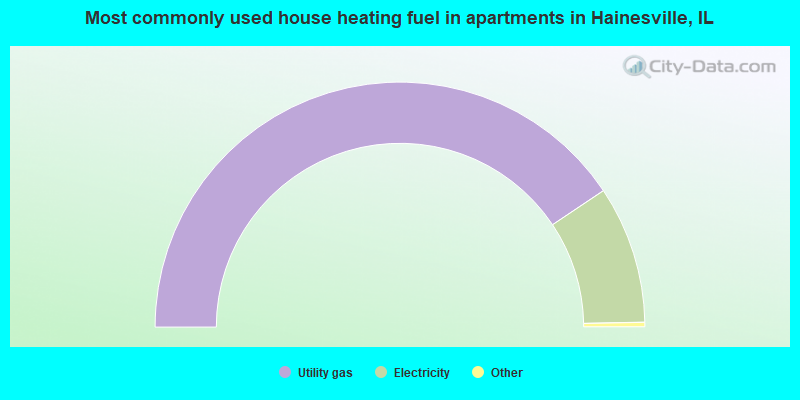
- 81.7%Utility gas
- 18.3%Electricity
Private vs. public school enrollment:
| Here: | 39.9% |
| Illinois: | 13.3% |
| Here: | 28.3% |
| Illinois: | 9.9% |
| Here: | 46.7% |
| Illinois: | 27.4% |


