Hauppauge, NY (New York) Houses and Residents
Estimated median house or condo value in 2022: $688,018 (it was $247,300 in 2000 )
Hauppauge:
$688,018New York:
$400,400
Lower value quartile - upper value quartile: $552,166 - $763,197Mean price in 2022: Detached houses: $701,930 Here:
$701,930State:
$476,719
Townhouses or other attached units: $642,602 Here:
$642,602State:
$699,270
In 2-unit structures: $601,571 Here:
$601,571State:
$713,077
In 3-to-4-unit structures: $510,705 Here:
$510,705State:
$764,568
In 5-or-more-unit structures: $268,258 Here:
$268,258State:
$912,009
Total population: 20,882 (Urban population: 20,127, Rural population: 0)
Houses: 7,150 (6,849 occupied: 5,671 owner occupied, 1,175 renter occupied )
% of renters here:
17%State:
46%
Housing density: 662 houses/condos per square mile
Median price asked for vacant for-sale houses and condos in 2022: $8,902,564.
Median contract rent in 2022: over $2,000 (lower quartile is $1,998, upper quartile is over $2,000)
Median rent asked for vacant for-rent units in 2022: $3,367
Median gross rent in Hauppauge, NY in 2022: over $2,000
Housing units in Hauppauge with a mortgage: 3,491 (472 second mortgage, 13 home equity loan, 445 both second mortgage and home equity loan )Houses without a mortgage: 174
Median household income for houses/condos with a mortgage: $167,890
Median household income for apartments without a mortgage: $120,519
Median monthly housing costs: $2,483
Data:
Median house or condo value ($)
Median house or condo value ($ change since 2000)
Median house or condo value ($) - White
Median house or condo value ($) - Black or African American
Median house or condo value ($) - Asian
Median house or condo value ($) - Hispanic or Latino
Median house or condo value ($) - American Indian and Alaska Native
Median house or condo value ($) - Multirace
Median house or condo value ($) - Other Race
Median price asked for mobile homes ($)
Household density (households per square mile)
Mean house or condo value by units in structure - 1, detached ($)
Mean house or condo value by units in structure - 1, attached ($)
Mean house or condo value by units in structure - 2 ($)
Mean house or condo value by units in structure by units in structure - 3 or 4 ($)
Mean house or condo value by units in structure - 5 or more ($)
Mean house or condo value by units in structure - Boat, RV, van, etc. ($)
Mean house or condo value by units in structure - Mobile home ($)
Median contract rent ($)
Median contract rent - Lower quartile ($)
Median contract rent - Upper quartile ($)
Median gross rent ($)
Urban houses (%)
Rural houses (%)
Houses occupied (%)
Houses occupied (% change since 2000)
Houses owner occupied (%)
Houses owner occupied (% change since 2000)
Houses renter occupied (%)
Houses renter occupied (% change since 2000)
Vacant housing units - For rent (%)
Vacant housing units - For rent (% change since 2000)
Vacant housing units - For sale only (%)
Vacant housing units - For sale only (% change since 2000)
Vacant housing units - Rented or sold, not occupied (%)
Vacant housing units - Rented or sold, not occupied (% change since 2000)
Vacant housing units - For seasonal, recreational, or occasional use (%)
Vacant housing units - For seasonal, recreational, or occasional use (% change since 2000)
Vacant housing units - For migrant workers (%)
Vacant housing units - For migrant workers (% change since 2000)
Vacant housing units - Other vacant (%)
Vacant housing units - Other vacant (% change since 2000)
Median monthly housing costs ($)
Median household income for houses/condos with a mortgage ($)
Median household income for houses/condos without a mortgage ($)
Median household income ($)
Median household income ($) - White
Median household income ($) - Black or African American
Median household income ($) - Asian
Median household income ($) - Hispanic or Latino
Median household income ($) - American Indian and Alaska Native
Median household income ($) - Multirace
Median household income ($) - Other Race
Mortgage status - with mortgage (%)
Mortgage status - with second mortgage (%)
Mortgage status - with home equity loan (%)
Mortgage status - with both second mortgage and home equity loan (%)
Mortgage status - without a mortgage (%)
Median year house/condo built
Median year apartment built
Household type by relationship - Male householder living alone (%)
Household type by relationship - Male householder not living alone (%)
Household type by relationship - Female householder living alone (%)
Household type by relationship - Female householder not living alone (%)
Household type by relationship - Opposite-Sex spouse (%)
Household type by relationship - Same-Sex spouse (%)
Household type by relationship - Opposite-Sex unmarried partner (%)
Household type by relationship - Same-Sex unmarried partner (%)
Household type by relationship - In group quarters (%)
Size of family households - 2-person household (%)
Size of family households - 3-person household (%)
Size of family households - 4-person household (%)
Size of family households - 5-person household (%)
Size of family households - 6-person household (%)
Size of family households - 7-or-more-person household (%)
Size of nonfamily households - 1-person household (%)
Size of nonfamily households - 2-person household (%)
Size of nonfamily households - 3-person household (%)
Size of nonfamily households - 4-person household (%)
Size of nonfamily households - 5-person household (%)
Size of nonfamily households - 6-person household (%)
Size of nonfamily households - 7-or-moreperson household (%)
Year house built - Built 2010 or later (%)
Year house built - Built 2000 to 2009 (%)
Year house built - Built 1990 to 1999 (%)
Year house built - Built 1980 to 1989 (%)
Year house built - Built 1970 to 1979 (%)
Year house built - Built 1960 to 1969 (%)
Year house built - Built 1950 to 1959 (%)
Year house built - Built 1940 to 1949 (%)
Year house built - Built 1939 or earlier (%)
Median number of rooms in houses and condos
Median number of rooms in apartments
Median number of bedrooms in owner occupied houses
Mean number of bedrooms in owner occupied houses
Median number of bedrooms in renter occupied houses
Mean number of bedrooms in renter occupied houses
Median number of vehichles in owner occupied houses
Mean number of vehichles in owner occupied houses
Median number of vehichles in renter occupied houses
Mean number of vehichles in renter occupied houses
Rooms in owner-occupied houses - 1 room (%)
Rooms in owner-occupied houses - 2 rooms (%)
Rooms in owner-occupied houses - 3 rooms (%)
Rooms in owner-occupied houses - 4 rooms (%)
Rooms in owner-occupied houses - 5 rooms (%)
Rooms in owner-occupied houses - 6 rooms (%)
Rooms in owner-occupied houses - 7 rooms (%)
Rooms in owner-occupied houses - 8 rooms (%)
Rooms in owner-occupied houses - 9+ rooms (%)
Rooms in renter-occupied houses - 1 room (%)
Rooms in renter-occupied houses - 2 rooms (%)
Rooms in renter-occupied houses - 3 rooms (%)
Rooms in renter-occupied houses - 4 rooms (%)
Rooms in renter-occupied houses - 5 rooms (%)
Rooms in renter-occupied houses - 6 rooms (%)
Rooms in renter-occupied houses - 7 rooms (%)
Rooms in renter-occupied houses - 8 rooms (%)
Rooms in renter-occupied houses - 9+ rooms (%)
Bedrooms in owner-occupied houses - no bedrooms (%)
Bedrooms in owner-occupied houses - 1 bedroom (%)
Bedrooms in owner-occupied houses - 2 bedrooms (%)
Bedrooms in owner-occupied houses - 3 bedrooms (%)
Bedrooms in owner-occupied houses - 4 bedrooms (%)
Bedrooms in owner-occupied houses - 5+ bedrooms (%)
Bedrooms in renter-occupied houses - no bedrooms (%)
Bedrooms in renter-occupied houses - 1 bedroom (%)
Bedrooms in renter-occupied houses - 2 bedrooms (%)
Bedrooms in renter-occupied houses - 3 bedrooms (%)
Bedrooms in renter-occupied houses - 4 bedrooms (%)
Bedrooms in renter-occupied houses - 5+ bedrooms (%)
Vehicles available in owner-occupied houses - no vehicle available (%)
Vehicles available in owner-occupied houses - 1 vehicle available(%)
Vehicles available in owner-occupied houses - 2 Vehicles available (%)
Vehicles available in owner-occupied houses - 3 Vehicles available (%)
Vehicles available in owner-occupied houses - 4 Vehicles available (%)
Vehicles available in owner-occupied houses - 5+ Vehicles available (%)
Vehicles available in renter-occupied houses - no vehicle available (%)
Vehicles available in renter-occupied houses - 1 vehicle available (%)
Vehicles available in renter-occupied houses - 2 Vehicles available (%)
Vehicles available in renter-occupied houses - 3 Vehicles available (%)
Vehicles available in renter-occupied houses - 4 Vehicles available (%)
Vehicles available in renter-occupied houses - 5+ Vehicles available (%)
Housing units in structures - 1, detached (%)
Housing units in structures - 1, attached (%)
Housing units in structures - 2 (%)
Housing units in structures - 3 or 4 (%)
Housing units in structures - 5 to 9 (%)
Housing units in structures - 10 to 19 (%)
Housing units in structures - 20 to 49 (%)
Housing units in structures - 50 or more (%)
Housing units in structures - Mobile home (%)
Housing units in structures - Boat, RV, van, etc. (%)
Housing units in structures - Owners - 1, detached (%)
Housing units in structures - Owners - 1, attached (%)
Housing units in structures - Owners - 2 (%)
Housing units in structures - Owners - 3 or 4 (%)
Housing units in structures - Owners - 5 to 9 (%)
Housing units in structures - Owners - 10 to 19 (%)
Housing units in structures - Owners - 20 to 49 (%)
Housing units in structures - Owners - 50 or more (%)
Housing units in structures - Owners - Mobile home (%)
Housing units in structures - Owners - Boat, RV, van, etc. (%)
Housing units in structures - Renters - 1, detached (%)
Housing units in structures - Renters - 1, attached (%)
Housing units in structures - Renters - 2 (%)
Housing units in structures - Renters - 3 or 4 (%)
Housing units in structures - Renters - 5 to 9 (%)
Housing units in structures - Renters - 10 to 19 (%)
Housing units in structures - Renters - 20 to 49 (%)
Housing units in structures - Renters - 50 or more (%)
Housing units in structures - Renters - Mobile home (%)
Housing units in structures - Renters - Boat, RV, van, etc. (%)
House/condo owner moved in on average (years ago)
Renter moved in on average (years ago)
Year householder moved into unit - Moved in 1999 to March 2000 (%)
Year householder moved into unit - Moved in 1999 to March 2000 (%) - White
Year householder moved into unit - Moved in 1999 to March 2000 (%) - Black or African American
Year householder moved into unit - Moved in 1999 to March 2000 (%) - Asian
Year householder moved into unit - Moved in 1999 to March 2000 (%) - Hispanic or Latino
Year householder moved into unit - Moved in 1999 to March 2000 (%) - American Indian and Alaska Native
Year householder moved into unit - Moved in 1999 to March 2000 (%) - Multirace
Year householder moved into unit - Moved in 1999 to March 2000 (%) - Other Race
Year householder moved into unit - Moved in 1995 to 1998 (%)
Year householder moved into unit - Moved in 1995 to 1998 (%) - White
Year householder moved into unit - Moved in 1995 to 1998 (%) - Black or African American
Year householder moved into unit - Moved in 1995 to 1998 (%) - Asian
Year householder moved into unit - Moved in 1995 to 1998 (%) - Hispanic or Latino
Year householder moved into unit - Moved in 1995 to 1998 (%) - American Indian and Alaska Native
Year householder moved into unit - Moved in 1995 to 1998 (%) - Multirace
Year householder moved into unit - Moved in 1995 to 1998 (%) - Other Race
Year householder moved into unit - Moved in 1990 to 1994 (%)
Year householder moved into unit - Moved in 1990 to 1994 (%) - White
Year householder moved into unit - Moved in 1990 to 1994 (%) - Black or African American
Year householder moved into unit - Moved in 1990 to 1994 (%) - Asian
Year householder moved into unit - Moved in 1990 to 1994 (%) - Hispanic or Latino
Year householder moved into unit - Moved in 1990 to 1994 (%) - American Indian and Alaska Native
Year householder moved into unit - Moved in 1990 to 1994 (%) - Multirace
Year householder moved into unit - Moved in 1990 to 1994 (%) - Other Race
Year householder moved into unit - Moved in 1980 to 1989 (%)
Year householder moved into unit - Moved in 1980 to 1989 (%) - White
Year householder moved into unit - Moved in 1980 to 1989 (%) - Black or African American
Year householder moved into unit - Moved in 1980 to 1989 (%) - Asian
Year householder moved into unit - Moved in 1980 to 1989 (%) - Hispanic or Latino
Year householder moved into unit - Moved in 1980 to 1989 (%) - American Indian and Alaska Native
Year householder moved into unit - Moved in 1980 to 1989 (%) - Multirace
Year householder moved into unit - Moved in 1980 to 1989 (%) - Other Race
Year householder moved into unit - Moved in 1970 to 1979 (%)
Year householder moved into unit - Moved in 1970 to 1979 (%) - White
Year householder moved into unit - Moved in 1970 to 1979 (%) - Black or African American
Year householder moved into unit - Moved in 1970 to 1979 (%) - Asian
Year householder moved into unit - Moved in 1970 to 1979 (%) - Hispanic or Latino
Year householder moved into unit - Moved in 1970 to 1979 (%) - American Indian and Alaska Native
Year householder moved into unit - Moved in 1970 to 1979 (%) - Multirace
Year householder moved into unit - Moved in 1970 to 1979 (%) - Other Race
Year householder moved into unit - Moved in 1969 or earlier (%)
Year householder moved into unit - Moved in 1969 or earlier (%) - White
Year householder moved into unit - Moved in 1969 or earlier (%) - Black or African American
Year householder moved into unit - Moved in 1969 or earlier (%) - Asian
Year householder moved into unit - Moved in 1969 or earlier (%) - Hispanic or Latino
Year householder moved into unit - Moved in 1969 or earlier (%) - American Indian and Alaska Native
Year householder moved into unit - Moved in 1969 or earlier (%) - Multirace
Year householder moved into unit - Moved in 1969 or earlier (%) - Other Race
Housing units lacking complete plumbing facilities (%)
Housing units lacking complete kitchen facilities (%)
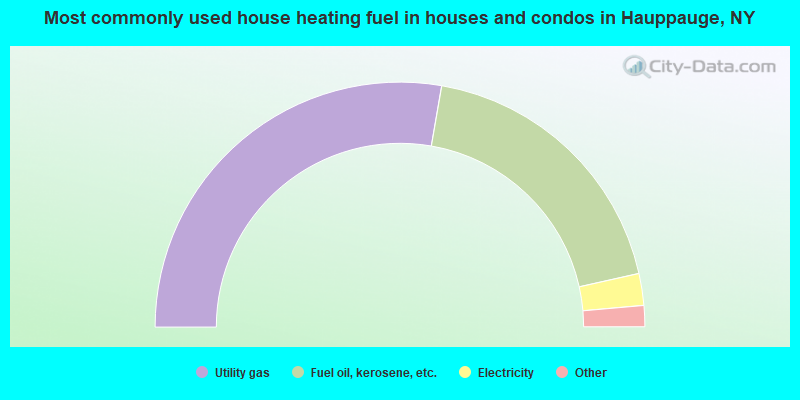
House heating fuel used in houses and condos - Utility gas (%)
House heating fuel used in houses and condos - Bottled, tank, or LP gas (%)
House heating fuel used in houses and condos - Electricity (%)
House heating fuel used in houses and condos - Fuel oil, kerosene, etc. (%)
House heating fuel used in houses and condos - Coal or coke (%)
House heating fuel used in houses and condos - Wood (%)
House heating fuel used in houses and condos - Solar energy (%)
House heating fuel used in houses and condos - Other fuel (%)
House heating fuel used in houses and condos - No fuel used (%)
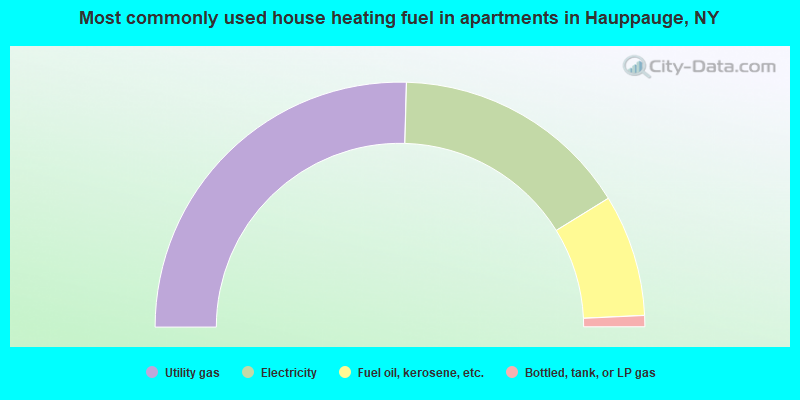
House heating fuel used in apartments - Utility gas (%)
House heating fuel used in apartments - Bottled, tank, or LP gas (%)
House heating fuel used in apartments - Electricity (%)
House heating fuel used in apartments - Fuel oil, kerosene, etc. (%)
House heating fuel used in apartments - Coal or coke (%)
House heating fuel used in apartments - Wood (%)
House heating fuel used in apartments - Solar energy (%)
House heating fuel used in apartments - Other fuel (%)
House heating fuel used in apartments - No fuel used (%)
Latest news about housing in Hauppauge, NY collected exclusively by city-data.com from local newspapers, TV, and radio stations
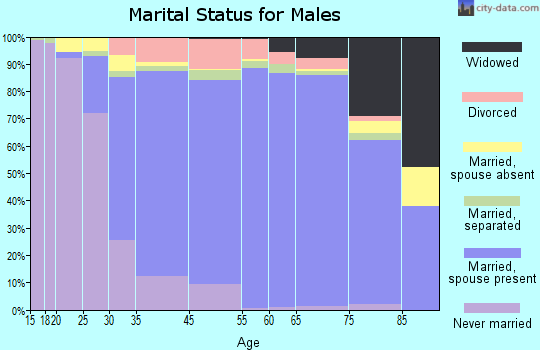
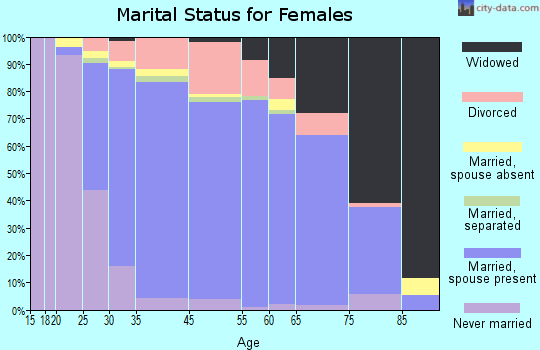
Median year house/condo built: 1967Median year apartment built: 1980Household type by relationship:
Households: 20,414
Male householders: 3,188 (527 living alone ), Female householders: 3,646 (698 living alone )4,569 spouses (4,564 opposite-sex spouses ), 360 unmarried partners , (345 opposite-sex unmarried partners ), 6,792 children (6,593 natural , 52 adopted , 147 stepchildren ), 402 grandchildren , 132 brothers or sisters , 365 parents , 0 foster children , 297 other relatives , 506 non-relatives In group quarters: 154
Size of family households: 2,145 2-persons , 1,223 3-persons , 1,260 4-persons , 435 5-persons , 58 6-persons , 135 7-or-more-persons .
Size of nonfamily households: 1,235 1-person , 301 2-persons , 57 3-persons .
2,709 married couples with children. single-parent households (241 men , 500 women ).
84.6% of residents of Hauppauge speak English at home. of residents speak Spanish at home (45% speak English very well , 30% speak English well , 24% speak English not well , 1% don't speak English at all ).of residents speak other Indo-European language at home (73% speak English very well , 19% speak English well , 8% speak English not well ).of residents speak Asian or Pacific Island language at home (57% speak English very well , 36% speak English well , 2% speak English not well , 4% don't speak English at all ).of residents speak other language at home (82% speak English very well , 14% speak English well , 4% speak English not well ).
Foreign born population: 2,471 (12.1%)of them are naturalized citizens )
Median number of rooms in houses and condos:
Median number of rooms in apartments
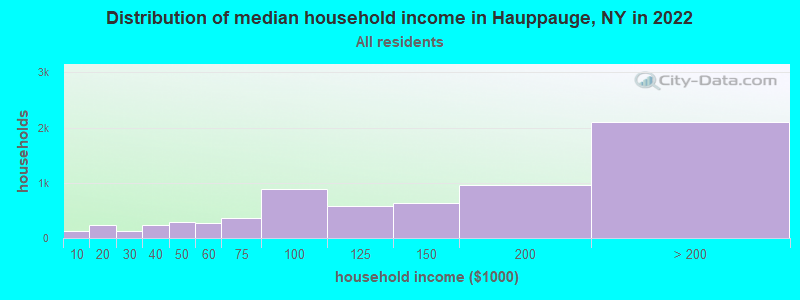
Hauppauge, NY household income distribution 132 Less than $10,000240 $10,000 to $19,999132 $20,000 to $29,999232 $30,000 to $39,999294 $40,000 to $49,999265 $50,000 to $59,999368 $60,000 to $74,999881 $75,000 to $99,999575 $100,000 to $124,999634 $125,000 to $149,999968 $150,000 to $199,9992,101 $200,000 or more
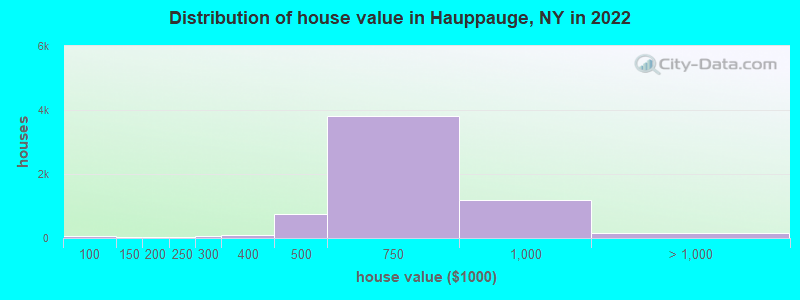
Home value of owner - occupied houses in 2022 in Hauppauge, NY 9 Less than $10,0006 $25,000 to $29,9998 $35,000 to $39,99930 $50,000 to $59,99929 $60,000 to $69,9997 $100,000 to $124,99910 $125,000 to $149,99929 $150,000 to $174,99911 $175,000 to $199,99945 $200,000 to $249,99961 $250,000 to $299,99995 $300,000 to $399,999757 $400,000 to $499,9993,817 $500,000 to $749,9991,200 $750,000 to $999,999148 $1,000,000 to $1,499,99917 $2,000,000 or moreRent paid by renters in 2022 in Hauppauge, NY 6 $700 to $74943 $1,000 to $1,24921 $1,250 to $1,49968 $1,500 to $1,999563 $2,000 to $2,499359 $2,500 to $2,99983 $3,000 to $3,49931 $3,500 or more74 No cash rent
Percentage of workers working in this county: 80.1%Number of people working at home: 1,327 (12.4% of all workers )
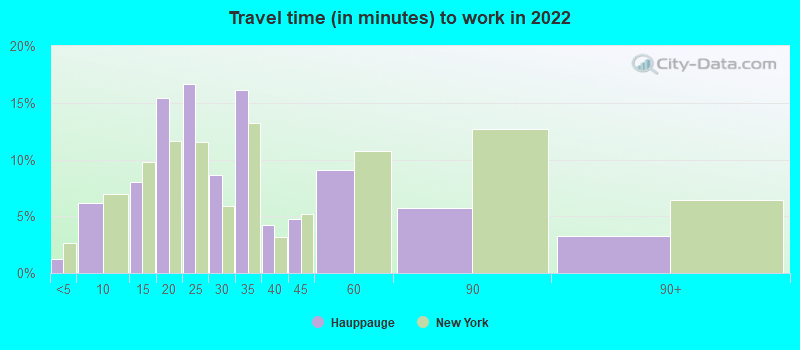
Travel time to work (commute)
Less than 5 minutes: 2625 to 9 minutes: 1,01710 to 14 minutes: 86315 to 19 minutes: 1,25220 to 24 minutes: 1,14825 to 29 minutes: 61830 to 34 minutes: 1,69835 to 39 minutes: 26540 to 44 minutes: 38145 to 59 minutes: 62460 to 89 minutes: 74590 or more minutes: 490
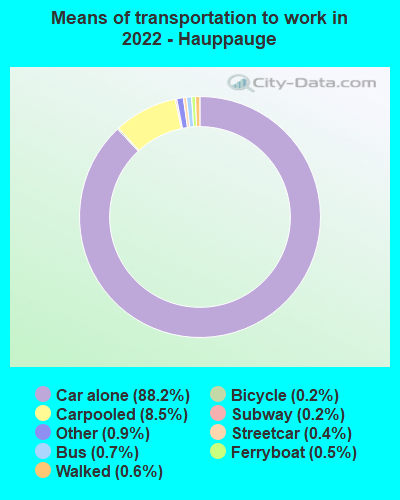
Means of transportation to work:
Drove a car alone: 24,405 (80.6%)Carpooled: 2,683 (8.9%)Bus : 167 (0.6%)Subway or elevated rail : 121 (0.4%)Long-distance train or commuter rail : 55 (0.2%)Ferryboat: 68 (0.2%)Taxi: 308 (1.0%)Bicycle: 32 (0.1%)Walked: 167 (0.6%)Worked at home: 1,327 (4.4%)
Unemployment by race in 2022
Unemployment rate for White non-Hispanic residents 6.1% Males1.7% FemalesUnemployment rate for Black residents 12.7% FemalesUnemployment rate for Asian residents 3.3% Males5.5% FemalesUnemployment rate for two or more race residents 29.0% MalesUnemployment rate for Hispanic or Latino residents 7.5% Males
Year of entry for the foreign-born population in Hauppauge, New York
965 2010 or later 361 2000 to 2009 432 1990 to 1999 305 1980 to 1989 269 1970 to 1979 602 Before 1970
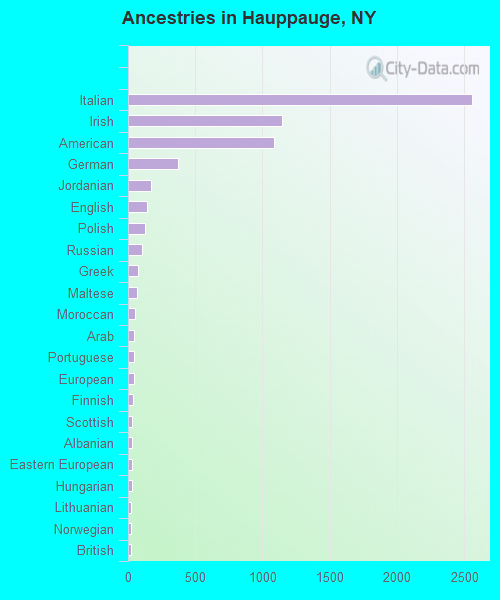
First ancestries reported:
Italian: 2,558 (29.4%)
Irish: 1,144 (13.2%)
American: 1,086 (12.5%)
German: 372 (4.3%)
Jordanian: 173 (2.0%)
English: 142 (1.6%)
Polish: 127 (1.5%)
Russian: 104 (1.2%)
Greek: 78 (0.9%)
Maltese: 67 (0.8%)
Moroccan: 52 (0.6%)
Arab: 46 (0.5%)
Portuguese: 46 (0.5%)
European: 43 (0.5%)
Finnish: 39 (0.4%)
Scottish: 31 (0.4%)
Albanian: 30 (0.3%)
Eastern European: 28 (0.3%)
Hungarian: 27 (0.3%)
Lithuanian: 26 (0.3%)
Norwegian: 26 (0.3%)
British: 25 (0.3%)
Soviet Union: 23 (0.3%)
Ukrainian: 21 (0.2%)
Iranian: 18 (0.2%)
Haitian: 17 (0.2%)
Croatian: 16 (0.2%)
French: 16 (0.2%)
Trinidadian and Tobagonian: 12 (0.1%)
Dutch: 11 (0.1%)
Swiss: 10 (0.1%)
Slovak: 9 (0.1%)
French Canadian: 7 (0.08%)
Danish: 5 (0.06%)
Romanian: 5 (0.06%)
Armenian: 3 (0.03%)
Afghan: 1 (0.01%) Most common places of birth for foreign-born residents (%): India Hauppauge:
16.1% (368)New York:
3.5% (158,432)
Dominican Republic Hauppauge:
8.0% (182)New York:
11.1% (501,040)
Colombia Hauppauge:
7.4% (168)New York:
2.5% (111,920)
Morocco Hauppauge:
6.4% (146)New York:
0.2% (10,005)
El Salvador Hauppauge:
6.4% (145)New York:
2.4% (108,067)
Korea Hauppauge:
4.3% (98)New York:
1.8% (82,786)
Italy Hauppauge:
4.3% (97)New York:
1.8% (81,374)
China, excluding Hong Kong and Taiwan Hauppauge:
4.2% (95)New York:
9.1% (410,910)
Peru Hauppauge:
3.9% (89)New York:
1.2% (54,759)
Pakistan Hauppauge:
3.6% (83)New York:
1.4% (62,442)
Germany Hauppauge:
3.6% (81)New York:
0.9% (38,713)
Jordan Hauppauge:
2.8% (63)New York:
0.1% (5,923)
Singapore Hauppauge:
2.6% (60)New York:
0.1% (3,853)
England Hauppauge:
2.5% (56)New York:
0.5% (23,058)
Vietnam Hauppauge:
2.0% (45)New York:
0.6% (25,517)
Other Eastern Europe Hauppauge:
1.7% (38)New York:
0.7% (30,173)
Place of birth for U.S.-born residents:
This state: 16,382Other state: 1,095Northeast: 544Midwest: 94South: 268West: 170 92.1% of Hauppauge residents lived in the same house 1 years ago.
Out of people who lived in different houses, 36.0% lived in this county.
Out of people who lived in different counties, 71.8% lived in New York.
Hauppauge:
92.1%State average:
89.6%
Education attainment for males 25 years and older:
No schooling: 183Nursery to 4th grade: 705th and 6th grade: 287th and 8th grade: 09th grade: 4010th grade: 2211th grade: 912th grade, no diploma: 171High school graduate (or equivalency): 1,533Less than 1 year of college: 400Some college more than 1 year, no degree: 713Associate degree: 785Bachelor's degree: 2,043Master's degree: 1,052Professional school degree: 205Doctorate degree: 105
Education attainment for females 25 years and older:
No schooling: 132Nursery to 4th grade: 05th and 6th grade: 77th and 8th grade: 229th grade: 2010th grade: 8911th grade: 9712th grade, no diploma: 66High school graduate (or equivalency): 1,237Less than 1 year of college: 518Some college more than 1 year, no degree: 599Associate degree: 687Bachelor's degree: 1,881Master's degree: 1,594Professional school degree: 174Doctorate degree: 93
Housing units in structures:
One, detached: 5,382One, attached: 429Two: 1723 or 4: 1085 to 9: 51310 to 19: 35120 to 49: 1350 or more: 156Mobile homes: 24Housing units lacking complete plumbing facilities in 2022: 0.4%Housing units lacking complete kitchen facilities in 2022: 0.4%House/condo owner moved in on average 18 years ago
Renter moved in on average 0 years ago
Private vs. public school enrollment:
Students in private schools in grades 1 to 8 (elementary and middle school): 7 Students in private schools in grades 9 to 12 (high school): 74 Students in private undergraduate colleges: 238