Henderson, KY (Kentucky) Houses and Residents
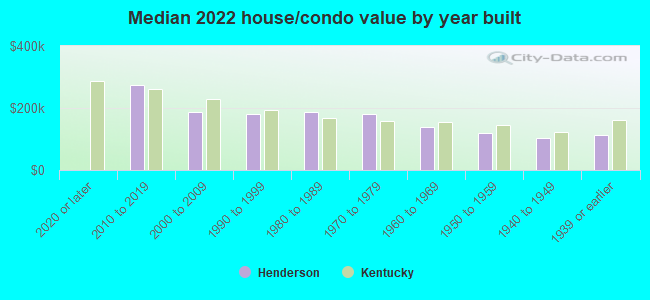
| Henderson: | $159,924 |
| Kentucky: | $196,300 |
Mean price in 2022:
Detached houses: $199,614
Here: $199,614 State: $256,452 Townhouses or other attached units: $130,214
Here: $130,214 State: $264,090 In 5-or-more-unit structures: $91,776
Here: $91,776 State: $245,174 Mobile homes: $33,542
Here: $33,542 State: $84,635
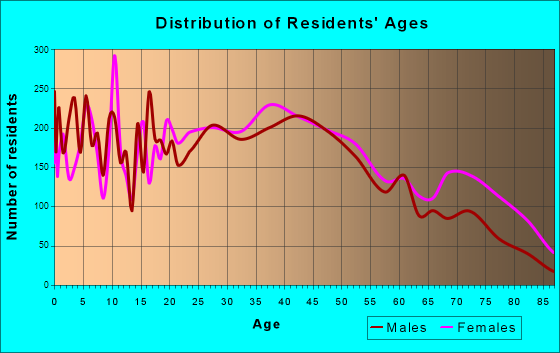
Total population: 28,900 (Urban population: 26,202, Rural population: 1,183 (all nonfarm))
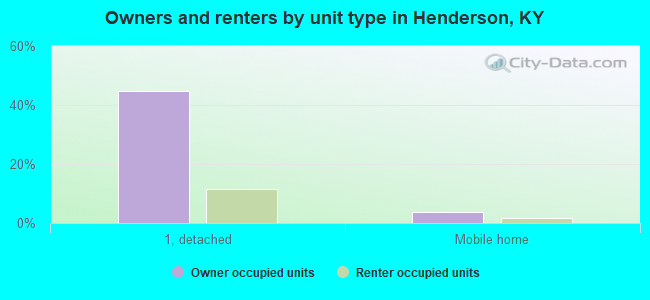
Houses: 13,662 (12,281 occupied: 6,694 owner occupied, 5,847 renter occupied)
| % of renters here: | 47% |
| State: | 31% |
Housing density: 913 houses/condos per square mile
Median price asked for vacant for-sale houses and condos in 2022: $106,553.
Median contract rent in 2022: $609 (lower quartile is $464, upper quartile is $735)
Median rent asked for vacant for-rent units in 2022: $605
Median gross rent in Henderson, KY in 2022: $752
Housing units in Henderson with a mortgage: 3,732 (414 second mortgage, 25 home equity loan, 263 both second mortgage and home equity loan)
Houses without a mortgage: 94
Median household income for houses/condos with a mortgage: $78,142
Median household income for apartments without a mortgage: $56,074
Median monthly housing costs: $775
Compare current foreclosures in Henderson, KY:
| Photo | Address | Area | Beds / Baths | Price | Details |
|---|---|---|---|---|---|

|
#1
Larue Rd
Henderson, KY 42420
|
3,374 sq. feet
|
3 baths 5 beds |
$390,000
|
show details |

|
#2
Pond St
Henderson, KY 42420
|
678 sq. feet
|
1 baths 2 beds |
$75,000
|
show details |

|
#3
Brenda Dr
Henderson, KY 42420
|
1,296 sq. feet
|
1 baths 3 beds |
show details | |

|
#4
Letcher St
Henderson, KY 42420
|
1,272 sq. feet
|
1 baths 3 beds |
show details | |

|
#5
Pines Dr
Henderson, KY 42420
|
1,950 sq. feet
|
2 baths 3 beds |
show details | |

|
#6
Cherokee Rd
Henderson, KY 42420
|
1,712 sq. feet
|
1 baths 3 beds |
show details | |

|
#7
Onionville Rd
Henderson, KY 42420
|
1,808 sq. feet
|
1 baths 3 beds |
show details | |

|
#8
Rosewood Cv
Henderson, KY 42420
|
768 sq. feet
|
1 baths 2 beds |
show details | |

|
#9
Wilderness Dr
Henderson, KY 42420
|
2,193 sq. feet
|
2 baths 3 beds |
show details | |

|
#10
Oak St
Henderson, KY 42420
|
1,385 sq. feet
|
2 baths 3 beds |
show details |
| Photo | Address | Area | Beds / Baths | Price | Details |
|---|---|---|---|---|---|

|
#11
Mallard Ln
Henderson, KY 42420
|
1,671 sq. feet
|
2 baths 3 beds |
show details | |

|
#12
Whettstone St
Henderson, KY 42420
|
1,520 sq. feet
|
2 baths 4 beds |
show details | |

|
#13
E Fox Hollow Run
Henderson, KY 42420
|
1,347 sq. feet
|
2 baths 3 beds |
show details | |

|
#14
Terrace Ct
Henderson, KY 42420
|
1,600 sq. feet
|
2 baths 3 beds |
show details | |

|
#15
Herron Ave
Henderson, KY 42420
|
876 sq. feet
|
1 baths 2 beds |
show details | |

|
#16
Poplar Ave
Henderson, KY 42420
|
1,200 sq. feet
|
1 baths 4 beds |
show details | |

|
#17
S Green St
Henderson, KY 42420
|
956 sq. feet
|
1 baths 2 beds |
show details | |

|
#18
Elk Ave
Henderson, KY 42420
|
700 sq. feet
|
1 baths 2 beds |
show details | |

|
#19
Lexington Dr
Henderson, KY 42420
|
1,425 sq. feet
|
1 baths 3 beds |
show details | |

|
#20
Millcreek Dr
Henderson, KY 42420
|
1,058 sq. feet
|
1 baths - beds |
show details |
| Photo | Address | Area | Beds / Baths | Price | Details |
|---|---|---|---|---|---|

|
#21
Old Orchard Ln
Henderson, KY 42420
|
1,259 sq. feet
|
1 baths - beds |
show details | |

|
#22
Dr Anthony M Brooks St
Henderson, KY 42420
|
840 sq. feet
|
1 baths - beds |
show details | |

|
#23
Clay St
Henderson, KY 42420
|
896 sq. feet
|
1 baths - beds |
show details | |

|
#24
Helm St
Henderson, KY 42420
|
2,032 sq. feet
|
1 baths - beds |
show details | |

|
#25
Millcreek Dr
Henderson, KY 42420
|
1,761 sq. feet
|
2 baths - beds |
show details | |

|
#26
Springer Rd
Henderson, KY 42420
|
1,088 sq. feet
|
1 baths - beds |
show details | |

|
#27
Glengary Way
Henderson, KY 42420
|
1,748 sq. feet
|
2 baths - beds |
show details | |

|
#28
N Adams St
Henderson, KY 42420
|
1,148 sq. feet
|
1 baths - beds |
show details | |

|
#29
Lake Dr
Henderson, KY 42420
|
1,025 sq. feet
|
1 baths - beds |
show details | |

|
#30
Spruce Dr
Henderson, KY 42420
|
1,550 sq. feet
|
1 baths - beds |
show details |
| Photo | Address | Area | Beds / Baths | Price | Details |
|---|---|---|---|---|---|

|
#31
Madison St
Henderson, KY 42420
|
1,380 sq. feet
|
1 baths - beds |
show details | |

|
#32
Glover Dr
Henderson, KY 42420
|
960 sq. feet
|
1 baths - beds |
show details | |

|
#33
Piper Ln
Henderson, KY 42420
|
1,524 sq. feet
|
2 baths - beds |
show details | |

|
#34
Beechwood Dr
Henderson, KY 42420
|
1,667 sq. feet
|
2 baths - beds |
show details | |

|
#35
Fernwood Ave
Henderson, KY 42420
|
- sq. feet
|
- baths - beds |
show details | |

|
#36
Pebble Crk Apt D
Henderson, KY 42420
|
- sq. feet
|
- baths - beds |
show details | |

|
#37
S Main St Apt 169
Henderson, KY 42420
|
- sq. feet
|
- baths - beds |
show details | |

|
#38
Lakeview Dr Apt 12b
Henderson, KY 42420
|
- sq. feet
|
- baths - beds |
show details | |

|
#39
Cardinal Ln
Henderson, KY 42420
|
- sq. feet
|
- baths - beds |
show details | |

|
#40
Us Highway 41 N
Henderson, KY 42420
|
- sq. feet
|
- baths - beds |
show details |
| Photo | Address | Area | Beds / Baths | Price | Details |
|---|---|---|---|---|---|

|
#41
Old Madisonville Rd
Henderson, KY 42420
|
- sq. feet
|
- baths - beds |
show details | |

|
#42
Clay Cemetery Rd
Henderson, KY 42420
|
- sq. feet
|
- baths - beds |
show details | |

|
#43
Kennedy Cir
Henderson, KY 42420
|
980 sq. feet
|
- baths - beds |
show details | |

|
#44
S Adams St
Henderson, KY 42420
|
- sq. feet
|
- baths - beds |
show details | |

|
#45
Arbor Dr Apt 205
Henderson, KY 42420
|
- sq. feet
|
- baths - beds |
show details | |

|
#46
Barret Blvd
Henderson, KY 42420
|
- sq. feet
|
- baths - beds |
show details | |

|
#47
Kentucky 351
Henderson, KY 42420
|
- sq. feet
|
- baths - beds |
show details | |

|
#48
Oakcrest Dr
Henderson, KY 42420
|
- sq. feet
|
- baths - beds |
show details | |

|
#49
S Main St Apt 203
Henderson, KY 42420
|
- sq. feet
|
- baths - beds |
show details | |

|
Check over 1 million property listings on Foreclosure.com!
|
browse all offers | |||

Latest news about housing in Henderson, KY collected exclusively by city-data.com from local newspapers, TV, and radio stations

 | Any houses for rent in Henderson? (8 replies) |
| No homes to rent in Henderson? (9 replies) |
| Moving to Henderson Kentucky (7 replies) |
| Need current info on Owensboro KY please! (12 replies) |
| Place to retire in KY. Henderson? Covington? (12 replies) |
| Single woman retiring to Kentucky or Tennessee (15 replies) |
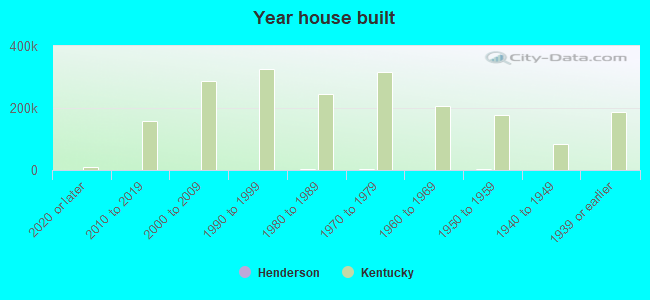
Median year apartment built: 1977
Household type by relationship:
Households: 28,224- Male householders: 5,672 (1,894 living alone), Female householders: 6,485 (2,597 living alone)
5,178 spouses (5,132 opposite-sex spouses), 611 unmarried partners, (604 opposite-sex unmarried partners), 7,199 children (6,720 natural, 137 adopted, 341 stepchildren), 681 grandchildren, 134 brothers or sisters, 129 parents, 0 foster children, 423 other relatives, 494 non-relatives
- In group quarters: 1,213
Size of family households: 3,637 2-persons, 1,747 3-persons, 1,323 4-persons, 453 5-persons, 130 6-persons, 46 7-or-more-persons.
Size of nonfamily households: 4,737 1-person, 443 2-persons, 45 3-persons, 18 4-persons.
2,933 married couples with children.
2,412 single-parent households (221 men, 2,191 women).
96.9% of residents of Henderson speak English at home.
2.2% of residents speak Spanish at home (54% speak English very well, 24% speak English well, 12% speak English not well, 10% don't speak English at all).
0.4% of residents speak other Indo-European language at home (70% speak English very well, 24% speak English well, 5% speak English not well).
0.4% of residents speak Asian or Pacific Island language at home (50% speak English very well, 50% speak English well).
0.1% of residents speak other language at home (26% speak English very well, 74% speak English well).
Foreign born population: 532 (1.9%)
(66.9% of them are naturalized citizens)
| Here: | 6.3 |
| State: | 6.4 |
| Here: | 4.2 |
| State: | 4.4 |
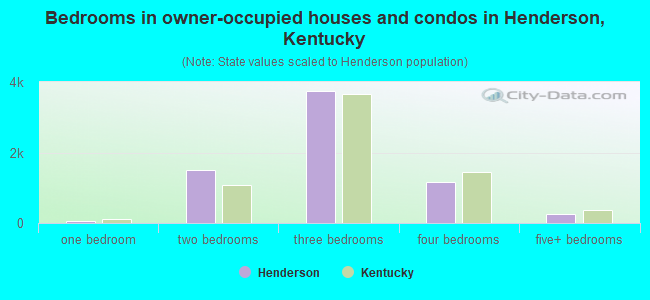
- Bedrooms in owner-occupied houses and condos in Henderson, Kentucky
- 0no bedroom
- 531 bedroom
- 1,4922 bedrooms
- 3,7433 bedrooms
- 1,1494 bedrooms
- 2575+ bedrooms
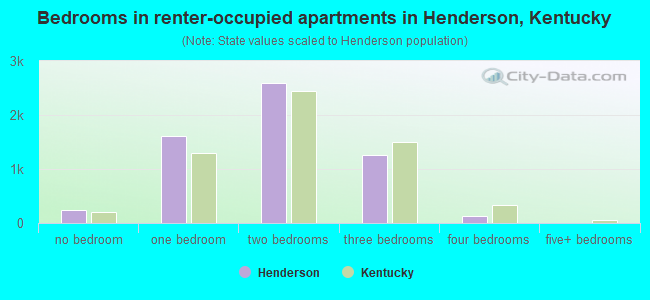
- Bedrooms in renter-occupied apartments in Henderson, Kentucky
- 238no bedroom
- 1,6201 bedroom
- 2,5892 bedrooms
- 1,2683 bedrooms
- 1324 bedrooms
- 05+ bedrooms
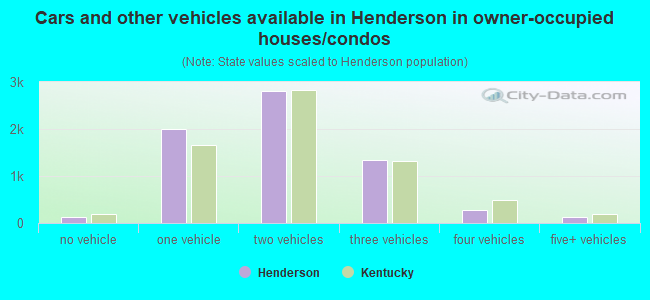
- Cars and other vehicles available in Henderson in owner-occupied houses/condos
- 136no vehicle
- 1,9961 vehicle
- 2,8162 vehicles
- 1,3423 vehicles
- 2784 vehicles
- 1265+ vehicles
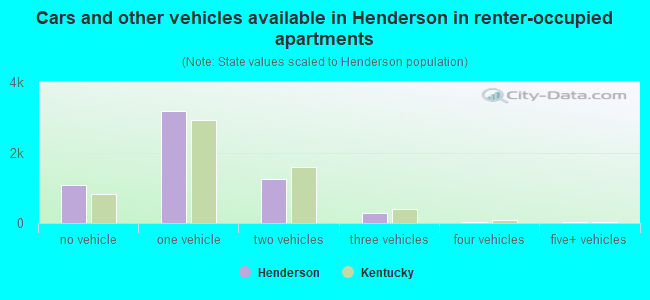
- Cars and other vehicles available in Henderson in renter-occupied apartments
- 1,082no vehicle
- 3,1801 vehicle
- 1,2492 vehicles
- 2793 vehicles
- 424 vehicles
- 165+ vehicles
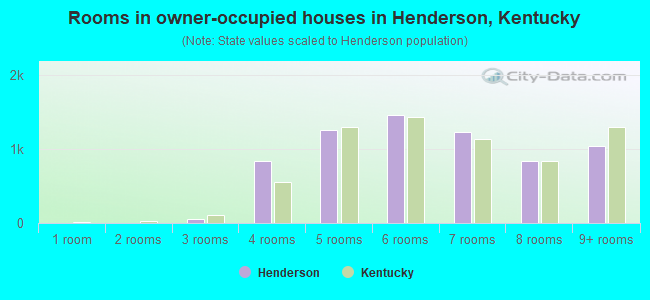
- Rooms in owner-occupied houses in Henderson, Kentucky
- 01 room
- 02 rooms
- 553 rooms
- 8364 rooms
- 1,2505 rooms
- 1,4576 rooms
- 1,2217 rooms
- 8388 rooms
- 1,0379+ rooms
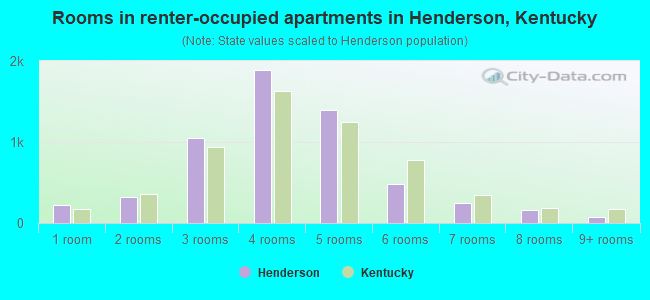
- Rooms in renter-occupied apartments in Henderson, Kentucky
- 2241 room
- 3172 rooms
- 1,0493 rooms
- 1,8944 rooms
- 1,3935 rooms
- 4786 rooms
- 2517 rooms
- 1628 rooms
- 799+ rooms
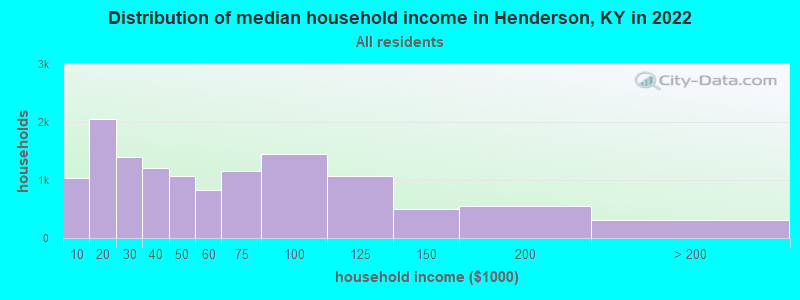
Henderson, KY household income distribution

- 1,028Less than $10,000
- 2,055$10,000 to $19,999
- 1,403$20,000 to $29,999
- 1,203$30,000 to $39,999
- 1,062$40,000 to $49,999
- 829$50,000 to $59,999
- 1,155$60,000 to $74,999
- 1,451$75,000 to $99,999
- 1,062$100,000 to $124,999
- 506$125,000 to $149,999
- 552$150,000 to $199,999
- 313$200,000 or more
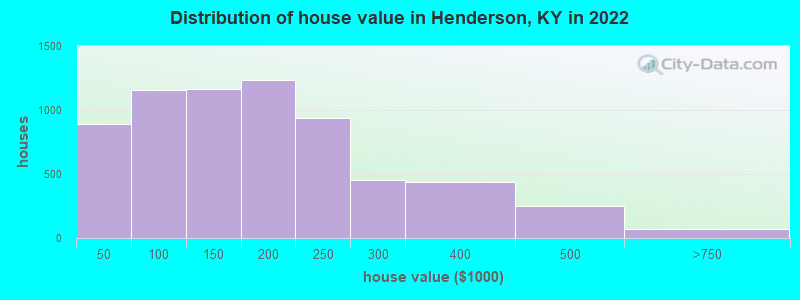
Home value of owner - occupied houses in 2022 in Henderson, KY
-
- 146Less than $10,000
- 72$10,000 to $14,999
- 343$15,000 to $19,999
- 85$20,000 to $24,999
- 88$30,000 to $34,999
- 13$35,000 to $39,999
- 142$40,000 to $49,999
- 130$50,000 to $59,999
- 220$60,000 to $69,999
- 152$70,000 to $79,999
- 264$80,000 to $89,999
- 249$90,000 to $99,999
- 691$100,000 to $124,999
- 469$125,000 to $149,999
- 791$150,000 to $174,999
- 439$175,000 to $199,999
- 939$200,000 to $249,999
- 451$250,000 to $299,999
- 437$300,000 to $399,999
- 248$400,000 to $499,999
- 62$500,000 to $749,999
- 4$750,000 to $999,999
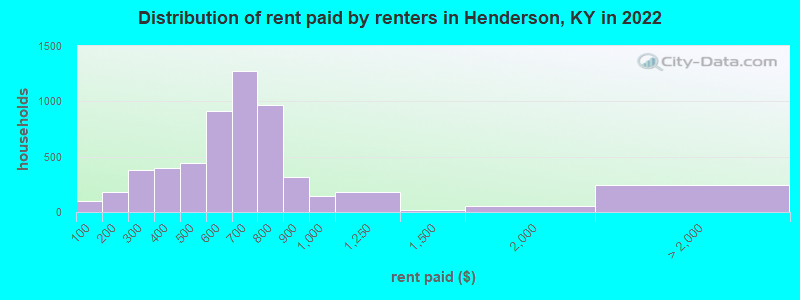
Rent paid by renters in 2022 in Henderson, KY
-
- 101Less than $100
- 182$150 to $199
- 75$200 to $249
- 305$250 to $299
- 248$300 to $349
- 150$350 to $399
- 222$400 to $449
- 223$450 to $499
- 499$500 to $549
- 410$550 to $599
- 687$600 to $649
- 582$650 to $699
- 661$700 to $749
- 304$750 to $799
- 314$800 to $899
- 142$900 to $999
- 181$1,000 to $1,249
- 22$1,250 to $1,499
- 57$1,500 to $1,999
- 14$2,000 to $2,499
- 228No cash rent
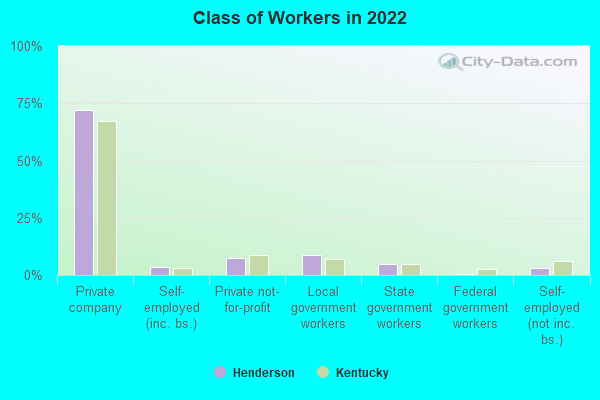
Percentage of workers working in this county: 67.5%
Number of people working at home: 754 (6.1% of all workers)
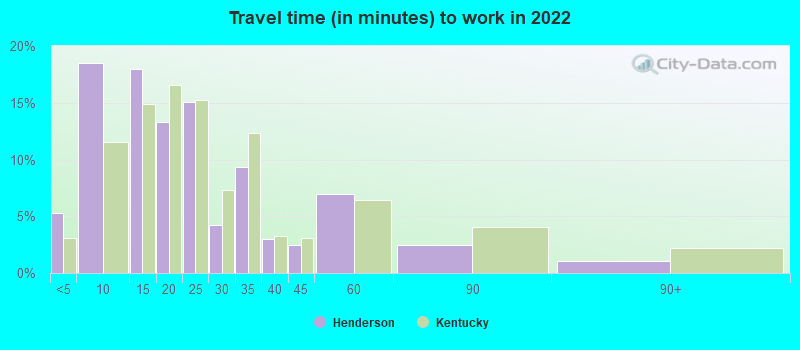
Travel time to work (commute)
- Less than 5 minutes: 469
- 5 to 9 minutes: 2,212
- 10 to 14 minutes: 2,268
- 15 to 19 minutes: 1,345
- 20 to 24 minutes: 1,780
- 25 to 29 minutes: 761
- 30 to 34 minutes: 992
- 35 to 39 minutes: 298
- 40 to 44 minutes: 223
- 45 to 59 minutes: 624
- 60 to 89 minutes: 229
- 90 or more minutes: 227
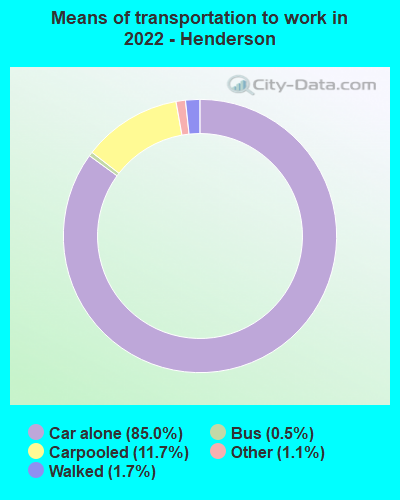
Means of transportation to work:
- Drove a car alone: 10,909 (78.6%)
- Carpooled: 1,649 (11.9%)
- Bus: 37 (0.3%)
- Taxi: 176 (1.3%)
- Walked: 223 (1.6%)
- Worked at home: 754 (5.4%)
- Unemployment by race in 2022
- Unemployment rate for White non-Hispanic residents
- 3.3%Males
- 2.2%Females
- Unemployment rate for Black residents
- 1.8%Males
- 1.3%Females
- Unemployment rate for Asian residents
- 14.8%Females
- Unemployment rate for other race residents
- 1.8%Males
- 1.4%Females
- Unemployment rate for two or more race residents
- 2.1%Females
- Unemployment rate for Hispanic or Latino residents
- 5.0%Females
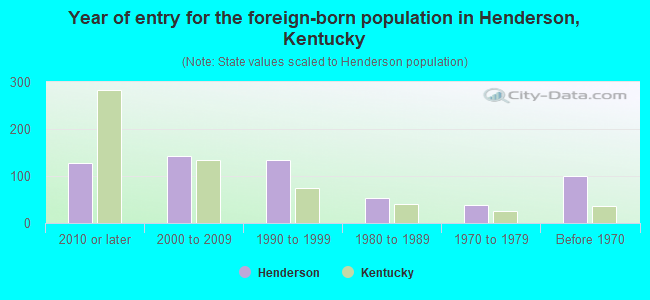
- Year of entry for the foreign-born population in Henderson, Kentucky
- 1272010 or later
- 1432000 to 2009
- 1331990 to 1999
- 531980 to 1989
- 391970 to 1979
- 101Before 1970
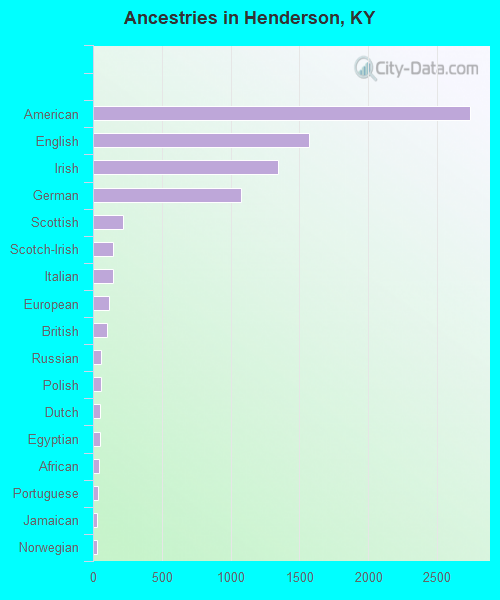
First ancestries reported:
- American: 2,742 (23.6%)
- English: 1,572 (13.5%)
- Irish: 1,347 (11.6%)
- German: 1,073 (9.2%)
- Scottish: 216 (1.9%)
- Scotch-Irish: 147 (1.3%)
- Italian: 146 (1.3%)
- European: 114 (1.0%)
- British: 102 (0.9%)
- Russian: 60 (0.5%)
- Polish: 56 (0.5%)
- Dutch: 52 (0.4%)
- Egyptian: 48 (0.4%)
- African: 45 (0.4%)
- Portuguese: 33 (0.3%)
- Jamaican: 32 (0.3%)
- Norwegian: 26 (0.2%)
- Lithuanian: 23 (0.2%)
- Danish: 20 (0.2%)
- Lebanese: 16 (0.1%)
- Welsh: 16 (0.1%)
- Swiss: 15 (0.1%)
- French: 13 (0.1%)
- French Canadian: 12 (0.1%)
- Northern European: 11 (0.09%)
- Pennsylvania German: 10 (0.09%)
- West Indian: 7 (0.06%)
- Scandinavian: 3 (0.03%)
Most common places of birth for foreign-born residents (%):
| Henderson: | 28.4% (157) |
| Kentucky: | 15.8% (29,070) |
| Henderson: | 13.6% (75) |
| Kentucky: | 4.2% (7,734) |
| Henderson: | 8.3% (46) |
| Kentucky: | 0.9% (1,604) |
| Henderson: | 7.2% (40) |
| Kentucky: | 0.4% (802) |
| Henderson: | 5.3% (29) |
| Kentucky: | 0.8% (1,437) |
| Henderson: | 5.3% (29) |
| Kentucky: | 2.5% (4,639) |
| Henderson: | 5.1% (28) |
| Kentucky: | 7.3% (13,454) |
| Henderson: | 4.9% (27) |
| Kentucky: | 8.0% (14,652) |
| Henderson: | 4.0% (22) |
| Kentucky: | 0.3% (488) |
| Henderson: | 3.8% (21) |
| Kentucky: | 0.2% (320) |
| Henderson: | 3.8% (21) |
| Kentucky: | 2.0% (3,654) |
| Henderson: | 2.4% (13) |
| Kentucky: | 3.3% (6,109) |
| Henderson: | 2.0% (11) |
| Kentucky: | 0.2% (387) |
| Henderson: | 2.0% (11) |
| Kentucky: | 2.3% (4,303) |
| Henderson: | 1.6% (9) |
| Kentucky: | 2.9% (5,302) |
Place of birth for U.S.-born residents:
- This state: 17,946
- Other state: 9,759
- Northeast: 523
- Midwest: 6,525
- South: 1,939
- West: 712
86.8% of Henderson residents lived in the same house 1 years ago.
Out of people who lived in different houses, 39.0% lived in this county.
Out of people who lived in different counties, 57.9% lived in Kentucky.
| Henderson: | 86.8% |
| State average: | 87.2% |
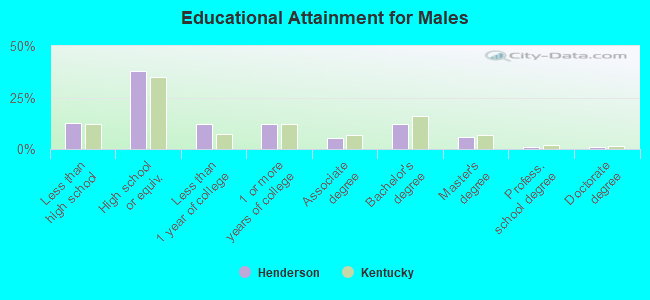
Education attainment for males 25 years and older:
- No schooling: 164
- Nursery to 4th grade: 21
- 5th and 6th grade: 63
- 7th and 8th grade: 159
- 9th grade: 71
- 10th grade: 220
- 11th grade: 243
- 12th grade, no diploma: 225
- High school graduate (or equivalency): 3,443
- Less than 1 year of college: 1,106
- Some college more than 1 year, no degree: 1,121
- Associate degree: 493
- Bachelor's degree: 1,124
- Master's degree: 528
- Professional school degree: 68
- Doctorate degree: 69
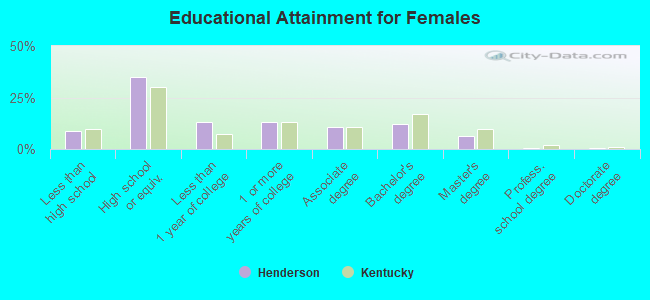
Education attainment for females 25 years and older:
- No schooling: 93
- Nursery to 4th grade: 15
- 5th and 6th grade: 25
- 7th and 8th grade: 208
- 9th grade: 217
- 10th grade: 135
- 11th grade: 183
- 12th grade, no diploma: 43
- High school graduate (or equivalency): 3,759
- Less than 1 year of college: 1,396
- Some college more than 1 year, no degree: 1,407
- Associate degree: 1,157
- Bachelor's degree: 1,298
- Master's degree: 681
- Professional school degree: 48
- Doctorate degree: 57
Housing units in structures:
- One, detached: 7,981
- One, attached: 300
- Two: 860
- 3 or 4: 1,070
- 5 to 9: 863
- 10 to 19: 602
- 20 to 49: 414
- 50 or more: 591
- Mobile homes: 977
Median worth of mobile homes: $19,219
Housing units lacking complete kitchen facilities in 2022: 3.0%
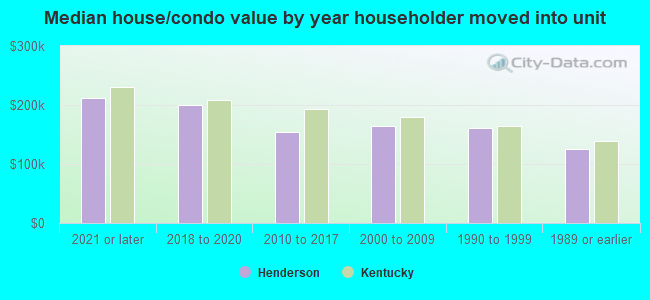
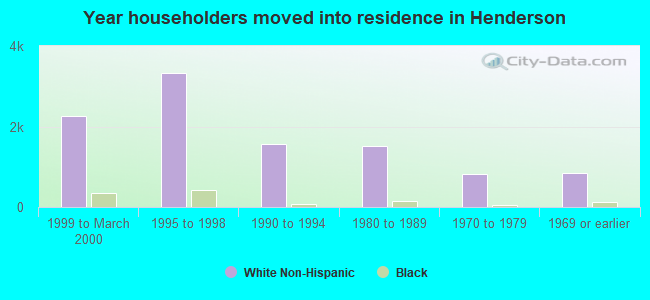
House/condo owner moved in on average 12 years ago
Renter moved in on average 4 years ago
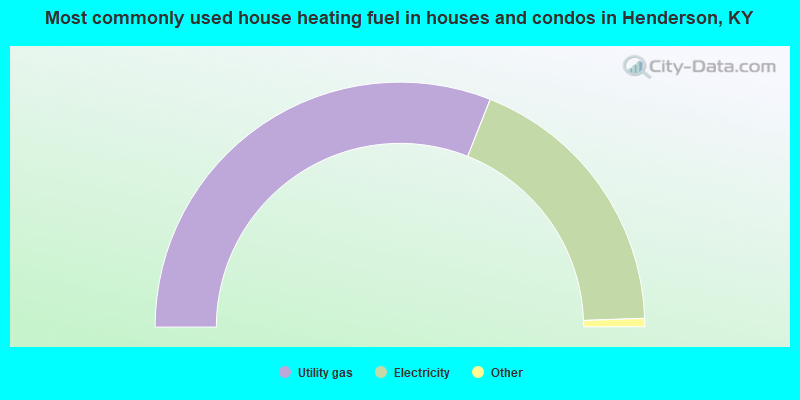
- 62.1%Utility gas
- 36.9%Electricity
- 0.6%Wood
- 0.5%Bottled, tank, or LP gas
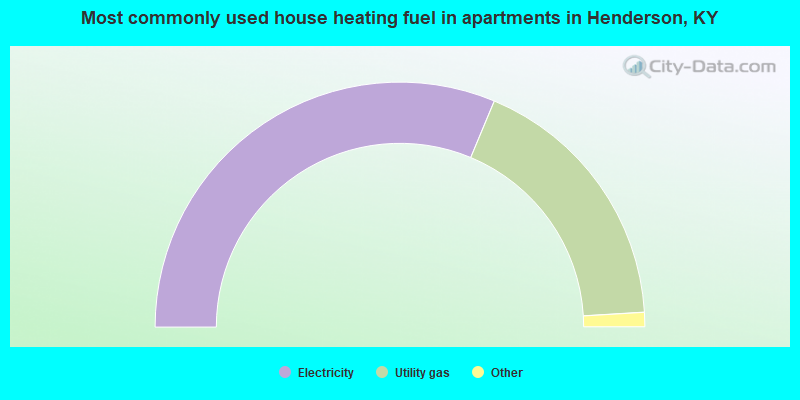
- 62.6%Electricity
- 35.5%Utility gas
- 1.0%Bottled, tank, or LP gas
- 0.3%Fuel oil, kerosene, etc.
- 0.2%No fuel used
- 0.2%Wood
- 0.1%Other fuel
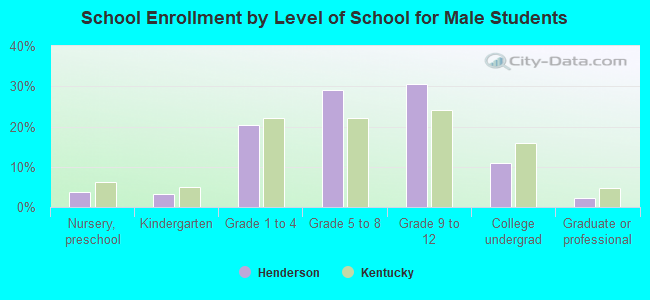
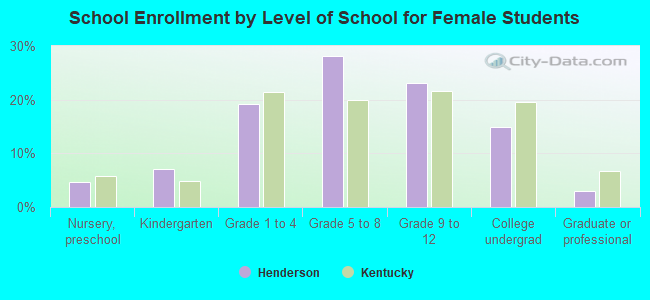
Private vs. public school enrollment:
| Here: | 18.2% |
| Kentucky: | 17.2% |
| Here: | 4.5% |
| Kentucky: | 15.2% |
| Here: | 3.4% |
| Kentucky: | 19.6% |