Herndon, VA (Virginia) Houses and Residents
| Herndon: | $546,574 |
| Virginia: | $365,700 |
Mean price in 2022:
Detached houses: $806,826
Here: $806,826 State: $472,865 Townhouses or other attached units: $512,890
Here: $512,890 State: $457,437 In 5-or-more-unit structures: $322,570
Here: $322,570 State: $382,551
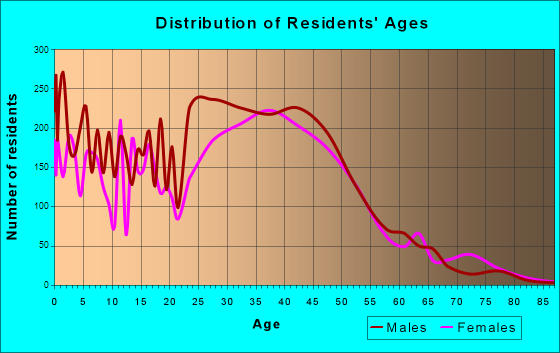
Total population: 24,554 (Urban population: 21,662, Rural population: 0)
Houses: 8,251 (7,949 occupied: 5,163 owner occupied, 2,830 renter occupied)
| % of renters here: | 35% |
| State: | 33% |
Housing density: 1,955 houses/condos per square mile
Median price asked for vacant for-sale houses and condos in 2022 in this county: $1,038,941.
Median contract rent in 2022: $1,828 (lower quartile is $1,560, upper quartile is over $2,000)
Median rent asked for vacant for-rent units in 2022: $2,335
Median gross rent in Herndon, VA in 2022: $1,981
Housing units in Herndon with a mortgage: 3,917 (443 second mortgage, 87 home equity loan, 272 both second mortgage and home equity loan)
Houses without a mortgage: 34
Median household income for houses/condos with a mortgage: $193,200
Median household income for apartments without a mortgage: $109,441
Median monthly housing costs: $2,131
Compare current foreclosures in Herndon, VA:
| Photo | Address | Area | Beds / Baths | Price | Details |
|---|---|---|---|---|---|

|
#1
Schwenger Pl
Herndon, VA 20170
|
1,530 sq. feet
|
2 baths 3 beds |
show details | |

|
#2
Park Ave
Herndon, VA 20170
|
1,400 sq. feet
|
2 baths 3 beds |
show details | |

|
#3
Aspen Dr
Herndon, VA 20170
|
1,249 sq. feet
|
2 baths 3 beds |
show details | |

|
#4
Horsepen Woods Ct
Herndon, VA 20171
|
1,152 sq. feet
|
2 baths 3 beds |
show details | |

|
#5
Lisa Ct
Herndon, VA 20170
|
1,344 sq. feet
|
3 baths 3 beds |
show details | |

|
#6
Autumn Hill Ct
Herndon, VA 20171
|
1,968 sq. feet
|
2 baths 4 beds |
show details | |

|
#7
Clearwater Ct
Herndon, VA 20170
|
1,360 sq. feet
|
1 baths 3 beds |
show details | |

|
#8
Center St Apt 103
Herndon, VA 20170
|
1,246 sq. feet
|
1 baths 2 beds |
show details | |

|
#9
Equus Ct
Herndon, VA 20171
|
2,280 sq. feet
|
3 baths 3 beds |
show details | |

|
#10
Oram Pl
Herndon, VA 20170
|
1,304 sq. feet
|
2 baths 3 beds |
show details |
| Photo | Address | Area | Beds / Baths | Price | Details |
|---|---|---|---|---|---|

|
#11
Highland Mews Pl
Herndon, VA 20171
|
1,260 sq. feet
|
3 baths 3 beds |
show details | |

|
#12
Marcey Creek Rd
Herndon, VA 20171
|
1,485 sq. feet
|
2 baths 3 beds |
show details | |

|
#13
Browns Mill Ct
Herndon, VA 20170
|
2,881 sq. feet
|
3 baths 5 beds |
show details | |

|
#14
Cabin Creek Rd
Herndon, VA 20171
|
1,239 sq. feet
|
2 baths 2 beds |
show details | |

|
#15
Park Crescent Cir
Herndon, VA 20171
|
2,148 sq. feet
|
3 baths 3 beds |
show details | |

|
#16
James Monroe Cir
Herndon, VA 20171
|
1,872 sq. feet
|
2 baths 3 beds |
show details | |

|
#17
Sunrise Ct
Herndon, VA 20170
|
1,137 sq. feet
|
3 baths 5 beds |
show details | |

|
#18
Sugarloaf Ct
Herndon, VA 20170
|
1,860 sq. feet
|
2 baths 4 beds |
show details | |

|
#19
Old Silo Ct
Herndon, VA 20171
|
1,804 sq. feet
|
3 baths 3 beds |
show details | |

|
#20
Willow Glen Dr
Herndon, VA 20171
|
4,321 sq. feet
|
4 baths 5 beds |
show details |
| Photo | Address | Area | Beds / Baths | Price | Details |
|---|---|---|---|---|---|

|
#21
Iron Forge Rd
Herndon, VA 20171
|
3,673 sq. feet
|
3 baths 4 beds |
show details | |

|
#22
Maple Ct
Herndon, VA 20170
|
1,408 sq. feet
|
2 baths 3 beds |
show details | |

|
#23
Kingsvale Cir
Herndon, VA 20170
|
1,338 sq. feet
|
3 baths 2 beds |
show details | |

|
#24
Maple Ct
Herndon, VA 20170
|
1,408 sq. feet
|
2 baths 3 beds |
show details | |

|
#25
Florida Ave Apt 103
Herndon, VA 20170
|
1,048 sq. feet
|
1 baths 1 beds |
show details | |

|
#26
Farmcrest Dr
Herndon, VA 20171
|
- sq. feet
|
- baths - beds |
show details | |

|
#27
Birch Run Cir
Herndon, VA 20171
|
- sq. feet
|
- baths - beds |
show details | |

|
#28
Hattontown Sq
Herndon, VA 20171
|
- sq. feet
|
- baths - beds |
show details | |

|
#29
Grace St Apt 103
Herndon, VA 20170
|
- sq. feet
|
- baths - beds |
show details | |

|
#30
Astoria Cir Apt 207
Herndon, VA 20170
|
- sq. feet
|
- baths - beds |
show details |
| Photo | Address | Area | Beds / Baths | Price | Details |
|---|---|---|---|---|---|

|
#31
Masons Ferry Dr Apt 202
Herndon, VA 20171
|
- sq. feet
|
- baths - beds |
show details | |

|
#32
Keisler Ct
Herndon, VA 20170
|
- sq. feet
|
- baths - beds |
show details | |

|
#33
Atlantis St, Apt 433
Herndon, VA 20171
|
- sq. feet
|
- baths - beds |
show details | |

|
#34
Woodland Grove Pl, Apt 165
Herndon, VA 20171
|
- sq. feet
|
- baths - beds |
show details | |

|
#35
Astoria Cir Apt 106
Herndon, VA 20170
|
- sq. feet
|
- baths - beds |
show details | |

|
#36
Coppermine Rd # 513
Herndon, VA 20171
|
- sq. feet
|
- baths - beds |
show details | |

|
#37
Astoria Cir Apt 308
Herndon, VA 20170
|
- sq. feet
|
- baths - beds |
show details | |

|
#38
Herndon Pkwy
Herndon, VA 20170
|
- sq. feet
|
- baths - beds |
show details | |

|
#39
Legacy Cir Apt J
Herndon, VA 20171
|
- sq. feet
|
- baths - beds |
show details | |

|
#40
Wasser Ter Apt 102
Herndon, VA 20171
|
- sq. feet
|
- baths - beds |
show details |
| Photo | Address | Area | Beds / Baths | Price | Details |
|---|---|---|---|---|---|

|
#41
Fox Hunt Ln Apt 402
Herndon, VA 20171
|
- sq. feet
|
- baths - beds |
show details | |

|
#42
Dulles Station Blvd Apt 250
Herndon, VA 20171
|
- sq. feet
|
- baths - beds |
show details | |

|
#43
Rolling Fork Cir Apt 204
Herndon, VA 20171
|
- sq. feet
|
- baths - beds |
show details | |

|
#44
Pine St
Herndon, VA 20170
|
- sq. feet
|
- baths - beds |
show details | |

|
#45
Farmcrest Ct Apt 726
Herndon, VA 20171
|
- sq. feet
|
- baths - beds |
show details | |

|
#46
Arnsley Ct
Herndon, VA 20171
|
- sq. feet
|
- baths - beds |
show details | |

|
#47
Woodland Crossing Dr Apt 112
Herndon, VA 20171
|
- sq. feet
|
- baths - beds |
show details | |

|
#48
Elden St Ste 224
Herndon, VA 20170
|
- sq. feet
|
- baths - beds |
show details | |

|
#49
Woodland Park Rd # 464
Herndon, VA 20171
|
- sq. feet
|
- baths - beds |
show details | |

|
Check over 1 million property listings on Foreclosure.com!
|
browse all offers | |||

Latest news about housing in Herndon, VA collected exclusively by city-data.com from local newspapers, TV, and radio stations


Median year apartment built: 1985
Household type by relationship:
Households: 24,306- Male householders: 5,172 (910 living alone), Female householders: 2,676 (602 living alone)
4,435 spouses (4,408 opposite-sex spouses), 513 unmarried partners, (503 opposite-sex unmarried partners), 7,081 children (6,786 natural, 88 adopted, 206 stepchildren), 354 grandchildren, 593 brothers or sisters, 674 parents, 0 foster children, 1,129 other relatives, 1,660 non-relatives
- In group quarters: 13
Size of family households: 2,016 2-persons, 1,114 3-persons, 1,212 4-persons, 699 5-persons, 346 6-persons, 303 7-or-more-persons.
Size of nonfamily households: 1,560 1-person, 586 2-persons, 129 3-persons, 28 4-persons.
3,808 married couples with children.
1,101 single-parent households (313 men, 788 women).
46.9% of residents of Herndon speak English at home.
31.7% of residents speak Spanish at home (38% speak English very well, 26% speak English well, 25% speak English not well, 12% don't speak English at all).
9.9% of residents speak other Indo-European language at home (60% speak English very well, 34% speak English well, 5% speak English not well, 1% don't speak English at all).
7.9% of residents speak Asian or Pacific Island language at home (62% speak English very well, 20% speak English well, 16% speak English not well, 3% don't speak English at all).
3.8% of residents speak other language at home (79% speak English very well, 14% speak English well, 5% speak English not well, 2% don't speak English at all).
Foreign born population: 10,188 (41.9%)
(47.0% of them are naturalized citizens)
| Here: | 7.3 |
| State: | 7.0 |
| Here: | 4.4 |
| State: | 4.3 |

- Bedrooms in owner-occupied houses and condos in Herndon, Virginia
- 0no bedroom
- 1031 bedroom
- 5602 bedrooms
- 1,7903 bedrooms
- 1,7904 bedrooms
- 9215+ bedrooms

- Bedrooms in renter-occupied apartments in Herndon, Virginia
- 167no bedroom
- 6071 bedroom
- 1,0802 bedrooms
- 6353 bedrooms
- 1944 bedrooms
- 1475+ bedrooms

- Cars and other vehicles available in Herndon in owner-occupied houses/condos
- 144no vehicle
- 1,0691 vehicle
- 2,5602 vehicles
- 8793 vehicles
- 2864 vehicles
- 2265+ vehicles

- Cars and other vehicles available in Herndon in renter-occupied apartments
- 227no vehicle
- 1,1971 vehicle
- 1,0122 vehicles
- 2523 vehicles
- 1424 vehicles
- 05+ vehicles

- Rooms in owner-occupied houses in Herndon, Virginia
- 01 room
- 442 rooms
- 1703 rooms
- 3504 rooms
- 6365 rooms
- 8396 rooms
- 6857 rooms
- 4628 rooms
- 1,9789+ rooms

- Rooms in renter-occupied apartments in Herndon, Virginia
- 1261 room
- 1212 rooms
- 4963 rooms
- 7824 rooms
- 5615 rooms
- 2926 rooms
- 2467 rooms
- 648 rooms
- 1439+ rooms


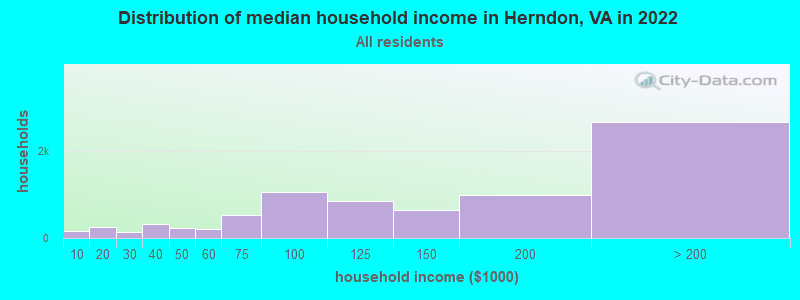
Herndon, VA household income distribution

- 153Less than $10,000
- 245$10,000 to $19,999
- 142$20,000 to $29,999
- 319$30,000 to $39,999
- 229$40,000 to $49,999
- 198$50,000 to $59,999
- 533$60,000 to $74,999
- 1,059$75,000 to $99,999
- 855$100,000 to $124,999
- 643$125,000 to $149,999
- 993$150,000 to $199,999
- 2,654$200,000 or more
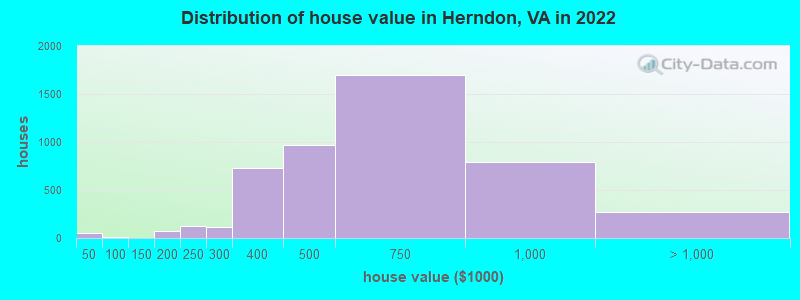
Home value of owner - occupied houses in 2022 in Herndon, VA
-
- 56Less than $10,000
- 12$50,000 to $59,999
- 11$150,000 to $174,999
- 66$175,000 to $199,999
- 127$200,000 to $249,999
- 109$250,000 to $299,999
- 725$300,000 to $399,999
- 965$400,000 to $499,999
- 1,692$500,000 to $749,999
- 793$750,000 to $999,999
- 232$1,000,000 to $1,499,999
- 42$2,000,000 or more
Rent paid by renters in 2022 in Herndon, VA
-
- 15$200 to $249
- 11$350 to $399
- 3$400 to $449
- 15$500 to $549
- 16$550 to $599
- 9$800 to $899
- 41$900 to $999
- 192$1,000 to $1,249
- 232$1,250 to $1,499
- 1,304$1,500 to $1,999
- 578$2,000 to $2,499
- 306$2,500 to $2,999
- 116$3,000 to $3,499
- 56No cash rent


Percentage of workers working in this county: 71.9%
Number of people working at home: 3,296 (22.5% of all workers)
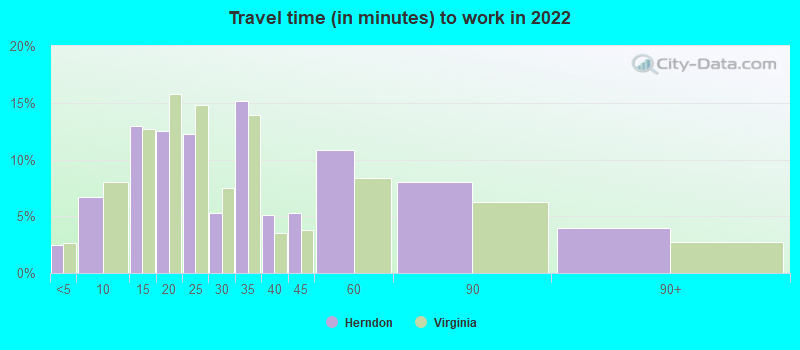
Travel time to work (commute)
- Less than 5 minutes: 462
- 5 to 9 minutes: 720
- 10 to 14 minutes: 1,604
- 15 to 19 minutes: 2,353
- 20 to 24 minutes: 1,668
- 25 to 29 minutes: 794
- 30 to 34 minutes: 1,723
- 35 to 39 minutes: 386
- 40 to 44 minutes: 307
- 45 to 59 minutes: 637
- 60 to 89 minutes: 787
- 90 or more minutes: 53
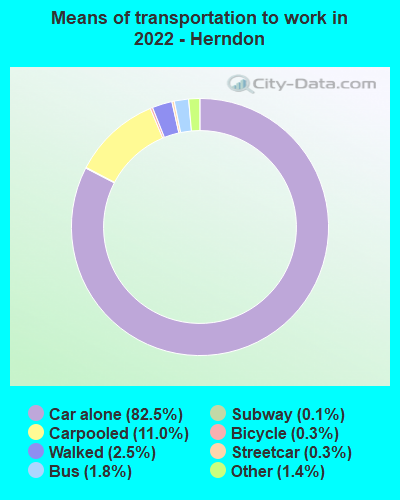
Means of transportation to work:
- Drove a car alone: 14,872 (67.5%)
- Carpooled: 2,044 (9.3%)
- Bus: 225 (1.0%)
- Subway or elevated rail: 51 (0.2%)
- Long-distance train or commuter rail: 14 (0.1%)
- Taxi: 335 (1.5%)
- Bicycle: 33 (0.1%)
- Walked: 514 (2.3%)
- Worked at home: 3,296 (15.0%)

- Unemployment by race in 2022
- Unemployment rate for White non-Hispanic residents
- 1.4%Males
- 1.8%Females
- Unemployment rate for Black residents
- 0.3%Males
- 2.6%Females
- Unemployment rate for Asian residents
- 0.5%Males
- 1.6%Females
- Unemployment rate for other race residents
- 2.3%Males
- 4.0%Females
- Unemployment rate for two or more race residents
- 2.3%Males
- 6.5%Females
- Unemployment rate for Hispanic or Latino residents
- 1.7%Males
- 4.6%Females

- Year of entry for the foreign-born population in Herndon, Virginia
- 4,4592010 or later
- 2,4442000 to 2009
- 1,6141990 to 1999
- 2,2471980 to 1989
- 5631970 to 1979
- 249Before 1970

First ancestries reported:
- Irish: 604 (3.9%)
- American: 467 (3.1%)
- German: 458 (3.0%)
- English: 401 (2.6%)
- Italian: 239 (1.6%)
- European: 230 (1.5%)
- Armenian: 161 (1.1%)
- Ethiopian: 157 (1.0%)
- Polish: 126 (0.8%)
- Russian: 110 (0.7%)
- French Canadian: 110 (0.7%)
- Romanian: 93 (0.6%)
- Swedish: 91 (0.6%)
- Sudanese: 91 (0.6%)
- Afghan: 83 (0.5%)
- African: 65 (0.4%)
- Nigerian: 62 (0.4%)
- Eastern European: 57 (0.4%)
- Scotch-Irish: 53 (0.3%)
- British: 51 (0.3%)
- Egyptian: 42 (0.3%)
- Yugoslavian: 42 (0.3%)
- Dutch: 41 (0.3%)
- Jamaican: 41 (0.3%)
- Syrian: 38 (0.2%)
- Danish: 38 (0.2%)
- Iranian: 33 (0.2%)
- British West Indian: 33 (0.2%)
- Trinidadian and Tobagonian: 25 (0.2%)
- Ukrainian: 25 (0.2%)
- Lebanese: 22 (0.1%)
- Iraqi: 21 (0.1%)
- Northern European: 19 (0.1%)
- Greek: 19 (0.1%)
- Hungarian: 14 (0.09%)
- Arab: 14 (0.09%)
- Barbadian: 14 (0.09%)
- French: 12 (0.08%)
- Belgian: 9 (0.06%)
- Lithuanian: 9 (0.06%)
- Slovak: 9 (0.06%)
- Slovene: 9 (0.06%)
- Israeli: 8 (0.05%)
- Norwegian: 7 (0.05%)
- Scottish: 7 (0.05%)
- Turkish: 7 (0.05%)
- Welsh: 6 (0.04%)
- Czech: 5 (0.03%)
- Brazilian: 4 (0.03%)
- Bulgarian: 3 (0.02%)
Most common places of birth for foreign-born residents (%):
| Herndon: | 23.9% (2,430) |
| Virginia: | 9.9% (107,534) |
| Herndon: | 10.3% (1,053) |
| Virginia: | 3.0% (32,892) |
| Herndon: | 8.5% (866) |
| Virginia: | 9.0% (97,830) |
| Herndon: | 5.7% (577) |
| Virginia: | 0.9% (9,695) |
| Herndon: | 5.5% (564) |
| Virginia: | 2.4% (26,366) |
| Herndon: | 3.2% (322) |
| Virginia: | 2.9% (32,082) |
| Herndon: | 2.9% (298) |
| Virginia: | 4.2% (45,750) |
| Herndon: | 2.8% (288) |
| Virginia: | 3.9% (42,989) |
| Herndon: | 2.6% (269) |
| Virginia: | 3.3% (35,938) |
| Herndon: | 2.4% (247) |
| Virginia: | 5.3% (57,498) |
| Herndon: | 2.2% (222) |
| Virginia: | 4.8% (52,629) |
| Herndon: | 2.0% (199) |
| Virginia: | 2.4% (25,722) |
| Herndon: | 2.0% (199) |
| Virginia: | 0.2% (1,776) |
| Herndon: | 1.7% (171) |
| Virginia: | 2.3% (24,582) |
Place of birth for U.S.-born residents:
- This state: 7,047
- Other state: 6,488
- Northeast: 2,094
- Midwest: 1,461
- South: 2,038
- West: 890
83.1% of Herndon residents lived in the same house 1 years ago.
Out of people who lived in different houses, 39.0% lived in this county.
Out of people who lived in different counties, 50.2% lived in Virginia.
| Herndon: | 83.1% |
| State average: | 86.6% |
Education attainment for males 25 years and older:
- No schooling: 375
- Nursery to 4th grade: 245
- 5th and 6th grade: 278
- 7th and 8th grade: 67
- 9th grade: 142
- 10th grade: 80
- 11th grade: 139
- 12th grade, no diploma: 23
- High school graduate (or equivalency): 1,357
- Less than 1 year of college: 219
- Some college more than 1 year, no degree: 766
- Associate degree: 421
- Bachelor's degree: 2,750
- Master's degree: 1,600
- Professional school degree: 160
- Doctorate degree: 162

Education attainment for females 25 years and older:
- No schooling: 185
- Nursery to 4th grade: 35
- 5th and 6th grade: 393
- 7th and 8th grade: 27
- 9th grade: 187
- 10th grade: 32
- 11th grade: 83
- 12th grade, no diploma: 106
- High school graduate (or equivalency): 1,099
- Less than 1 year of college: 307
- Some college more than 1 year, no degree: 600
- Associate degree: 391
- Bachelor's degree: 2,440
- Master's degree: 1,464
- Professional school degree: 82
- Doctorate degree: 43

Housing units in structures:
- One, detached: 3,438
- One, attached: 2,307
- Two: 83
- 3 or 4: 110
- 5 to 9: 446
- 10 to 19: 984
- 20 to 49: 568
- 50 or more: 311
Housing units lacking complete kitchen facilities in 2022: 0.5%
House/condo owner moved in on average 9 years ago
Renter moved in on average 4 years ago

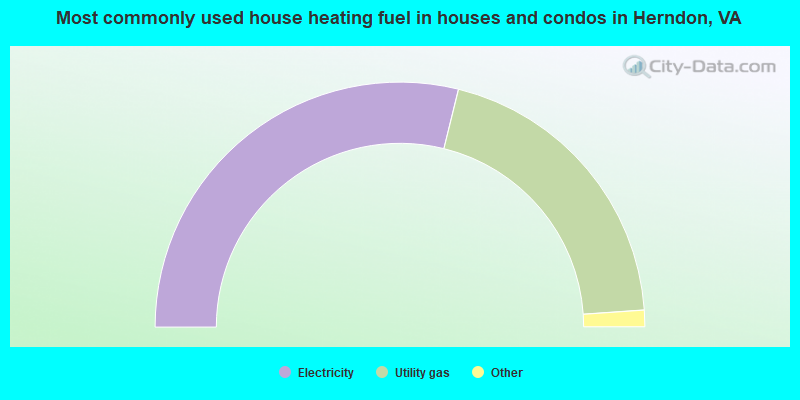
- 57.7%Electricity
- 40.1%Utility gas
- 1.2%Bottled, tank, or LP gas
- 0.6%Solar energy
- 0.3%No fuel used
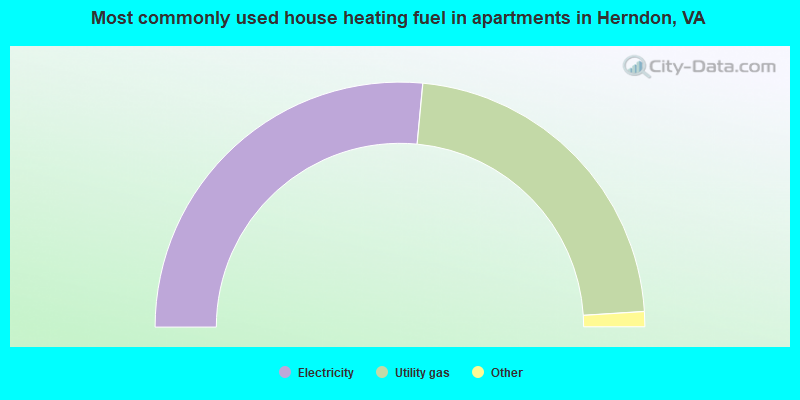
- 53.0%Electricity
- 45.0%Utility gas
- 1.7%No fuel used
- 0.3%Bottled, tank, or LP gas
Private vs. public school enrollment:
| Here: | 14.1% |
| Virginia: | 13.2% |
| Here: | 2.2% |
| Virginia: | 10.2% |
| Here: | 26.1% |
| Virginia: | 18.7% |


