Hope Mills, NC (North Carolina) Houses and Residents
| Hope Mills: | $184,052 |
| North Carolina: | $280,600 |
Mean price in 2022:
Detached houses: $214,657
Here: $214,657 State: $375,326 Townhouses or other attached units: $125,986
Here: $125,986 State: $317,935 In 2-unit structures: $59,891
Here: $59,891 State: $250,488 Mobile homes: $103,964
Here: $103,964 State: $124,933
Total population: 16,301 (Urban population: 11,357, Rural population: 0)
Houses: 6,791 (6,278 occupied: 4,101 owner occupied, 2,410 renter occupied)
| % of renters here: | 37% |
| State: | 33% |
Housing density: 1,115 houses/condos per square mile
Median price asked for vacant for-sale houses and condos in 2022: $85,766.
Median contract rent in 2022: $876 (lower quartile is $671, upper quartile is $1,107)
Median rent asked for vacant for-rent units in 2022: $688
Median gross rent in Hope Mills, NC in 2022: $1,097
Housing units in Hope Mills with a mortgage: 3,294 (216 second mortgage, 0 home equity loan, 210 both second mortgage and home equity loan)
Houses without a mortgage: 97
Median household income for houses/condos with a mortgage: $71,811
Median household income for apartments without a mortgage: $70,005
Median monthly housing costs: $1,098
Compare current foreclosures in Hope Mills, NC:
| Photo | Address | Area | Beds / Baths | Price | Details |
|---|---|---|---|---|---|

|
#1
Franklin St
Hope Mills, NC 28348
|
- sq. feet
|
2 baths 3 beds |
$109,200
|
show details |

|
#2
Hedingham Dr
Hope Mills, NC 28348
|
1,566 sq. feet
|
2 baths 4 beds |
show details | |

|
#3
Peacock St
Hope Mills, NC 28348
|
1,354 sq. feet
|
2 baths 3 beds |
show details | |

|
#4
Oak Haven Rd
Hope Mills, NC 28348
|
1,104 sq. feet
|
1 baths 3 beds |
show details | |

|
#5
Old Oak Ln
Hope Mills, NC 28348
|
1,189 sq. feet
|
2 baths 3 beds |
show details | |

|
#6
Elite Ct
Hope Mills, NC 28348
|
1,863 sq. feet
|
2 baths 3 beds |
show details | |

|
#7
Palmerland Dr
Hope Mills, NC 28348
|
1,092 sq. feet
|
1 baths 3 beds |
show details | |

|
#8
Woolard Dr
Hope Mills, NC 28348
|
1,440 sq. feet
|
2 baths 3 beds |
show details | |

|
#9
Pringle Way
Hope Mills, NC 28348
|
1,976 sq. feet
|
3 baths 4 beds |
show details | |

|
#10
Blue Sky Ln
Hope Mills, NC 28348
|
2,188 sq. feet
|
3 baths 4 beds |
show details |
| Photo | Address | Area | Beds / Baths | Price | Details |
|---|---|---|---|---|---|

|
#11
Fairway Dr
Hope Mills, NC 28348
|
1,694 sq. feet
|
2 baths 3 beds |
show details | |

|
#12
Walking Trail Way
Hope Mills, NC 28348
|
1,831 sq. feet
|
2 baths 4 beds |
show details | |

|
#13
Gaithersburg Ln
Hope Mills, NC 28348
|
2,316 sq. feet
|
2 baths 3 beds |
show details | |

|
#14
Ballentine St
Hope Mills, NC 28348
|
1,368 sq. feet
|
2 baths 3 beds |
show details | |

|
#15
Virsalli Loop
Hope Mills, NC 28348
|
2,236 sq. feet
|
3 baths 4 beds |
show details | |

|
#16
Odom Rd
Hope Mills, NC 28348
|
2,072 sq. feet
|
2 baths 3 beds |
show details | |

|
#17
Kirk Shaw Rd
Hope Mills, NC 28348
|
1,140 sq. feet
|
1 baths 2 beds |
show details | |

|
#18
Jefferson St
Hope Mills, NC 28348
|
1,380 sq. feet
|
1 baths 3 beds |
show details | |

|
#19
Gilcrest Sands Dr
Hope Mills, NC 28348
|
1,248 sq. feet
|
2 baths 3 beds |
show details | |

|
#20
Axis Cir
Hope Mills, NC 28348
|
1,433 sq. feet
|
2 baths 3 beds |
show details |
| Photo | Address | Area | Beds / Baths | Price | Details |
|---|---|---|---|---|---|

|
#21
Winesap Rd
Hope Mills, NC 28348
|
1,244 sq. feet
|
2 baths 3 beds |
show details | |

|
#22
Earp Ct
Hope Mills, NC 28348
|
2,052 sq. feet
|
2 baths 4 beds |
show details | |

|
#23
Spreading Branch Rd
Hope Mills, NC 28348
|
2,310 sq. feet
|
1 baths 3 beds |
show details | |

|
#24
Jefferson Walk Rd
Hope Mills, NC 28348
|
1,620 sq. feet
|
2 baths 3 beds |
show details | |

|
#25
Foxwood Dr
Hope Mills, NC 28348
|
2,448 sq. feet
|
3 baths 3 beds |
show details | |

|
#26
Applegate Rd
Hope Mills, NC 28348
|
1,104 sq. feet
|
2 baths 3 beds |
show details | |

|
#27
Acmar Cir
Hope Mills, NC 28348
|
1,200 sq. feet
|
1 baths 3 beds |
show details | |

|
#28
Fairhaven Trl
Hope Mills, NC 28348
|
1,612 sq. feet
|
2 baths 5 beds |
show details | |

|
#29
Marcliff Rd
Hope Mills, NC 28348
|
1,056 sq. feet
|
1 baths 3 beds |
show details | |

|
#30
Celestial Pine Dr
Hope Mills, NC 28348
|
1,560 sq. feet
|
2 baths 3 beds |
show details |
| Photo | Address | Area | Beds / Baths | Price | Details |
|---|---|---|---|---|---|

|
#31
Tasha Dr
Hope Mills, NC 28348
|
2,760 sq. feet
|
2 baths 5 beds |
show details | |

|
#32
Finish Line Dr
Hope Mills, NC 28348
|
2,074 sq. feet
|
2 baths 3 beds |
show details | |

|
#33
Jefferson Walk Rd
Hope Mills, NC 28348
|
1,976 sq. feet
|
2 baths 4 beds |
show details | |

|
#34
Coalport Rd
Hope Mills, NC 28348
|
1,166 sq. feet
|
2 baths 3 beds |
show details | |

|
#35
Forest Lake Dr
Hope Mills, NC 28348
|
1,094 sq. feet
|
1 baths 3 beds |
show details | |

|
#36
Pringle Way
Hope Mills, NC 28348
|
1,961 sq. feet
|
2 baths 4 beds |
show details | |

|
#37
Haskell Dr
Hope Mills, NC 28348
|
1,659 sq. feet
|
2 baths 3 beds |
show details | |

|
#38
John Mcmillan Rd
Hope Mills, NC 28348
|
2,361 sq. feet
|
2 baths 4 beds |
show details | |

|
#39
Medicus Ln
Hope Mills, NC 28348
|
2,079 sq. feet
|
2 baths 3 beds |
show details | |

|
#40
Gentleman Dr
Hope Mills, NC 28348
|
1,610 sq. feet
|
2 baths 3 beds |
show details |
| Photo | Address | Area | Beds / Baths | Price | Details |
|---|---|---|---|---|---|

|
#41
Bramblegate Rd
Hope Mills, NC 28348
|
1,331 sq. feet
|
2 baths 3 beds |
show details | |

|
#42
Ackerman Dr
Hope Mills, NC 28348
|
1,164 sq. feet
|
2 baths 3 beds |
show details | |

|
#43
Golfview Rd
Hope Mills, NC 28348
|
1,456 sq. feet
|
2 baths 3 beds |
show details | |

|
#44
Alexwood Dr
Hope Mills, NC 28348
|
1,332 sq. feet
|
2 baths 3 beds |
show details | |

|
#45
Walking Trail Way
Hope Mills, NC 28348
|
1,735 sq. feet
|
2 baths 3 beds |
show details | |

|
#46
Abbeville Cir
Hope Mills, NC 28348
|
- sq. feet
|
- baths - beds |
show details | |

|
#47
Hunting Path Dr
Hope Mills, NC 28348
|
- sq. feet
|
- baths - beds |
show details | |

|
#48
Mars Hill Church Rd
Hope Mills, NC 28348
|
- sq. feet
|
- baths - beds |
show details | |

|
#49
Port Richey Ln
Hope Mills, NC 28348
|
- sq. feet
|
- baths - beds |
show details | |

|
Check over 1 million property listings on Foreclosure.com!
|
browse all offers | |||


 | Apartments in Fayetteville/Hope Mills (10 replies) |
| Relocating to NC: Homes & Schools: Hope Mills vs. Pinehurst (21 replies) |
| Development in NC (420 replies) |
| Moving to Raeford (28 replies) |
| Looking at moving to NC (High Point or Hope mills areas) (10 replies) |
| Fayetteville area (21 replies) |

Median year apartment built: 1991
Household type by relationship:
Households: 17,749- Male householders: 2,982 (754 living alone), Female householders: 3,280 (985 living alone)
2,740 spouses (2,704 opposite-sex spouses), 309 unmarried partners, (272 opposite-sex unmarried partners), 5,952 children (5,494 natural, 97 adopted, 360 stepchildren), 592 grandchildren, 289 brothers or sisters, 419 parents, 21 foster children, 169 other relatives, 856 non-relatives
- In group quarters: 135
Size of family households: 1,891 2-persons, 1,200 3-persons, 876 4-persons, 386 5-persons, 46 6-persons, 131 7-or-more-persons.
Size of nonfamily households: 1,644 1-person, 276 2-persons, 29 3-persons, 13 4-persons.
2,676 married couples with children.
1,457 single-parent households (296 men, 1,161 women).
88.2% of residents of Hope Mills speak English at home.
7.9% of residents speak Spanish at home (70% speak English very well, 21% speak English well, 8% speak English not well, 1% don't speak English at all).
1.0% of residents speak other Indo-European language at home (61% speak English very well, 27% speak English well, 2% speak English not well, 10% don't speak English at all).
2.1% of residents speak Asian or Pacific Island language at home (60% speak English very well, 5% speak English well, 35% speak English not well).
0.4% of residents speak other language at home (50% speak English very well, 28% speak English well, 22% speak English not well).
Foreign born population: 1,267 (7.1%)
(46.6% of them are naturalized citizens)
| Here: | 6.3 |
| State: | 6.4 |
| Here: | 4.5 |
| State: | 4.4 |

- Bedrooms in owner-occupied houses and condos in Hope Mills, North Carolina
- 15no bedroom
- 161 bedroom
- 1852 bedrooms
- 2,6683 bedrooms
- 9424 bedrooms
- 2765+ bedrooms

- Bedrooms in renter-occupied apartments in Hope Mills, North Carolina
- 17no bedroom
- 1881 bedroom
- 1,2142 bedrooms
- 8793 bedrooms
- 954 bedrooms
- 185+ bedrooms

- Cars and other vehicles available in Hope Mills in owner-occupied houses/condos
- 136no vehicle
- 1,1631 vehicle
- 1,6472 vehicles
- 8243 vehicles
- 2654 vehicles
- 665+ vehicles

- Cars and other vehicles available in Hope Mills in renter-occupied apartments
- 204no vehicle
- 1,2251 vehicle
- 6502 vehicles
- 2983 vehicles
- 154 vehicles
- 205+ vehicles

- Rooms in owner-occupied houses in Hope Mills, North Carolina
- 151 room
- 02 rooms
- 163 rooms
- 2234 rooms
- 9295 rooms
- 1,2306 rooms
- 8657 rooms
- 3968 rooms
- 4279+ rooms

- Rooms in renter-occupied apartments in Hope Mills, North Carolina
- 171 room
- 192 rooms
- 1393 rooms
- 1,0394 rooms
- 6195 rooms
- 4056 rooms
- 1047 rooms
- 398 rooms
- 299+ rooms


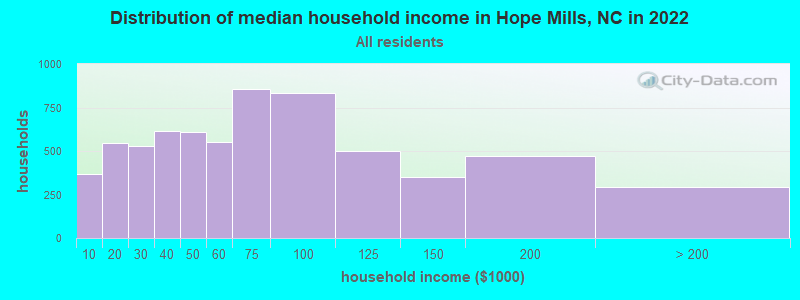
Hope Mills, NC household income distribution

- 368Less than $10,000
- 545$10,000 to $19,999
- 526$20,000 to $29,999
- 616$30,000 to $39,999
- 607$40,000 to $49,999
- 549$50,000 to $59,999
- 855$60,000 to $74,999
- 832$75,000 to $99,999
- 501$100,000 to $124,999
- 349$125,000 to $149,999
- 471$150,000 to $199,999
- 293$200,000 or more
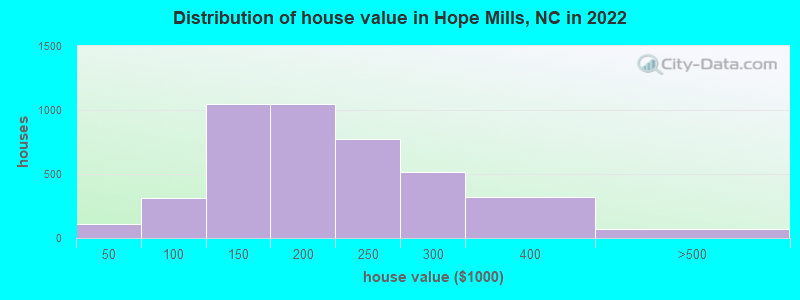
Home value of owner - occupied houses in 2022 in Hope Mills, NC
-
- 13Less than $10,000
- 21$10,000 to $14,999
- 9$15,000 to $19,999
- 25$20,000 to $24,999
- 10$25,000 to $29,999
- 22$35,000 to $39,999
- 8$40,000 to $49,999
- 24$50,000 to $59,999
- 46$70,000 to $79,999
- 119$80,000 to $89,999
- 114$90,000 to $99,999
- 583$100,000 to $124,999
- 461$125,000 to $149,999
- 614$150,000 to $174,999
- 433$175,000 to $199,999
- 771$200,000 to $249,999
- 516$250,000 to $299,999
- 319$300,000 to $399,999
- 51$400,000 to $499,999
- 19$500,000 to $749,999
Rent paid by renters in 2022 in Hope Mills, NC
-
- 34Less than $100
- 17$100 to $149
- 75$150 to $199
- 23$200 to $249
- 13$300 to $349
- 34$350 to $399
- 41$400 to $449
- 10$450 to $499
- 31$500 to $549
- 54$550 to $599
- 156$600 to $649
- 130$650 to $699
- 84$700 to $749
- 151$750 to $799
- 249$800 to $899
- 288$900 to $999
- 437$1,000 to $1,249
- 241$1,250 to $1,499
- 39$1,500 to $1,999
- 20$2,000 to $2,499
- 19No cash rent


Percentage of workers working in this county: 89.5%
Number of people working at home: 493 (6.5% of all workers)
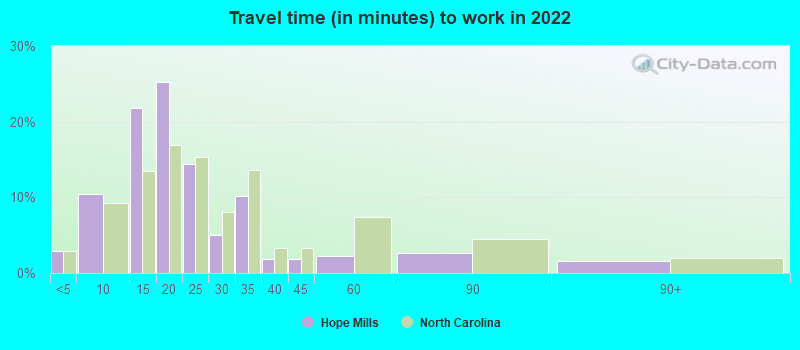
Travel time to work (commute)
- Less than 5 minutes: 104
- 5 to 9 minutes: 347
- 10 to 14 minutes: 845
- 15 to 19 minutes: 1,431
- 20 to 24 minutes: 1,483
- 25 to 29 minutes: 740
- 30 to 34 minutes: 921
- 35 to 39 minutes: 205
- 40 to 44 minutes: 299
- 45 to 59 minutes: 256
- 60 to 89 minutes: 154
- 90 or more minutes: 235
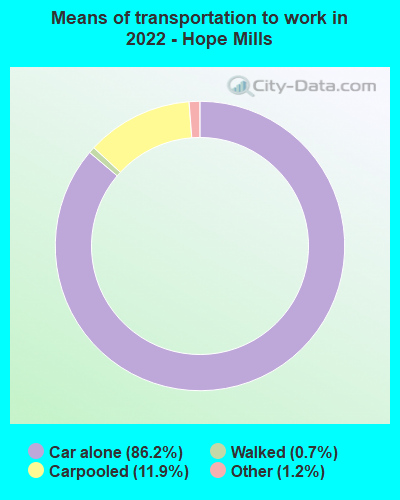
Means of transportation to work:
- Drove a car alone: 3,807 (78.4%)
- Carpooled: 572 (11.8%)
- Taxi: 33 (0.7%)
- Walked: 30 (0.6%)
- Worked at home: 493 (10.2%)

- Unemployment by race in 2022
- Unemployment rate for White non-Hispanic residents
- 7.3%Males
- 6.2%Females
- Unemployment rate for Black residents
- 2.9%Males
- 12.6%Females
- Unemployment rate for American Indian and Alaska Native residents
- 15.0%Females
- Unemployment rate for other race residents
- 15.8%Males
- Unemployment rate for two or more race residents
- 5.4%Males
- 5.4%Females
- Unemployment rate for Hispanic or Latino residents
- 8.4%Males
- 3.7%Females

- Year of entry for the foreign-born population in Hope Mills, North Carolina
- 5622010 or later
- 3392000 to 2009
- 1701990 to 1999
- 1101980 to 1989
- 1071970 to 1979
- 145Before 1970
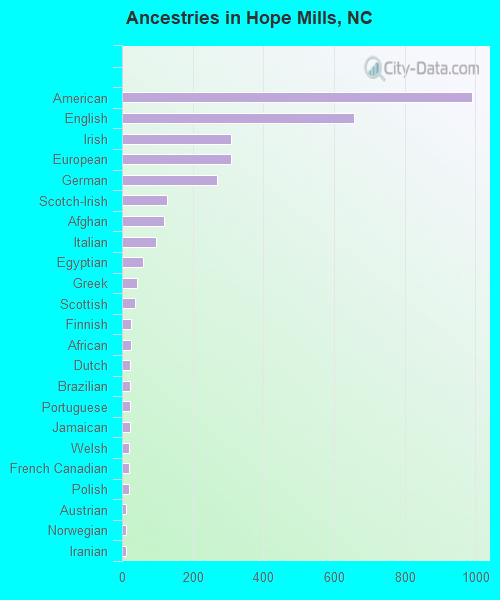
First ancestries reported:
- American: 989 (10.2%)
- English: 657 (6.8%)
- Irish: 309 (3.2%)
- European: 308 (3.2%)
- German: 269 (2.8%)
- Scotch-Irish: 126 (1.3%)
- Afghan: 118 (1.2%)
- Italian: 96 (1.0%)
- Egyptian: 60 (0.6%)
- Greek: 42 (0.4%)
- Scottish: 37 (0.4%)
- Finnish: 25 (0.3%)
- African: 25 (0.3%)
- Dutch: 24 (0.2%)
- Brazilian: 22 (0.2%)
- Portuguese: 22 (0.2%)
- Jamaican: 22 (0.2%)
- Welsh: 21 (0.2%)
- French Canadian: 19 (0.2%)
- Polish: 19 (0.2%)
- Austrian: 12 (0.1%)
- Norwegian: 12 (0.1%)
- Iranian: 11 (0.1%)
- Jordanian: 7 (0.07%)
- French: 6 (0.06%)
Most common places of birth for foreign-born residents (%):
| Hope Mills: | 14.0% (177) |
| North Carolina: | 24.7% (214,776) |
| Hope Mills: | 12.2% (155) |
| North Carolina: | 0.2% (1,745) |
| Hope Mills: | 10.8% (137) |
| North Carolina: | 1.3% (11,419) |
| Hope Mills: | 9.6% (122) |
| North Carolina: | 1.8% (15,988) |
| Hope Mills: | 6.3% (80) |
| North Carolina: | 0.4% (3,587) |
| Hope Mills: | 6.2% (78) |
| North Carolina: | 3.8% (33,379) |
| Hope Mills: | 5.1% (64) |
| North Carolina: | 1.8% (15,534) |
| Hope Mills: | 5.1% (64) |
| North Carolina: | 2.9% (24,965) |
| Hope Mills: | 4.3% (54) |
| North Carolina: | 0.7% (6,091) |
| Hope Mills: | 3.0% (38) |
| North Carolina: | 0.6% (4,847) |
| Hope Mills: | 2.6% (33) |
| North Carolina: | 0.9% (7,765) |
| Hope Mills: | 2.5% (32) |
| North Carolina: | 2.4% (20,695) |
| Hope Mills: | 2.1% (26) |
| North Carolina: | 0.5% (4,128) |
| Hope Mills: | 1.8% (23) |
| North Carolina: | 0.3% (2,583) |
| Hope Mills: | 1.7% (22) |
| North Carolina: | 1.0% (8,426) |
| Hope Mills: | 1.6% (20) |
| North Carolina: | 4.7% (40,707) |
| Hope Mills: | 1.5% (19) |
| North Carolina: | 1.0% (9,005) |
| Hope Mills: | 1.5% (19) |
| North Carolina: | 0.3% (3,031) |
Place of birth for U.S.-born residents:
- This state: 8,868
- Other state: 6,695
- Northeast: 1,703
- Midwest: 940
- South: 2,993
- West: 1,045
84.9% of Hope Mills residents lived in the same house 1 years ago.
Out of people who lived in different houses, 34.1% lived in this county.
Out of people who lived in different counties, 52.4% lived in North Carolina.
| Hope Mills: | 84.9% |
| State average: | 87.3% |
Education attainment for males 25 years and older:
- No schooling: 18
- Nursery to 4th grade: 0
- 5th and 6th grade: 31
- 7th and 8th grade: 68
- 9th grade: 52
- 10th grade: 25
- 11th grade: 53
- 12th grade, no diploma: 105
- High school graduate (or equivalency): 1,456
- Less than 1 year of college: 455
- Some college more than 1 year, no degree: 878
- Associate degree: 744
- Bachelor's degree: 843
- Master's degree: 237
- Professional school degree: 16
- Doctorate degree: 13

Education attainment for females 25 years and older:
- No schooling: 59
- Nursery to 4th grade: 0
- 5th and 6th grade: 17
- 7th and 8th grade: 48
- 9th grade: 55
- 10th grade: 58
- 11th grade: 43
- 12th grade, no diploma: 115
- High school graduate (or equivalency): 1,527
- Less than 1 year of college: 467
- Some college more than 1 year, no degree: 1,214
- Associate degree: 953
- Bachelor's degree: 937
- Master's degree: 465
- Professional school degree: 7
- Doctorate degree: 79


Housing units in structures:
- One, detached: 5,011
- One, attached: 105
- Two: 139
- 3 or 4: 582
- 5 to 9: 288
- 10 to 19: 325
- 20 to 49: 99
- 50 or more: 56
- Mobile homes: 183
Median worth of mobile homes: $151,927
Housing units lacking complete kitchen facilities in 2022: 2.2%
House/condo owner moved in on average 8 years ago
Renter moved in on average 4 years ago

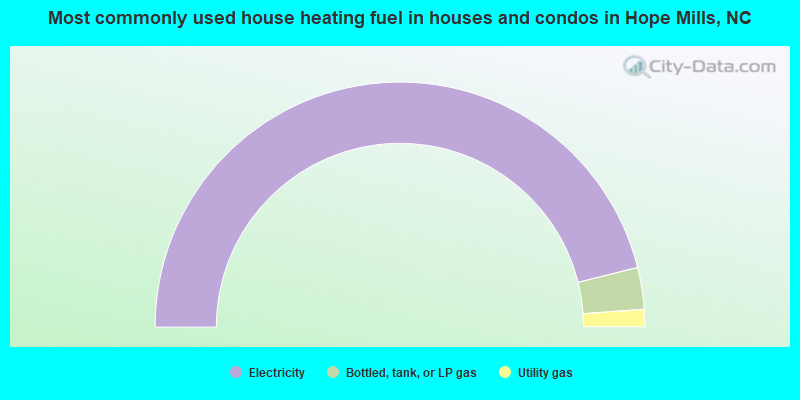
- 92.2%Electricity
- 5.5%Bottled, tank, or LP gas
- 2.3%Utility gas
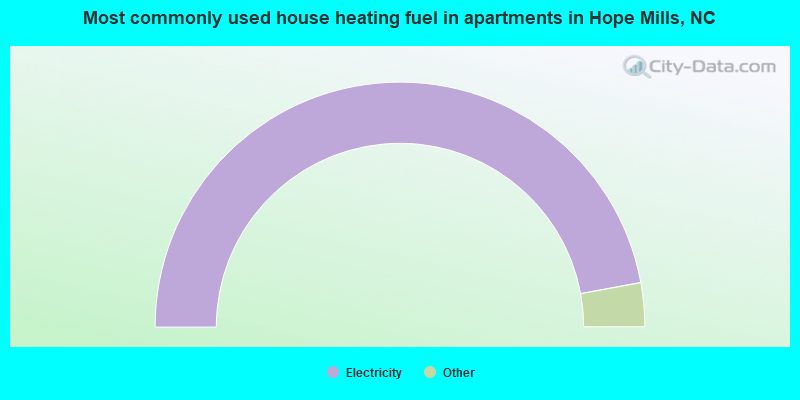
- 94.3%Electricity
- 3.5%Utility gas
- 1.9%Bottled, tank, or LP gas
- 0.3%Fuel oil, kerosene, etc.
Private vs. public school enrollment:
| Here: | 15.0% |
| North Carolina: | 13.8% |
| Here: | 23.3% |
| North Carolina: | 11.9% |
| Here: | 20.8% |
| North Carolina: | 19.3% |


