Hopkinsville, KY (Kentucky) Houses and Residents
| Hopkinsville: | $144,285 |
| Kentucky: | $196,300 |
Total population: 32,634 (Urban population: 29,483 (all inside urban clusters), Rural population: 739 (51 farm, 688 nonfarm))
Houses: 14,243 (12,514 occupied: 5,752 owner occupied, 6,648 renter occupied)
| % of renters here: | 54% |
| State: | 31% |
Housing density: 593 houses/condos per square mile
Median price asked for vacant for-sale houses and condos in 2022: $128,784.
Median contract rent in 2022: $667 (lower quartile is $475, upper quartile is $914)
Median rent asked for vacant for-rent units in 2022: $1,318
Median gross rent in Hopkinsville, KY in 2022: $844
Housing units in Hopkinsville with a mortgage: 3,961 (648 second mortgage, 9 home equity loan, 549 both second mortgage and home equity loan)
Houses without a mortgage: 13
Median household income for houses/condos with a mortgage: $77,230
Median household income for apartments without a mortgage: $53,537
Median monthly housing costs: $866
Compare current foreclosures in Hopkinsville, KY:
| Photo | Address | Area | Beds / Baths | Price | Details |
|---|---|---|---|---|---|

|
#1
Greenville Rd
Hopkinsville, KY 42240
|
1,008 sq. feet
|
1 baths 2 beds |
show details | |

|
#2
E 7th St
Hopkinsville, KY 42240
|
1,088 sq. feet
|
1 baths 2 beds |
show details | |

|
#3
Mount Zoar Latham Rd
Hopkinsville, KY 42240
|
1,962 sq. feet
|
1 baths 2 beds |
show details | |

|
#4
Old Madisonville Rd
Hopkinsville, KY 42240
|
846 sq. feet
|
1 baths 2 beds |
show details | |

|
#5
E 23rd St
Hopkinsville, KY 42240
|
1,124 sq. feet
|
1 baths 2 beds |
show details | |

|
#6
Lee Ln
Hopkinsville, KY 42240
|
1,040 sq. feet
|
2 baths 3 beds |
show details | |

|
#7
Sylvan Ter
Hopkinsville, KY 42240
|
1,552 sq. feet
|
1 baths 3 beds |
show details | |

|
#8
Antioch Rd
Hopkinsville, KY 42240
|
956 sq. feet
|
1 baths 3 beds |
show details | |

|
#9
Cayce Meade Dr
Hopkinsville, KY 42240
|
1,774 sq. feet
|
2 baths 4 beds |
show details | |

|
#10
N Sunset Cir
Hopkinsville, KY 42240
|
2,430 sq. feet
|
2 baths 4 beds |
show details |
| Photo | Address | Area | Beds / Baths | Price | Details |
|---|---|---|---|---|---|

|
#11
Brock Ave
Hopkinsville, KY 42240
|
2,265 sq. feet
|
4 baths 4 beds |
show details | |

|
#12
Greenville Rd
Hopkinsville, KY 42240
|
768 sq. feet
|
1 baths 2 beds |
show details | |

|
#13
Old Madisonville Rd
Hopkinsville, KY 42240
|
1,536 sq. feet
|
1 baths 1 beds |
show details | |

|
#14
Marietta Dr
Hopkinsville, KY 42240
|
2,017 sq. feet
|
2 baths 3 beds |
show details | |

|
#15
Sheridan Cir
Hopkinsville, KY 42240
|
1,539 sq. feet
|
2 baths 3 beds |
show details | |

|
#16
Country Club Ln
Hopkinsville, KY 42240
|
1,516 sq. feet
|
1 baths 4 beds |
show details | |

|
#17
Winona Ct
Hopkinsville, KY 42240
|
1,707 sq. feet
|
2 baths 3 beds |
show details | |

|
#18
S Kentucky Ave
Hopkinsville, KY 42240
|
1,529 sq. feet
|
1 baths 3 beds |
show details | |

|
#19
Apache Dr
Hopkinsville, KY 42240
|
1,140 sq. feet
|
1 baths 3 beds |
show details | |

|
#20
Gateway Ln
Hopkinsville, KY 42240
|
1,161 sq. feet
|
1 baths 2 beds |
show details |
| Photo | Address | Area | Beds / Baths | Price | Details |
|---|---|---|---|---|---|

|
#21
Woodmont Dr
Hopkinsville, KY 42240
|
2,053 sq. feet
|
2 baths 3 beds |
show details | |

|
#22
Woodbine St
Hopkinsville, KY 42240
|
840 sq. feet
|
1 baths 2 beds |
show details | |

|
#23
Rose Dr
Hopkinsville, KY 42240
|
1,000 sq. feet
|
1 baths 3 beds |
show details | |

|
#24
Sylvan Ter
Hopkinsville, KY 42240
|
1,425 sq. feet
|
1 baths 3 beds |
show details | |

|
#25
Madisonville Rd
Hopkinsville, KY 42240
|
1,014 sq. feet
|
1 baths 2 beds |
show details | |

|
#26
Seminole Dr
Hopkinsville, KY 42240
|
1,400 sq. feet
|
1 baths 3 beds |
show details | |

|
#27
Henderson Dr
Hopkinsville, KY 42240
|
2,059 sq. feet
|
1 baths 3 beds |
show details | |

|
#28
Hunters Ln
Hopkinsville, KY 42240
|
1,480 sq. feet
|
2 baths 3 beds |
show details | |

|
#29
Elton Dr
Hopkinsville, KY 42240
|
1,645 sq. feet
|
2 baths 3 beds |
show details | |

|
#30
Mill Terrace Ct
Hopkinsville, KY 42240
|
1,060 sq. feet
|
1 baths 2 beds |
show details |
| Photo | Address | Area | Beds / Baths | Price | Details |
|---|---|---|---|---|---|

|
#31
Cumbee Rd
Hopkinsville, KY 42240
|
1,558 sq. feet
|
2 baths 3 beds |
show details | |

|
#32
E 21st St
Hopkinsville, KY 42240
|
1,280 sq. feet
|
1 baths 3 beds |
show details | |

|
#33
E 2nd St
Hopkinsville, KY 42240
|
1,207 sq. feet
|
1 baths 3 beds |
show details | |

|
#34
Northridge Ave
Hopkinsville, KY 42240
|
1,500 sq. feet
|
2 baths 3 beds |
show details | |

|
#35
Caramel Dr # 173
Hopkinsville, KY 42240
|
1,271 sq. feet
|
1 baths 3 beds |
show details | |

|
#36
Chippewa Dr
Hopkinsville, KY 42240
|
1,260 sq. feet
|
1 baths 3 beds |
show details | |

|
#37
Gilkey Dr
Hopkinsville, KY 42240
|
1,110 sq. feet
|
1 baths 3 beds |
show details | |

|
#38
Antioch Rd
Hopkinsville, KY 42240
|
1,265 sq. feet
|
1 baths 2 beds |
show details | |

|
#39
Nelson Dr
Hopkinsville, KY 42240
|
1,016 sq. feet
|
1 baths 2 beds |
show details | |

|
#40
S Virginia St
Hopkinsville, KY 42240
|
1,384 sq. feet
|
2 baths 3 beds |
show details |
| Photo | Address | Area | Beds / Baths | Price | Details |
|---|---|---|---|---|---|

|
#41
Rock Cliff Dr
Hopkinsville, KY 42240
|
1,039 sq. feet
|
1 baths 3 beds |
show details | |

|
#42
Happy Hollow Est
Hopkinsville, KY 42240
|
1,972 sq. feet
|
2 baths 3 beds |
show details | |

|
#43
N Vine St
Hopkinsville, KY 42240
|
760 sq. feet
|
1 baths 3 beds |
show details | |

|
#44
N Kentucky Ave
Hopkinsville, KY 42240
|
874 sq. feet
|
1 baths 3 beds |
show details | |

|
#45
Clarence Dr
Hopkinsville, KY 42240
|
2,083 sq. feet
|
2 baths 2 beds |
show details | |

|
#46
Sylvan Ter
Hopkinsville, KY 42240
|
936 sq. feet
|
1 baths 3 beds |
show details | |

|
#47
Brock Ave
Hopkinsville, KY 42240
|
1,161 sq. feet
|
2 baths 3 beds |
show details | |

|
#48
S Main St
Hopkinsville, KY 42240
|
4,522 sq. feet
|
3 baths 4 beds |
show details | |

|
#49
Forest Park Blvd
Hopkinsville, KY 42240
|
1,180 sq. feet
|
1 baths 3 beds |
show details | |

|
Check over 1 million property listings on Foreclosure.com!
|
browse all offers | |||

Latest news about housing in Hopkinsville, KY collected exclusively by city-data.com from local newspapers, TV, and radio stations

 | Considering moving to KY – you want details, I got details! (9 replies) |
| Another hopeful transplant with questions (24 replies) |
| Merry Christmas in Kentucky (8 replies) |
| 2020 Census Results for KY - Is anyone surprised? (8 replies) |
| LBLfor family and in-laws - Maybe Grand Rivers? (6 replies) |
| Looking to move to Kentucky, but are there any areas that don't flood? (12 replies) |

Median year apartment built: 1987
Household type by relationship:
Households: 31,157- Male householders: 5,379 (1,848 living alone), Female householders: 7,139 (2,511 living alone)
4,033 spouses (4,001 opposite-sex spouses), 912 unmarried partners, (806 opposite-sex unmarried partners), 8,956 children (8,519 natural, 189 adopted, 246 stepchildren), 825 grandchildren, 356 brothers or sisters, 314 parents, 0 foster children, 408 other relatives, 1,101 non-relatives
- In group quarters: 1,730
Size of family households: 3,608 2-persons, 1,732 3-persons, 1,199 4-persons, 440 5-persons, 75 6-persons, 199 7-or-more-persons.
Size of nonfamily households: 4,312 1-person, 671 2-persons, 100 3-persons, 85 4-persons.
3,338 married couples with children.
2,524 single-parent households (155 men, 2,369 women).
95.8% of residents of Hopkinsville speak English at home.
2.3% of residents speak Spanish at home (54% speak English very well, 28% speak English well, 18% speak English not well).
0.9% of residents speak other Indo-European language at home (79% speak English very well, 21% speak English well).
0.7% of residents speak Asian or Pacific Island language at home (44% speak English very well, 35% speak English well, 21% speak English not well).
0.1% of residents speak other language at home (14% speak English very well, 86% speak English well).
Foreign born population: 972 (3.1%)
(51.6% of them are naturalized citizens)
| Here: | 6.2 |
| State: | 6.4 |
| Here: | 4.0 |
| State: | 4.4 |

- Bedrooms in owner-occupied houses and condos in Hopkinsville, Kentucky
- 10no bedroom
- 641 bedroom
- 6892 bedrooms
- 3,6823 bedrooms
- 1,0484 bedrooms
- 2605+ bedrooms

- Bedrooms in renter-occupied apartments in Hopkinsville, Kentucky
- 167no bedroom
- 1,0361 bedroom
- 3,1632 bedrooms
- 1,8293 bedrooms
- 3514 bedrooms
- 1025+ bedrooms

- Cars and other vehicles available in Hopkinsville in owner-occupied houses/condos
- 248no vehicle
- 1,9801 vehicle
- 2,2642 vehicles
- 9523 vehicles
- 2534 vehicles
- 565+ vehicles

- Cars and other vehicles available in Hopkinsville in renter-occupied apartments
- 675no vehicle
- 3,6481 vehicle
- 2,0742 vehicles
- 2243 vehicles
- 284 vehicles
- 05+ vehicles

- Rooms in owner-occupied houses in Hopkinsville, Kentucky
- 101 room
- 02 rooms
- 973 rooms
- 4014 rooms
- 1,4815 rooms
- 1,1476 rooms
- 1,0527 rooms
- 7148 rooms
- 8509+ rooms

- Rooms in renter-occupied apartments in Hopkinsville, Kentucky
- 1671 room
- 732 rooms
- 7273 rooms
- 2,5674 rooms
- 1,3205 rooms
- 9606 rooms
- 5177 rooms
- 2158 rooms
- 1029+ rooms


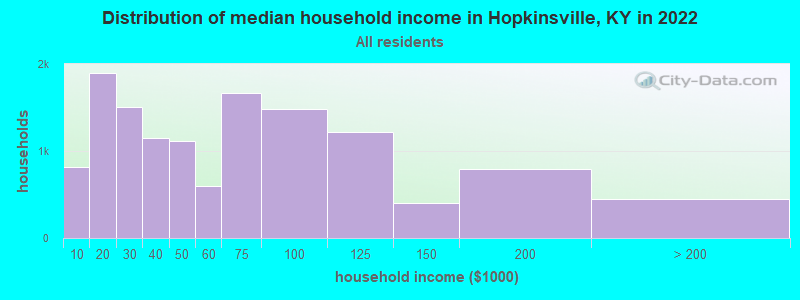
Hopkinsville, KY household income distribution

- 813Less than $10,000
- 1,894$10,000 to $19,999
- 1,505$20,000 to $29,999
- 1,145$30,000 to $39,999
- 1,114$40,000 to $49,999
- 592$50,000 to $59,999
- 1,671$60,000 to $74,999
- 1,481$75,000 to $99,999
- 1,215$100,000 to $124,999
- 398$125,000 to $149,999
- 791$150,000 to $199,999
- 451$200,000 or more
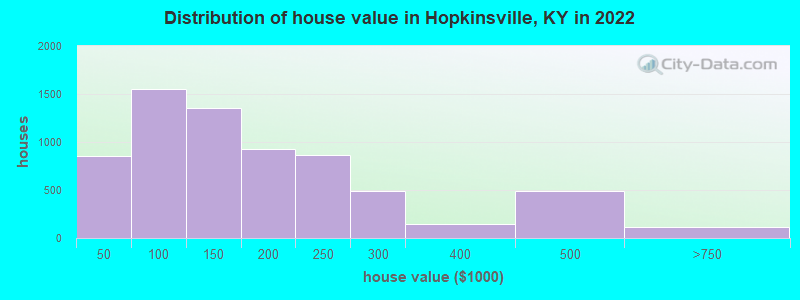
Home value of owner - occupied houses in 2022 in Hopkinsville, KY
-
- 79Less than $10,000
- 234$10,000 to $14,999
- 57$15,000 to $19,999
- 66$20,000 to $24,999
- 35$25,000 to $29,999
- 116$30,000 to $34,999
- 20$35,000 to $39,999
- 243$40,000 to $49,999
- 155$50,000 to $59,999
- 277$60,000 to $69,999
- 341$70,000 to $79,999
- 400$80,000 to $89,999
- 129$90,000 to $99,999
- 696$100,000 to $124,999
- 660$125,000 to $149,999
- 351$150,000 to $174,999
- 570$175,000 to $199,999
- 864$200,000 to $249,999
- 490$250,000 to $299,999
- 143$300,000 to $399,999
- 488$400,000 to $499,999
- 106$500,000 to $749,999
- 11$750,000 to $999,999
Rent paid by renters in 2022 in Hopkinsville, KY
-
- 133Less than $100
- 63$100 to $149
- 17$150 to $199
- 156$200 to $249
- 219$250 to $299
- 314$300 to $349
- 302$350 to $399
- 265$400 to $449
- 325$450 to $499
- 521$500 to $549
- 333$550 to $599
- 441$600 to $649
- 509$650 to $699
- 598$700 to $749
- 273$750 to $799
- 1,141$800 to $899
- 268$900 to $999
- 342$1,000 to $1,249
- 150$1,250 to $1,499
- 5$1,500 to $1,999
- 25$2,500 to $2,999
- 14$3,500 or more
- 244No cash rent


Percentage of workers working in this county: 83.2%
Number of people working at home: 441 (3.6% of all workers)
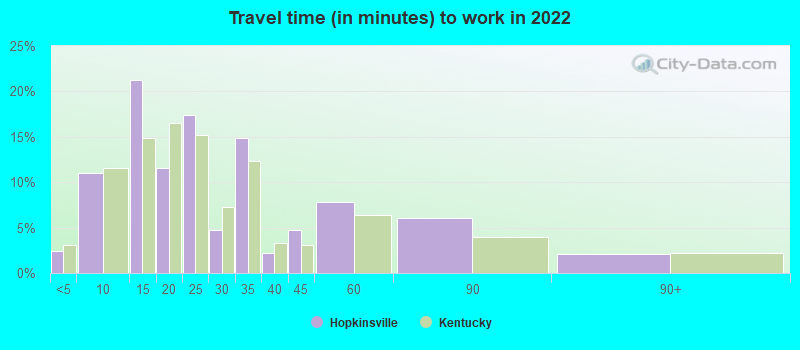
Travel time to work (commute)
- Less than 5 minutes: 228
- 5 to 9 minutes: 2,069
- 10 to 14 minutes: 3,761
- 15 to 19 minutes: 1,913
- 20 to 24 minutes: 1,785
- 25 to 29 minutes: 120
- 30 to 34 minutes: 993
- 35 to 39 minutes: 168
- 40 to 44 minutes: 108
- 45 to 59 minutes: 168
- 60 to 89 minutes: 1,336
- 90 or more minutes: 390
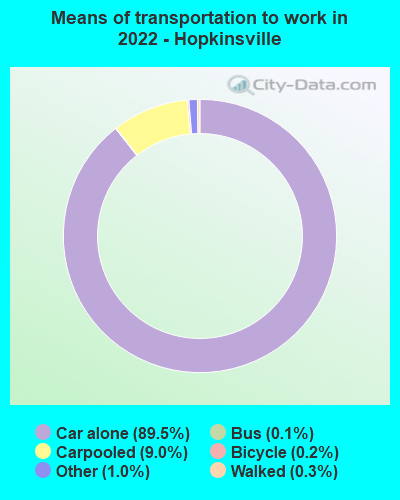
Means of transportation to work:
- Drove a car alone: 17,369 (84.8%)
- Carpooled: 1,926 (9.4%)
- Bus: 13 (0.1%)
- Taxi: 232 (1.1%)
- Bicycle: 27 (0.1%)
- Walked: 49 (0.2%)
- Worked at home: 441 (2.2%)

- Unemployment by race in 2022
- Unemployment rate for White non-Hispanic residents
- 8.2%Males
- 6.8%Females
- Unemployment rate for Black residents
- 6.8%Males
- 11.5%Females
- Unemployment rate for American Indian and Alaska Native residents
- 22.2%Males
- Unemployment rate for Asian residents
- 17.8%Females
- Unemployment rate for other race residents
- 9.1%Males
- Unemployment rate for two or more race residents
- 12.3%Females
- Unemployment rate for Hispanic or Latino residents
- 2.5%Males

- Year of entry for the foreign-born population in Hopkinsville, Kentucky
- 2862010 or later
- 3082000 to 2009
- 1741990 to 1999
- 1551980 to 1989
- 481970 to 1979
- 113Before 1970

First ancestries reported:
- English: 1,858 (15.4%)
- American: 1,620 (13.4%)
- German: 819 (6.8%)
- Irish: 592 (4.9%)
- Scottish: 241 (2.0%)
- French Canadian: 169 (1.4%)
- European: 141 (1.2%)
- Italian: 135 (1.1%)
- Scotch-Irish: 104 (0.9%)
- Polish: 96 (0.8%)
- African: 93 (0.8%)
- Egyptian: 77 (0.6%)
- Bahamian: 66 (0.5%)
- Jamaican: 60 (0.5%)
- Nigerian: 49 (0.4%)
- Czech: 45 (0.4%)
- British: 42 (0.3%)
- Cajun: 34 (0.3%)
- Danish: 33 (0.3%)
- Lithuanian: 32 (0.3%)
- Senegalese: 26 (0.2%)
- Welsh: 26 (0.2%)
- French: 13 (0.1%)
- British West Indian: 12 (0.10%)
- Swedish: 10 (0.08%)
- Barbadian: 7 (0.06%)
- Finnish: 6 (0.05%)
- Norwegian: 6 (0.05%)
- Russian: 6 (0.05%)
- Canadian: 5 (0.04%)
- Eastern European: 1 (0.01%)
Most common places of birth for foreign-born residents (%):
| Hopkinsville: | 33.5% (321) |
| Kentucky: | 15.8% (29,070) |
| Hopkinsville: | 18.9% (181) |
| Kentucky: | 7.3% (13,454) |
| Hopkinsville: | 13.3% (127) |
| Kentucky: | 1.6% (2,893) |
| Hopkinsville: | 7.4% (71) |
| Kentucky: | 0.1% (155) |
| Hopkinsville: | 4.9% (47) |
| Kentucky: | 2.9% (5,302) |
| Hopkinsville: | 4.5% (43) |
| Kentucky: | 1.9% (3,585) |
| Hopkinsville: | 4.5% (43) |
| Kentucky: | 0.3% (607) |
| Hopkinsville: | 3.1% (30) |
| Kentucky: | 0.0% (88) |
| Hopkinsville: | 3.1% (30) |
| Kentucky: | 0.1% (264) |
| Hopkinsville: | 2.1% (20) |
| Kentucky: | 1.2% (2,249) |
Place of birth for U.S.-born residents:
- This state: 19,268
- Other state: 10,396
- Northeast: 859
- Midwest: 3,048
- South: 5,375
- West: 979
76.9% of Hopkinsville residents lived in the same house 1 years ago.
Out of people who lived in different houses, 37.1% lived in this county.
Out of people who lived in different counties, 37.6% lived in Kentucky.
| Hopkinsville: | 76.9% |
| State average: | 87.2% |
Education attainment for males 25 years and older:
- No schooling: 35
- Nursery to 4th grade: 3
- 5th and 6th grade: 78
- 7th and 8th grade: 573
- 9th grade: 255
- 10th grade: 259
- 11th grade: 326
- 12th grade, no diploma: 267
- High school graduate (or equivalency): 3,613
- Less than 1 year of college: 1,065
- Some college more than 1 year, no degree: 998
- Associate degree: 369
- Bachelor's degree: 1,264
- Master's degree: 269
- Professional school degree: 112
- Doctorate degree: 64

Education attainment for females 25 years and older:
- No schooling: 57
- Nursery to 4th grade: 67
- 5th and 6th grade: 38
- 7th and 8th grade: 268
- 9th grade: 116
- 10th grade: 152
- 11th grade: 266
- 12th grade, no diploma: 83
- High school graduate (or equivalency): 3,297
- Less than 1 year of college: 810
- Some college more than 1 year, no degree: 1,500
- Associate degree: 1,393
- Bachelor's degree: 1,826
- Master's degree: 632
- Professional school degree: 238
- Doctorate degree: 79


Housing units in structures:
- One, detached: 9,621
- One, attached: 246
- Two: 524
- 3 or 4: 1,472
- 5 to 9: 901
- 10 to 19: 352
- 20 to 49: 530
- 50 or more: 142
- Mobile homes: 451
Median worth of mobile homes: $48,172
Housing units lacking complete kitchen facilities in 2022: 4.7%
House/condo owner moved in on average 13 years ago
Renter moved in on average 3 years ago

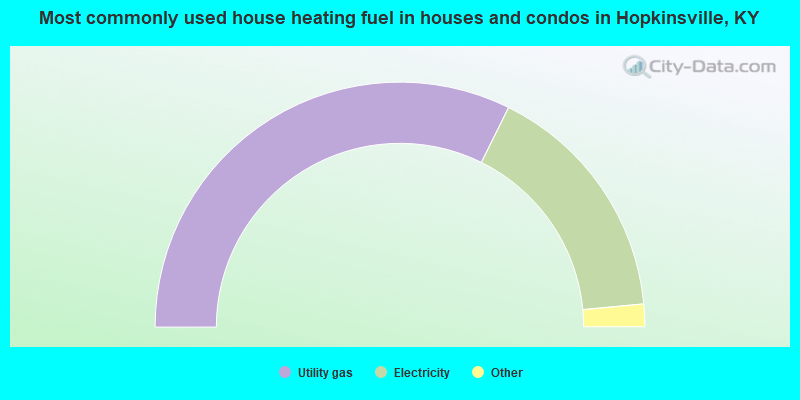
- 64.7%Utility gas
- 32.4%Electricity
- 1.2%Bottled, tank, or LP gas
- 0.9%Fuel oil, kerosene, etc.
- 0.8%No fuel used
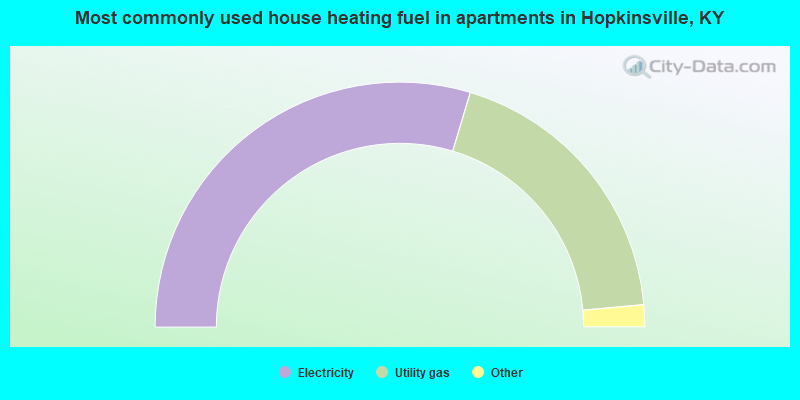
- 59.3%Electricity
- 37.8%Utility gas
- 1.0%Fuel oil, kerosene, etc.
- 0.9%No fuel used
- 0.5%Bottled, tank, or LP gas
- 0.4%Wood
Private vs. public school enrollment:
| Here: | 20.4% |
| Kentucky: | 17.2% |
| Here: | 16.9% |
| Kentucky: | 15.2% |
| Here: | 15.6% |
| Kentucky: | 19.6% |


