Inver Grove Heights, MN (Minnesota) Houses and Residents
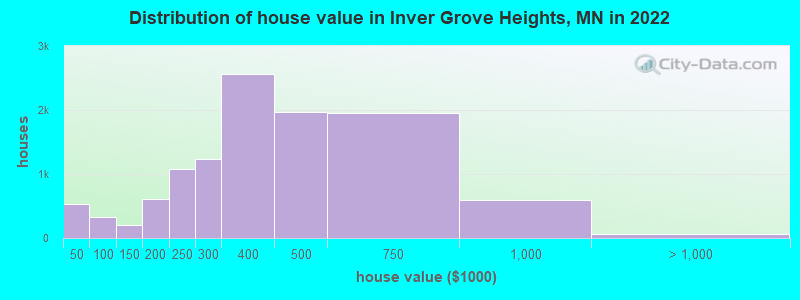
Estimated median house or condo value in 2022: $360,622 (it was $137,800 in 2000 )
Inver Grove Heights:
$360,622Minnesota:
$314,600
Lower value quartile - upper value quartile: $253,283 - $491,975Mean price in 2022: Detached houses: $495,084 Here:
$495,084State:
$374,552
Townhouses or other attached units: $277,084 Here:
$277,084State:
$312,049
In 3-to-4-unit structures: $248,380 Here:
$248,380State:
$238,971
In 5-or-more-unit structures: $156,261 Here:
$156,261State:
$258,516
Mobile homes: $45,433 Here:
$45,433State:
$94,605
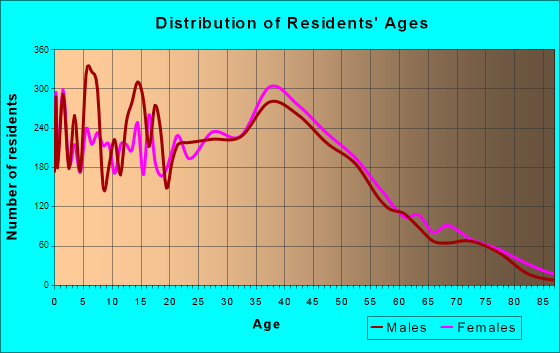
Total population: 34,709 (Urban population: 26,963, Rural population: 2,761 (42 farm, 2,719 nonfarm ))
Houses: 15,526 (15,161 occupied: 11,217 owner occupied, 4,004 renter occupied )
% of renters here:
26%State:
28%
Housing density: 542 houses/condos per square mile
Median price asked for vacant for-sale houses and condos in 2022: $419,016.
Median contract rent in 2022: $1,251 (lower quartile is $1,040, upper quartile is $1,607)
Median rent asked for vacant for-rent units in 2022: $469
Median gross rent in Inver Grove Heights, MN in 2022: $1,369
Housing units in Inver Grove Heights with a mortgage: 7,232 (755 second mortgage, 27 home equity loan, 627 both second mortgage and home equity loan )Houses without a mortgage: 112
Median household income for houses/condos with a mortgage: $125,150
Median household income for apartments without a mortgage: $98,107
Median monthly housing costs: $1,461
Data:
Median house or condo value ($)
Median house or condo value ($ change since 2000)
Median house or condo value ($) - White
Median house or condo value ($) - Black or African American
Median house or condo value ($) - Asian
Median house or condo value ($) - Hispanic or Latino
Median house or condo value ($) - American Indian and Alaska Native
Median house or condo value ($) - Multirace
Median house or condo value ($) - Other Race
Median price asked for mobile homes ($)
Household density (households per square mile)
Mean house or condo value by units in structure - 1, detached ($)
Mean house or condo value by units in structure - 1, attached ($)
Mean house or condo value by units in structure - 2 ($)
Mean house or condo value by units in structure by units in structure - 3 or 4 ($)
Mean house or condo value by units in structure - 5 or more ($)
Mean house or condo value by units in structure - Boat, RV, van, etc. ($)
Mean house or condo value by units in structure - Mobile home ($)
Median contract rent ($)
Median contract rent - Lower quartile ($)
Median contract rent - Upper quartile ($)
Median gross rent ($)
Urban houses (%)
Rural houses (%)
Houses occupied (%)
Houses occupied (% change since 2000)
Houses owner occupied (%)
Houses owner occupied (% change since 2000)
Houses renter occupied (%)
Houses renter occupied (% change since 2000)
Vacant housing units - For rent (%)
Vacant housing units - For rent (% change since 2000)
Vacant housing units - For sale only (%)
Vacant housing units - For sale only (% change since 2000)
Vacant housing units - Rented or sold, not occupied (%)
Vacant housing units - Rented or sold, not occupied (% change since 2000)
Vacant housing units - For seasonal, recreational, or occasional use (%)
Vacant housing units - For seasonal, recreational, or occasional use (% change since 2000)
Vacant housing units - For migrant workers (%)
Vacant housing units - For migrant workers (% change since 2000)
Vacant housing units - Other vacant (%)
Vacant housing units - Other vacant (% change since 2000)
Median monthly housing costs ($)
Median household income for houses/condos with a mortgage ($)
Median household income for houses/condos without a mortgage ($)
Median household income ($)
Median household income ($) - White
Median household income ($) - Black or African American
Median household income ($) - Asian
Median household income ($) - Hispanic or Latino
Median household income ($) - American Indian and Alaska Native
Median household income ($) - Multirace
Median household income ($) - Other Race
Mortgage status - with mortgage (%)
Mortgage status - with second mortgage (%)
Mortgage status - with home equity loan (%)
Mortgage status - with both second mortgage and home equity loan (%)
Mortgage status - without a mortgage (%)
Median year house/condo built
Median year apartment built
Household type by relationship - Male householder living alone (%)
Household type by relationship - Male householder not living alone (%)
Household type by relationship - Female householder living alone (%)
Household type by relationship - Female householder not living alone (%)
Household type by relationship - Opposite-Sex spouse (%)
Household type by relationship - Same-Sex spouse (%)
Household type by relationship - Opposite-Sex unmarried partner (%)
Household type by relationship - Same-Sex unmarried partner (%)
Household type by relationship - In group quarters (%)
Size of family households - 2-person household (%)
Size of family households - 3-person household (%)
Size of family households - 4-person household (%)
Size of family households - 5-person household (%)
Size of family households - 6-person household (%)
Size of family households - 7-or-more-person household (%)
Size of nonfamily households - 1-person household (%)
Size of nonfamily households - 2-person household (%)
Size of nonfamily households - 3-person household (%)
Size of nonfamily households - 4-person household (%)
Size of nonfamily households - 5-person household (%)
Size of nonfamily households - 6-person household (%)
Size of nonfamily households - 7-or-moreperson household (%)
Year house built - Built 2010 or later (%)
Year house built - Built 2000 to 2009 (%)
Year house built - Built 1990 to 1999 (%)
Year house built - Built 1980 to 1989 (%)
Year house built - Built 1970 to 1979 (%)
Year house built - Built 1960 to 1969 (%)
Year house built - Built 1950 to 1959 (%)
Year house built - Built 1940 to 1949 (%)
Year house built - Built 1939 or earlier (%)
Median number of rooms in houses and condos
Median number of rooms in apartments
Median number of bedrooms in owner occupied houses
Mean number of bedrooms in owner occupied houses
Median number of bedrooms in renter occupied houses
Mean number of bedrooms in renter occupied houses
Median number of vehichles in owner occupied houses
Mean number of vehichles in owner occupied houses
Median number of vehichles in renter occupied houses
Mean number of vehichles in renter occupied houses
Rooms in owner-occupied houses - 1 room (%)
Rooms in owner-occupied houses - 2 rooms (%)
Rooms in owner-occupied houses - 3 rooms (%)
Rooms in owner-occupied houses - 4 rooms (%)
Rooms in owner-occupied houses - 5 rooms (%)
Rooms in owner-occupied houses - 6 rooms (%)
Rooms in owner-occupied houses - 7 rooms (%)
Rooms in owner-occupied houses - 8 rooms (%)
Rooms in owner-occupied houses - 9+ rooms (%)
Rooms in renter-occupied houses - 1 room (%)
Rooms in renter-occupied houses - 2 rooms (%)
Rooms in renter-occupied houses - 3 rooms (%)
Rooms in renter-occupied houses - 4 rooms (%)
Rooms in renter-occupied houses - 5 rooms (%)
Rooms in renter-occupied houses - 6 rooms (%)
Rooms in renter-occupied houses - 7 rooms (%)
Rooms in renter-occupied houses - 8 rooms (%)
Rooms in renter-occupied houses - 9+ rooms (%)
Bedrooms in owner-occupied houses - no bedrooms (%)
Bedrooms in owner-occupied houses - 1 bedroom (%)
Bedrooms in owner-occupied houses - 2 bedrooms (%)
Bedrooms in owner-occupied houses - 3 bedrooms (%)
Bedrooms in owner-occupied houses - 4 bedrooms (%)
Bedrooms in owner-occupied houses - 5+ bedrooms (%)
Bedrooms in renter-occupied houses - no bedrooms (%)
Bedrooms in renter-occupied houses - 1 bedroom (%)
Bedrooms in renter-occupied houses - 2 bedrooms (%)
Bedrooms in renter-occupied houses - 3 bedrooms (%)
Bedrooms in renter-occupied houses - 4 bedrooms (%)
Bedrooms in renter-occupied houses - 5+ bedrooms (%)
Vehicles available in owner-occupied houses - no vehicle available (%)
Vehicles available in owner-occupied houses - 1 vehicle available(%)
Vehicles available in owner-occupied houses - 2 Vehicles available (%)
Vehicles available in owner-occupied houses - 3 Vehicles available (%)
Vehicles available in owner-occupied houses - 4 Vehicles available (%)
Vehicles available in owner-occupied houses - 5+ Vehicles available (%)
Vehicles available in renter-occupied houses - no vehicle available (%)
Vehicles available in renter-occupied houses - 1 vehicle available (%)
Vehicles available in renter-occupied houses - 2 Vehicles available (%)
Vehicles available in renter-occupied houses - 3 Vehicles available (%)
Vehicles available in renter-occupied houses - 4 Vehicles available (%)
Vehicles available in renter-occupied houses - 5+ Vehicles available (%)
Housing units in structures - 1, detached (%)
Housing units in structures - 1, attached (%)
Housing units in structures - 2 (%)
Housing units in structures - 3 or 4 (%)
Housing units in structures - 5 to 9 (%)
Housing units in structures - 10 to 19 (%)
Housing units in structures - 20 to 49 (%)
Housing units in structures - 50 or more (%)
Housing units in structures - Mobile home (%)
Housing units in structures - Boat, RV, van, etc. (%)
Housing units in structures - Owners - 1, detached (%)
Housing units in structures - Owners - 1, attached (%)
Housing units in structures - Owners - 2 (%)
Housing units in structures - Owners - 3 or 4 (%)
Housing units in structures - Owners - 5 to 9 (%)
Housing units in structures - Owners - 10 to 19 (%)
Housing units in structures - Owners - 20 to 49 (%)
Housing units in structures - Owners - 50 or more (%)
Housing units in structures - Owners - Mobile home (%)
Housing units in structures - Owners - Boat, RV, van, etc. (%)
Housing units in structures - Renters - 1, detached (%)
Housing units in structures - Renters - 1, attached (%)
Housing units in structures - Renters - 2 (%)
Housing units in structures - Renters - 3 or 4 (%)
Housing units in structures - Renters - 5 to 9 (%)
Housing units in structures - Renters - 10 to 19 (%)
Housing units in structures - Renters - 20 to 49 (%)
Housing units in structures - Renters - 50 or more (%)
Housing units in structures - Renters - Mobile home (%)
Housing units in structures - Renters - Boat, RV, van, etc. (%)
House/condo owner moved in on average (years ago)
Renter moved in on average (years ago)
Year householder moved into unit - Moved in 1999 to March 2000 (%)
Year householder moved into unit - Moved in 1999 to March 2000 (%) - White
Year householder moved into unit - Moved in 1999 to March 2000 (%) - Black or African American
Year householder moved into unit - Moved in 1999 to March 2000 (%) - Asian
Year householder moved into unit - Moved in 1999 to March 2000 (%) - Hispanic or Latino
Year householder moved into unit - Moved in 1999 to March 2000 (%) - American Indian and Alaska Native
Year householder moved into unit - Moved in 1999 to March 2000 (%) - Multirace
Year householder moved into unit - Moved in 1999 to March 2000 (%) - Other Race
Year householder moved into unit - Moved in 1995 to 1998 (%)
Year householder moved into unit - Moved in 1995 to 1998 (%) - White
Year householder moved into unit - Moved in 1995 to 1998 (%) - Black or African American
Year householder moved into unit - Moved in 1995 to 1998 (%) - Asian
Year householder moved into unit - Moved in 1995 to 1998 (%) - Hispanic or Latino
Year householder moved into unit - Moved in 1995 to 1998 (%) - American Indian and Alaska Native
Year householder moved into unit - Moved in 1995 to 1998 (%) - Multirace
Year householder moved into unit - Moved in 1995 to 1998 (%) - Other Race
Year householder moved into unit - Moved in 1990 to 1994 (%)
Year householder moved into unit - Moved in 1990 to 1994 (%) - White
Year householder moved into unit - Moved in 1990 to 1994 (%) - Black or African American
Year householder moved into unit - Moved in 1990 to 1994 (%) - Asian
Year householder moved into unit - Moved in 1990 to 1994 (%) - Hispanic or Latino
Year householder moved into unit - Moved in 1990 to 1994 (%) - American Indian and Alaska Native
Year householder moved into unit - Moved in 1990 to 1994 (%) - Multirace
Year householder moved into unit - Moved in 1990 to 1994 (%) - Other Race
Year householder moved into unit - Moved in 1980 to 1989 (%)
Year householder moved into unit - Moved in 1980 to 1989 (%) - White
Year householder moved into unit - Moved in 1980 to 1989 (%) - Black or African American
Year householder moved into unit - Moved in 1980 to 1989 (%) - Asian
Year householder moved into unit - Moved in 1980 to 1989 (%) - Hispanic or Latino
Year householder moved into unit - Moved in 1980 to 1989 (%) - American Indian and Alaska Native
Year householder moved into unit - Moved in 1980 to 1989 (%) - Multirace
Year householder moved into unit - Moved in 1980 to 1989 (%) - Other Race
Year householder moved into unit - Moved in 1970 to 1979 (%)
Year householder moved into unit - Moved in 1970 to 1979 (%) - White
Year householder moved into unit - Moved in 1970 to 1979 (%) - Black or African American
Year householder moved into unit - Moved in 1970 to 1979 (%) - Asian
Year householder moved into unit - Moved in 1970 to 1979 (%) - Hispanic or Latino
Year householder moved into unit - Moved in 1970 to 1979 (%) - American Indian and Alaska Native
Year householder moved into unit - Moved in 1970 to 1979 (%) - Multirace
Year householder moved into unit - Moved in 1970 to 1979 (%) - Other Race
Year householder moved into unit - Moved in 1969 or earlier (%)
Year householder moved into unit - Moved in 1969 or earlier (%) - White
Year householder moved into unit - Moved in 1969 or earlier (%) - Black or African American
Year householder moved into unit - Moved in 1969 or earlier (%) - Asian
Year householder moved into unit - Moved in 1969 or earlier (%) - Hispanic or Latino
Year householder moved into unit - Moved in 1969 or earlier (%) - American Indian and Alaska Native
Year householder moved into unit - Moved in 1969 or earlier (%) - Multirace
Year householder moved into unit - Moved in 1969 or earlier (%) - Other Race
Housing units lacking complete plumbing facilities (%)
Housing units lacking complete kitchen facilities (%)
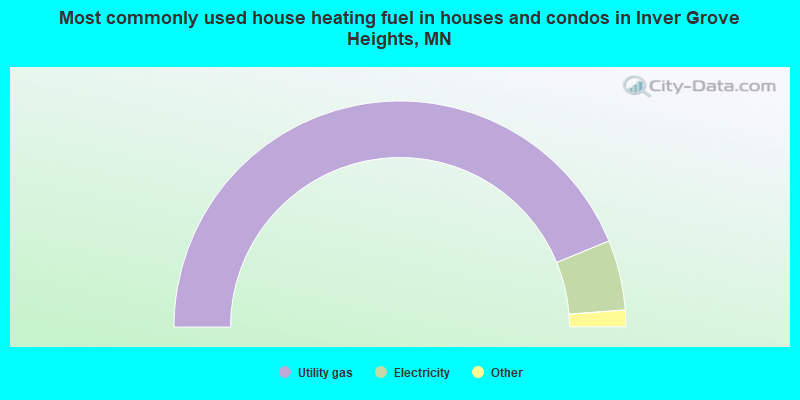
House heating fuel used in houses and condos - Utility gas (%)
House heating fuel used in houses and condos - Bottled, tank, or LP gas (%)
House heating fuel used in houses and condos - Electricity (%)
House heating fuel used in houses and condos - Fuel oil, kerosene, etc. (%)
House heating fuel used in houses and condos - Coal or coke (%)
House heating fuel used in houses and condos - Wood (%)
House heating fuel used in houses and condos - Solar energy (%)
House heating fuel used in houses and condos - Other fuel (%)
House heating fuel used in houses and condos - No fuel used (%)
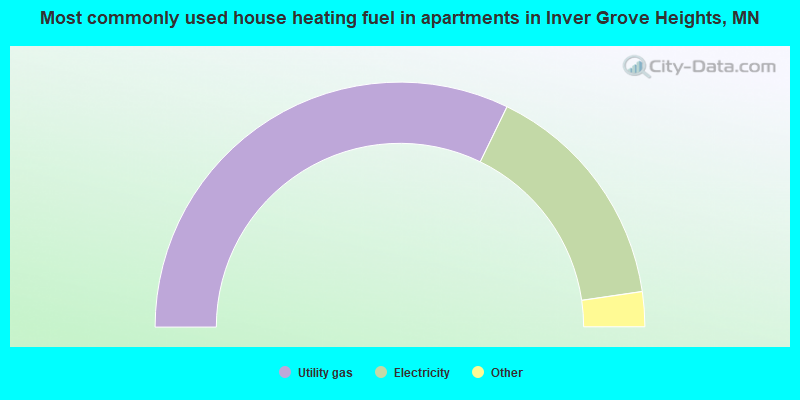
House heating fuel used in apartments - Utility gas (%)
House heating fuel used in apartments - Bottled, tank, or LP gas (%)
House heating fuel used in apartments - Electricity (%)
House heating fuel used in apartments - Fuel oil, kerosene, etc. (%)
House heating fuel used in apartments - Coal or coke (%)
House heating fuel used in apartments - Wood (%)
House heating fuel used in apartments - Solar energy (%)
House heating fuel used in apartments - Other fuel (%)
House heating fuel used in apartments - No fuel used (%)
Median year house/condo built: 1992Median year apartment built: 1991Household type by relationship:
Households: 36,011
Male householders: 7,334 (1,424 living alone ), Female householders: 7,527 (2,421 living alone )7,722 spouses (7,683 opposite-sex spouses ), 1,012 unmarried partners , (966 opposite-sex unmarried partners ), 10,397 children (9,646 natural , 410 adopted , 340 stepchildren ), 353 grandchildren , 244 brothers or sisters , 148 parents , 0 foster children , 245 other relatives , 813 non-relatives In group quarters: 210
Size of family households: 5,280 2-persons , 1,869 3-persons , 1,986 4-persons , 652 5-persons , 315 6-persons , 51 7-or-more-persons .
Size of nonfamily households: 3,863 1-person , 1,255 2-persons , 8 3-persons , 27 4-persons , 9 5-persons .
5,721 married couples with children. single-parent households (331 men , 1,207 women ).
86.7% of residents of Inver Grove Heights speak English at home. of residents speak Spanish at home (57% speak English very well , 25% speak English well , 18% speak English not well ).of residents speak other Indo-European language at home (70% speak English very well , 30% speak English well , 1% speak English not well ).of residents speak Asian or Pacific Island language at home (55% speak English very well , 35% speak English well , 10% speak English not well ).of residents speak other language at home (84% speak English very well , 12% speak English well , 4% speak English not well ).
Foreign born population: 3,580 (9.9%)of them are naturalized citizens )
Median number of rooms in houses and condos:
Median number of rooms in apartments
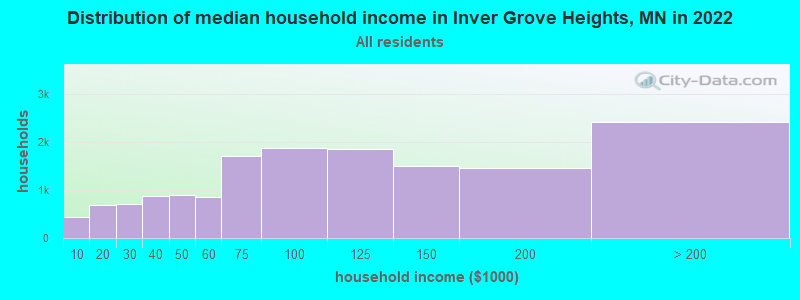
Inver Grove Heights, MN household income distribution 427 Less than $10,000681 $10,000 to $19,999706 $20,000 to $29,999868 $30,000 to $39,999900 $40,000 to $49,999859 $50,000 to $59,9991,708 $60,000 to $74,9991,870 $75,000 to $99,9991,852 $100,000 to $124,9991,499 $125,000 to $149,9991,456 $150,000 to $199,9992,413 $200,000 or more
Home value of owner - occupied houses in 2022 in Inver Grove Heights, MN 20 Less than $10,00057 $10,000 to $14,999118 $15,000 to $19,9997 $20,000 to $24,99945 $25,000 to $29,99939 $30,000 to $34,999109 $35,000 to $39,999132 $40,000 to $49,99954 $50,000 to $59,99943 $60,000 to $69,99991 $70,000 to $79,999160 $100,000 to $124,99949 $125,000 to $149,999178 $150,000 to $174,999434 $175,000 to $199,9991,081 $200,000 to $249,9991,240 $250,000 to $299,9992,557 $300,000 to $399,9991,963 $400,000 to $499,9991,948 $500,000 to $749,999599 $750,000 to $999,99951 $1,000,000 to $1,499,99913 $1,500,000 to $1,999,999Rent paid by renters in 2022 in Inver Grove Heights, MN 65 $100 to $14919 $150 to $19919 $200 to $2495 $250 to $29911 $300 to $34946 $450 to $49983 $500 to $54962 $550 to $59932 $600 to $64984 $650 to $69987 $700 to $749104 $750 to $799153 $800 to $899161 $900 to $9991,203 $1,000 to $1,249799 $1,250 to $1,4991,009 $1,500 to $1,99993 $2,000 to $2,49970 $2,500 to $2,99961 $3,500 or more165 No cash rent
Percentage of workers working in this county: 55.6%Number of people working at home: 5,116 (26.3% of all workers )
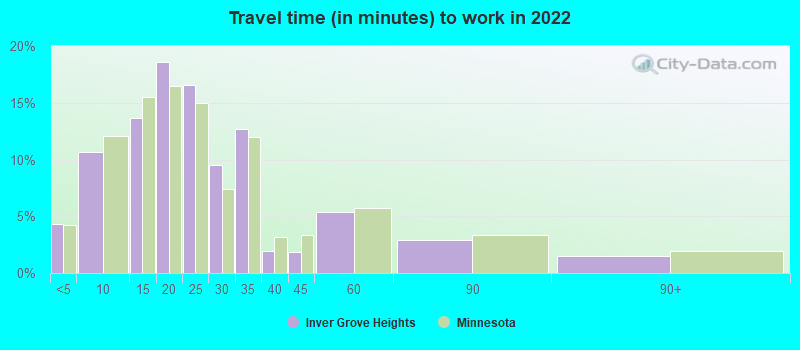
Travel time to work (commute)
Less than 5 minutes: 3425 to 9 minutes: 1,18710 to 14 minutes: 2,38015 to 19 minutes: 2,52820 to 24 minutes: 2,24725 to 29 minutes: 1,82830 to 34 minutes: 2,28335 to 39 minutes: 35840 to 44 minutes: 47945 to 59 minutes: 67460 to 89 minutes: 25890 or more minutes: 205
Means of transportation to work:
Drove a car alone: 7,555 (56.9%)Carpooled: 844 (6.4%)Bus : 13 (0.1%)Taxi: 120 (0.9%)Bicycle: 22 (0.2%)Walked: 138 (1.0%)Worked at home: 5,116 (38.5%)
Unemployment by race in 2022
Unemployment rate for White non-Hispanic residents 3.5% Males1.0% FemalesUnemployment rate for Asian residents 8.1% FemalesUnemployment rate for other race residents 3.2% Males6.3% FemalesUnemployment rate for two or more race residents 6.2% FemalesUnemployment rate for Hispanic or Latino residents 2.4% Males12.4% Females
Year of entry for the foreign-born population in Inver Grove Heights, Minnesota
1,296 2010 or later 786 2000 to 2009 1,001 1990 to 1999 336 1980 to 1989 140 1970 to 1979 131 Before 1970
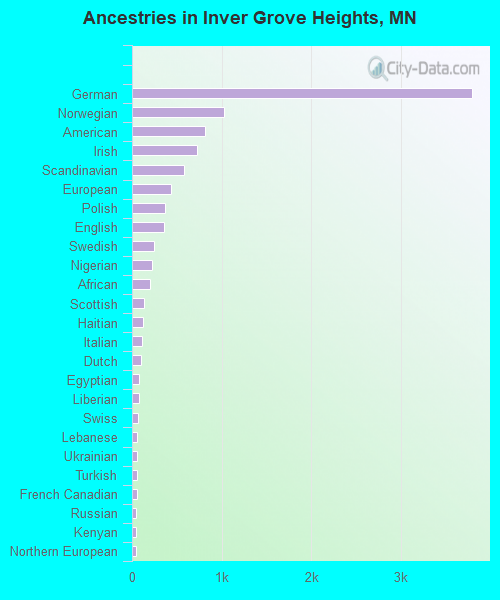
First ancestries reported:
German: 3,793 (24.2%)
Norwegian: 1,030 (6.6%)
American: 811 (5.2%)
Irish: 723 (4.6%)
Scandinavian: 576 (3.7%)
European: 437 (2.8%)
Polish: 371 (2.4%)
English: 354 (2.3%)
Swedish: 242 (1.5%)
Nigerian: 225 (1.4%)
African: 200 (1.3%)
Scottish: 132 (0.8%)
Haitian: 126 (0.8%)
Italian: 111 (0.7%)
Dutch: 98 (0.6%)
Egyptian: 82 (0.5%)
Liberian: 81 (0.5%)
Swiss: 65 (0.4%)
Lebanese: 61 (0.4%)
Ukrainian: 61 (0.4%)
Turkish: 58 (0.4%)
French Canadian: 53 (0.3%)
Russian: 47 (0.3%)
Kenyan: 47 (0.3%)
Northern European: 45 (0.3%)
Danish: 42 (0.3%)
Greek: 32 (0.2%)
Austrian: 31 (0.2%)
French: 28 (0.2%)
Czech: 27 (0.2%)
Scotch-Irish: 25 (0.2%)
Finnish: 25 (0.2%)
British: 23 (0.1%)
Eastern European: 23 (0.1%)
Somali: 21 (0.1%)
Slavic: 17 (0.1%)
Welsh: 17 (0.1%)
Jamaican: 13 (0.08%)
Romanian: 12 (0.08%)
Belgian: 11 (0.07%)
Hungarian: 10 (0.06%)
Slovene: 9 (0.06%)
Sudanese: 3 (0.02%) Most common places of birth for foreign-born residents (%): Mexico Inver Grove Heights:
25.0% (871)Minnesota:
12.1% (58,312)
Nigeria Inver Grove Heights:
10.6% (369)Minnesota:
1.7% (8,263)
El Salvador Inver Grove Heights:
7.3% (254)Minnesota:
1.4% (6,841)
Thailand Inver Grove Heights:
3.6% (127)Minnesota:
4.0% (19,333)
India Inver Grove Heights:
3.6% (126)Minnesota:
6.7% (32,141)
Vietnam Inver Grove Heights:
3.6% (125)Minnesota:
3.8% (18,442)
Philippines Inver Grove Heights:
3.0% (103)Minnesota:
2.0% (9,850)
Egypt Inver Grove Heights:
2.9% (102)Minnesota:
0.6% (2,929)
Germany Inver Grove Heights:
2.6% (89)Minnesota:
1.4% (6,670)
Australia Inver Grove Heights:
2.5% (88)Minnesota:
0.2% (1,001)
Africa, n.e.c. Inver Grove Heights:
2.5% (88)Minnesota:
0.6% (3,113)
Liberia Inver Grove Heights:
2.5% (88)Minnesota:
2.8% (13,695)
Bangladesh Inver Grove Heights:
2.4% (83)Minnesota:
0.2% (1,174)
Korea Inver Grove Heights:
2.3% (79)Minnesota:
2.4% (11,675)
Ukraine Inver Grove Heights:
2.0% (71)Minnesota:
1.0% (4,646)
Belarus Inver Grove Heights:
2.0% (69)Minnesota:
0.3% (1,358)
Iraq Inver Grove Heights:
1.7% (58)Minnesota:
0.5% (2,283)
Turkey Inver Grove Heights:
1.5% (53)Minnesota:
0.2% (981)
Place of birth for U.S.-born residents:
This state: 24,822Other state: 7,257Northeast: 506Midwest: 4,658South: 920West: 1,117 90.3% of Inver Grove Heights residents lived in the same house 1 years ago.
Out of people who lived in different houses, 23.4% lived in this county.
Out of people who lived in different counties, 92.3% lived in Minnesota.
Inver Grove Heights:
90.3%State average:
87.4%
Education attainment for males 25 years and older:
No schooling: 255Nursery to 4th grade: 05th and 6th grade: 287th and 8th grade: 859th grade: 10310th grade: 1111th grade: 5512th grade, no diploma: 90High school graduate (or equivalency): 2,851Less than 1 year of college: 879Some college more than 1 year, no degree: 1,794Associate degree: 1,294Bachelor's degree: 3,500Master's degree: 1,404Professional school degree: 240Doctorate degree: 48
Education attainment for females 25 years and older:
No schooling: 40Nursery to 4th grade: 95th and 6th grade: 997th and 8th grade: 729th grade: 6910th grade: 4611th grade: 2312th grade, no diploma: 160High school graduate (or equivalency): 3,115Less than 1 year of college: 618Some college more than 1 year, no degree: 1,534Associate degree: 1,268Bachelor's degree: 4,129Master's degree: 1,500Professional school degree: 290Doctorate degree: 218
Housing units in structures:
One, detached: 8,006One, attached: 3,313Two: 893 or 4: 3265 to 9: 31610 to 19: 61320 to 49: 72250 or more: 1,421Mobile homes: 716Median worth of mobile homes: $48,674
Housing units lacking complete plumbing facilities in 2022: 0.3%Housing units lacking complete kitchen facilities in 2022: 0.2%House/condo owner moved in on average 10 years ago
Renter moved in on average 4 years ago
Private vs. public school enrollment:
Students in private schools in grades 1 to 8 (elementary and middle school): 340 Students in private schools in grades 9 to 12 (high school): 189 Students in private undergraduate colleges: 354 Here:
28.2%Minnesota:
26.2%