Kansas City, KS (Kansas) Houses and Residents
Estimated median house or condo value in 2022: $170,000 (it was $51,900 in 2000 )
Kansas City:
$170,000Kansas:
$206,600
Lower value quartile - upper value quartile: $101,600 - $238,000Mean price in 2022: Detached houses: $192,157 Here:
$192,157State:
$264,181
Townhouses or other attached units: $165,411 Here:
$165,411State:
$219,178
In 2-unit structures: $253,308 Here:
$253,308State:
$190,919
In 3-to-4-unit structures: $122,001 Here:
$122,001State:
$161,859
In 5-or-more-unit structures: $115,252 Here:
$115,252State:
$267,030
Mobile homes: $53,717 Here:
$53,717State:
$74,712
Occupied boats, RVs, vans, etc.: $45,484 Here:
$45,484State:
$32,385
Total population: 149,636 (Urban population: 140,843, Rural population: 6,024 (160 farm, 5,864 nonfarm ))
Houses: 63,991 (57,714 occupied: 34,384 owner occupied, 23,330 renter occupied )
% of renters here:
40%State:
32%
Housing density: 515 houses/condos per square mile
Median price asked for vacant for-sale houses and condos in 2022: $158,028.
Median contract rent in 2022: $796 (lower quartile is $603, upper quartile is $969)
Median rent asked for vacant for-rent units in 2022: $1,159
Median gross rent in Kansas City, KS in 2022: $1,054
Housing units in Kansas City with a mortgage: 19,005 (1,073 second mortgage, 0 home equity loan, 818 both second mortgage and home equity loan )Houses without a mortgage: 456
Median household income for houses/condos with a mortgage: $81,017
Median household income for apartments without a mortgage: $49,424
Median monthly housing costs: $1,035
Data:
Median house or condo value ($)
Median house or condo value ($ change since 2000)
Median house or condo value ($) - White
Median house or condo value ($) - Black or African American
Median house or condo value ($) - Asian
Median house or condo value ($) - Hispanic or Latino
Median house or condo value ($) - American Indian and Alaska Native
Median house or condo value ($) - Multirace
Median house or condo value ($) - Other Race
Median price asked for mobile homes ($)
Household density (households per square mile)
Mean house or condo value by units in structure - 1, detached ($)
Mean house or condo value by units in structure - 1, attached ($)
Mean house or condo value by units in structure - 2 ($)
Mean house or condo value by units in structure by units in structure - 3 or 4 ($)
Mean house or condo value by units in structure - 5 or more ($)
Mean house or condo value by units in structure - Boat, RV, van, etc. ($)
Mean house or condo value by units in structure - Mobile home ($)
Median contract rent ($)
Median contract rent - Lower quartile ($)
Median contract rent - Upper quartile ($)
Median gross rent ($)
Urban houses (%)
Rural houses (%)
Houses occupied (%)
Houses occupied (% change since 2000)
Houses owner occupied (%)
Houses owner occupied (% change since 2000)
Houses renter occupied (%)
Houses renter occupied (% change since 2000)
Vacant housing units - For rent (%)
Vacant housing units - For rent (% change since 2000)
Vacant housing units - For sale only (%)
Vacant housing units - For sale only (% change since 2000)
Vacant housing units - Rented or sold, not occupied (%)
Vacant housing units - Rented or sold, not occupied (% change since 2000)
Vacant housing units - For seasonal, recreational, or occasional use (%)
Vacant housing units - For seasonal, recreational, or occasional use (% change since 2000)
Vacant housing units - For migrant workers (%)
Vacant housing units - For migrant workers (% change since 2000)
Vacant housing units - Other vacant (%)
Vacant housing units - Other vacant (% change since 2000)
Median monthly housing costs ($)
Median household income for houses/condos with a mortgage ($)
Median household income for houses/condos without a mortgage ($)
Median household income ($)
Median household income ($) - White
Median household income ($) - Black or African American
Median household income ($) - Asian
Median household income ($) - Hispanic or Latino
Median household income ($) - American Indian and Alaska Native
Median household income ($) - Multirace
Median household income ($) - Other Race
Mortgage status - with mortgage (%)
Mortgage status - with second mortgage (%)
Mortgage status - with home equity loan (%)
Mortgage status - with both second mortgage and home equity loan (%)
Mortgage status - without a mortgage (%)
Median year house/condo built
Median year apartment built
Household type by relationship - Male householder living alone (%)
Household type by relationship - Male householder not living alone (%)
Household type by relationship - Female householder living alone (%)
Household type by relationship - Female householder not living alone (%)
Household type by relationship - Opposite-Sex spouse (%)
Household type by relationship - Same-Sex spouse (%)
Household type by relationship - Opposite-Sex unmarried partner (%)
Household type by relationship - Same-Sex unmarried partner (%)
Household type by relationship - In group quarters (%)
Size of family households - 2-person household (%)
Size of family households - 3-person household (%)
Size of family households - 4-person household (%)
Size of family households - 5-person household (%)
Size of family households - 6-person household (%)
Size of family households - 7-or-more-person household (%)
Size of nonfamily households - 1-person household (%)
Size of nonfamily households - 2-person household (%)
Size of nonfamily households - 3-person household (%)
Size of nonfamily households - 4-person household (%)
Size of nonfamily households - 5-person household (%)
Size of nonfamily households - 6-person household (%)
Size of nonfamily households - 7-or-moreperson household (%)
Year house built - Built 2010 or later (%)
Year house built - Built 2000 to 2009 (%)
Year house built - Built 1990 to 1999 (%)
Year house built - Built 1980 to 1989 (%)
Year house built - Built 1970 to 1979 (%)
Year house built - Built 1960 to 1969 (%)
Year house built - Built 1950 to 1959 (%)
Year house built - Built 1940 to 1949 (%)
Year house built - Built 1939 or earlier (%)
Median number of rooms in houses and condos
Median number of rooms in apartments
Median number of bedrooms in owner occupied houses
Mean number of bedrooms in owner occupied houses
Median number of bedrooms in renter occupied houses
Mean number of bedrooms in renter occupied houses
Median number of vehichles in owner occupied houses
Mean number of vehichles in owner occupied houses
Median number of vehichles in renter occupied houses
Mean number of vehichles in renter occupied houses
Rooms in owner-occupied houses - 1 room (%)
Rooms in owner-occupied houses - 2 rooms (%)
Rooms in owner-occupied houses - 3 rooms (%)
Rooms in owner-occupied houses - 4 rooms (%)
Rooms in owner-occupied houses - 5 rooms (%)
Rooms in owner-occupied houses - 6 rooms (%)
Rooms in owner-occupied houses - 7 rooms (%)
Rooms in owner-occupied houses - 8 rooms (%)
Rooms in owner-occupied houses - 9+ rooms (%)
Rooms in renter-occupied houses - 1 room (%)
Rooms in renter-occupied houses - 2 rooms (%)
Rooms in renter-occupied houses - 3 rooms (%)
Rooms in renter-occupied houses - 4 rooms (%)
Rooms in renter-occupied houses - 5 rooms (%)
Rooms in renter-occupied houses - 6 rooms (%)
Rooms in renter-occupied houses - 7 rooms (%)
Rooms in renter-occupied houses - 8 rooms (%)
Rooms in renter-occupied houses - 9+ rooms (%)
Bedrooms in owner-occupied houses - no bedrooms (%)
Bedrooms in owner-occupied houses - 1 bedroom (%)
Bedrooms in owner-occupied houses - 2 bedrooms (%)
Bedrooms in owner-occupied houses - 3 bedrooms (%)
Bedrooms in owner-occupied houses - 4 bedrooms (%)
Bedrooms in owner-occupied houses - 5+ bedrooms (%)
Bedrooms in renter-occupied houses - no bedrooms (%)
Bedrooms in renter-occupied houses - 1 bedroom (%)
Bedrooms in renter-occupied houses - 2 bedrooms (%)
Bedrooms in renter-occupied houses - 3 bedrooms (%)
Bedrooms in renter-occupied houses - 4 bedrooms (%)
Bedrooms in renter-occupied houses - 5+ bedrooms (%)
Vehicles available in owner-occupied houses - no vehicle available (%)
Vehicles available in owner-occupied houses - 1 vehicle available(%)
Vehicles available in owner-occupied houses - 2 Vehicles available (%)
Vehicles available in owner-occupied houses - 3 Vehicles available (%)
Vehicles available in owner-occupied houses - 4 Vehicles available (%)
Vehicles available in owner-occupied houses - 5+ Vehicles available (%)
Vehicles available in renter-occupied houses - no vehicle available (%)
Vehicles available in renter-occupied houses - 1 vehicle available (%)
Vehicles available in renter-occupied houses - 2 Vehicles available (%)
Vehicles available in renter-occupied houses - 3 Vehicles available (%)
Vehicles available in renter-occupied houses - 4 Vehicles available (%)
Vehicles available in renter-occupied houses - 5+ Vehicles available (%)
Housing units in structures - 1, detached (%)
Housing units in structures - 1, attached (%)
Housing units in structures - 2 (%)
Housing units in structures - 3 or 4 (%)
Housing units in structures - 5 to 9 (%)
Housing units in structures - 10 to 19 (%)
Housing units in structures - 20 to 49 (%)
Housing units in structures - 50 or more (%)
Housing units in structures - Mobile home (%)
Housing units in structures - Boat, RV, van, etc. (%)
Housing units in structures - Owners - 1, detached (%)
Housing units in structures - Owners - 1, attached (%)
Housing units in structures - Owners - 2 (%)
Housing units in structures - Owners - 3 or 4 (%)
Housing units in structures - Owners - 5 to 9 (%)
Housing units in structures - Owners - 10 to 19 (%)
Housing units in structures - Owners - 20 to 49 (%)
Housing units in structures - Owners - 50 or more (%)
Housing units in structures - Owners - Mobile home (%)
Housing units in structures - Owners - Boat, RV, van, etc. (%)
Housing units in structures - Renters - 1, detached (%)
Housing units in structures - Renters - 1, attached (%)
Housing units in structures - Renters - 2 (%)
Housing units in structures - Renters - 3 or 4 (%)
Housing units in structures - Renters - 5 to 9 (%)
Housing units in structures - Renters - 10 to 19 (%)
Housing units in structures - Renters - 20 to 49 (%)
Housing units in structures - Renters - 50 or more (%)
Housing units in structures - Renters - Mobile home (%)
Housing units in structures - Renters - Boat, RV, van, etc. (%)
House/condo owner moved in on average (years ago)
Renter moved in on average (years ago)
Year householder moved into unit - Moved in 1999 to March 2000 (%)
Year householder moved into unit - Moved in 1999 to March 2000 (%) - White
Year householder moved into unit - Moved in 1999 to March 2000 (%) - Black or African American
Year householder moved into unit - Moved in 1999 to March 2000 (%) - Asian
Year householder moved into unit - Moved in 1999 to March 2000 (%) - Hispanic or Latino
Year householder moved into unit - Moved in 1999 to March 2000 (%) - American Indian and Alaska Native
Year householder moved into unit - Moved in 1999 to March 2000 (%) - Multirace
Year householder moved into unit - Moved in 1999 to March 2000 (%) - Other Race
Year householder moved into unit - Moved in 1995 to 1998 (%)
Year householder moved into unit - Moved in 1995 to 1998 (%) - White
Year householder moved into unit - Moved in 1995 to 1998 (%) - Black or African American
Year householder moved into unit - Moved in 1995 to 1998 (%) - Asian
Year householder moved into unit - Moved in 1995 to 1998 (%) - Hispanic or Latino
Year householder moved into unit - Moved in 1995 to 1998 (%) - American Indian and Alaska Native
Year householder moved into unit - Moved in 1995 to 1998 (%) - Multirace
Year householder moved into unit - Moved in 1995 to 1998 (%) - Other Race
Year householder moved into unit - Moved in 1990 to 1994 (%)
Year householder moved into unit - Moved in 1990 to 1994 (%) - White
Year householder moved into unit - Moved in 1990 to 1994 (%) - Black or African American
Year householder moved into unit - Moved in 1990 to 1994 (%) - Asian
Year householder moved into unit - Moved in 1990 to 1994 (%) - Hispanic or Latino
Year householder moved into unit - Moved in 1990 to 1994 (%) - American Indian and Alaska Native
Year householder moved into unit - Moved in 1990 to 1994 (%) - Multirace
Year householder moved into unit - Moved in 1990 to 1994 (%) - Other Race
Year householder moved into unit - Moved in 1980 to 1989 (%)
Year householder moved into unit - Moved in 1980 to 1989 (%) - White
Year householder moved into unit - Moved in 1980 to 1989 (%) - Black or African American
Year householder moved into unit - Moved in 1980 to 1989 (%) - Asian
Year householder moved into unit - Moved in 1980 to 1989 (%) - Hispanic or Latino
Year householder moved into unit - Moved in 1980 to 1989 (%) - American Indian and Alaska Native
Year householder moved into unit - Moved in 1980 to 1989 (%) - Multirace
Year householder moved into unit - Moved in 1980 to 1989 (%) - Other Race
Year householder moved into unit - Moved in 1970 to 1979 (%)
Year householder moved into unit - Moved in 1970 to 1979 (%) - White
Year householder moved into unit - Moved in 1970 to 1979 (%) - Black or African American
Year householder moved into unit - Moved in 1970 to 1979 (%) - Asian
Year householder moved into unit - Moved in 1970 to 1979 (%) - Hispanic or Latino
Year householder moved into unit - Moved in 1970 to 1979 (%) - American Indian and Alaska Native
Year householder moved into unit - Moved in 1970 to 1979 (%) - Multirace
Year householder moved into unit - Moved in 1970 to 1979 (%) - Other Race
Year householder moved into unit - Moved in 1969 or earlier (%)
Year householder moved into unit - Moved in 1969 or earlier (%) - White
Year householder moved into unit - Moved in 1969 or earlier (%) - Black or African American
Year householder moved into unit - Moved in 1969 or earlier (%) - Asian
Year householder moved into unit - Moved in 1969 or earlier (%) - Hispanic or Latino
Year householder moved into unit - Moved in 1969 or earlier (%) - American Indian and Alaska Native
Year householder moved into unit - Moved in 1969 or earlier (%) - Multirace
Year householder moved into unit - Moved in 1969 or earlier (%) - Other Race
Housing units lacking complete plumbing facilities (%)
Housing units lacking complete kitchen facilities (%)
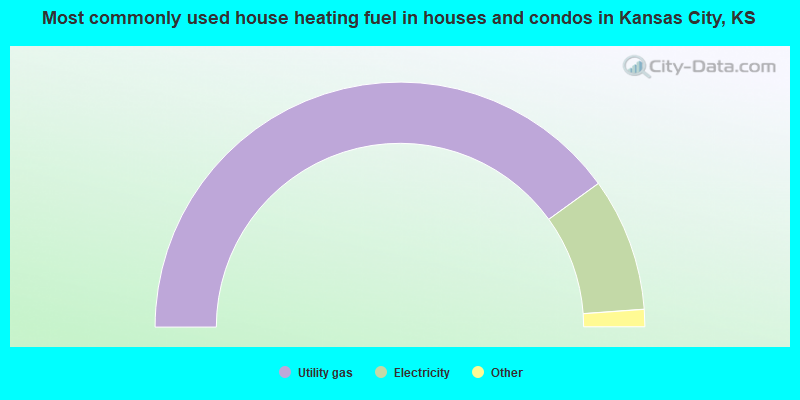
House heating fuel used in houses and condos - Utility gas (%)
House heating fuel used in houses and condos - Bottled, tank, or LP gas (%)
House heating fuel used in houses and condos - Electricity (%)
House heating fuel used in houses and condos - Fuel oil, kerosene, etc. (%)
House heating fuel used in houses and condos - Coal or coke (%)
House heating fuel used in houses and condos - Wood (%)
House heating fuel used in houses and condos - Solar energy (%)
House heating fuel used in houses and condos - Other fuel (%)
House heating fuel used in houses and condos - No fuel used (%)
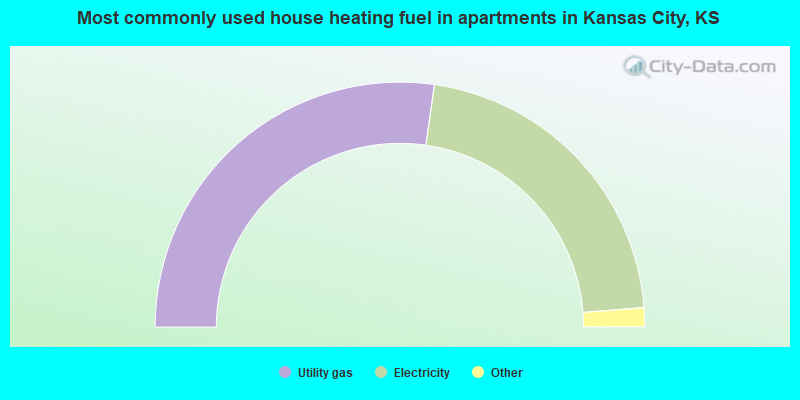
House heating fuel used in apartments - Utility gas (%)
House heating fuel used in apartments - Bottled, tank, or LP gas (%)
House heating fuel used in apartments - Electricity (%)
House heating fuel used in apartments - Fuel oil, kerosene, etc. (%)
House heating fuel used in apartments - Coal or coke (%)
House heating fuel used in apartments - Wood (%)
House heating fuel used in apartments - Solar energy (%)
House heating fuel used in apartments - Other fuel (%)
House heating fuel used in apartments - No fuel used (%)
Median year house/condo built: 1961Median year apartment built: 1973Household type by relationship:
Households: 152,561
Male householders: 27,623 (9,567 living alone ), Female householders: 30,091 (8,729 living alone )20,687 spouses (20,402 opposite-sex spouses ), 5,141 unmarried partners , (4,967 opposite-sex unmarried partners ), 45,468 children (43,825 natural , 671 adopted , 972 stepchildren ), 6,613 grandchildren , 2,201 brothers or sisters , 2,294 parents , 67 foster children , 4,923 other relatives , 6,123 non-relatives In group quarters: 1,330
Size of family households: 14,115 2-persons , 9,284 3-persons , 5,347 4-persons , 3,945 5-persons , 1,819 6-persons , 919 7-or-more-persons .
Size of nonfamily households: 18,296 1-person , 3,191 2-persons , 292 3-persons , 443 4-persons , 63 5-persons .
17,653 married couples with children. single-parent households (4,196 men , 9,496 women ).
69.5% of residents of Kansas City speak English at home. of residents speak Spanish at home (53% speak English very well , 19% speak English well , 19% speak English not well , 9% don't speak English at all ).of residents speak other Indo-European language at home (66% speak English very well , 10% speak English well , 21% speak English not well , 3% don't speak English at all ).of residents speak Asian or Pacific Island language at home (40% speak English very well , 21% speak English well , 26% speak English not well , 13% don't speak English at all ).of residents speak other language at home (36% speak English very well , 19% speak English well , 18% speak English not well , 27% don't speak English at all ).
Foreign born population: 24,816 (16.3%)of them are naturalized citizens )
Median number of rooms in houses and condos:
Median number of rooms in apartments
Owner-occupied Renter-occupied
Bedrooms in owner-occupied houses and condos in Kansas City, Kansas
198 no bedroom 689 1 bedroom 7,693 2 bedrooms 19,258 3 bedrooms 4,779 4 bedrooms 1,767 5+ bedrooms
Bedrooms in renter-occupied apartments in Kansas City, Kansas
1,187 no bedroom 4,989 1 bedroom 10,309 2 bedrooms 4,802 3 bedrooms 1,769 4 bedrooms 274 5+ bedrooms
Owner-occupied Renter-occupied
Rooms in owner-occupied houses in Kansas City, Kansas
150 1 room 0 2 rooms 1,107 3 rooms 3,637 4 rooms 8,000 5 rooms 8,170 6 rooms 5,294 7 rooms 3,074 8 rooms 4,952 9+ rooms
Rooms in renter-occupied apartments in Kansas City, Kansas
1,187 1 room 1,433 2 rooms 3,941 3 rooms 6,513 4 rooms 4,215 5 rooms 3,204 6 rooms 1,889 7 rooms 429 8 rooms 519 9+ rooms
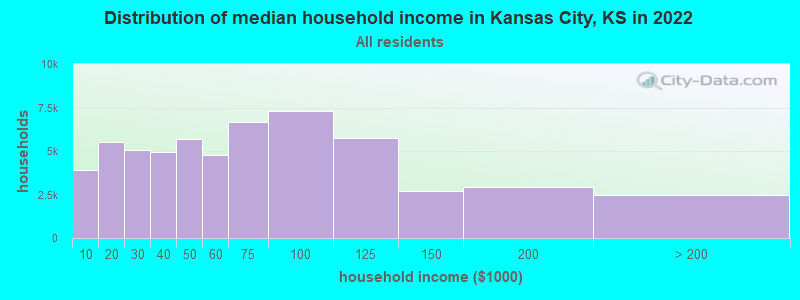
Kansas City, KS household income distribution 3,880 Less than $10,0005,507 $10,000 to $19,9995,059 $20,000 to $29,9994,941 $30,000 to $39,9995,707 $40,000 to $49,9994,773 $50,000 to $59,9996,654 $60,000 to $74,9997,285 $75,000 to $99,9995,766 $100,000 to $124,9992,700 $125,000 to $149,9992,943 $150,000 to $199,9992,499 $200,000 or more
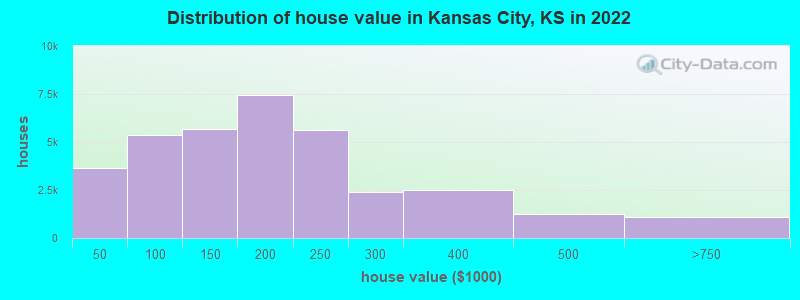
Home value of owner - occupied houses in 2022 in Kansas City, KS 789 Less than $10,000972 $10,000 to $14,999178 $15,000 to $19,999187 $20,000 to $24,999296 $25,000 to $29,999597 $30,000 to $34,999604 $40,000 to $49,999881 $50,000 to $59,999458 $60,000 to $69,9991,212 $70,000 to $79,9991,431 $80,000 to $89,999781 $90,000 to $99,9993,312 $100,000 to $124,9992,378 $125,000 to $149,9993,889 $150,000 to $174,9993,547 $175,000 to $199,9995,633 $200,000 to $249,9992,402 $250,000 to $299,9992,480 $300,000 to $399,9991,254 $400,000 to $499,999993 $500,000 to $749,99943 $1,000,000 to $1,499,99967 $1,500,000 to $1,999,999Rent paid by renters in 2022 in Kansas City, KS 450 Less than $100266 $100 to $149384 $150 to $199277 $200 to $249312 $250 to $29957 $300 to $349634 $350 to $399296 $400 to $4491,097 $450 to $499573 $500 to $5491,040 $550 to $599747 $600 to $6491,484 $650 to $6991,773 $700 to $7491,582 $750 to $7993,093 $800 to $8993,267 $900 to $9991,770 $1,000 to $1,249875 $1,250 to $1,4991,277 $1,500 to $1,999167 $2,000 to $2,499137 $2,500 to $2,999181 $3,500 or more1,591 No cash rent
Percentage of workers working in this county: 57.2%Number of people working at home: 6,667 (9.4% of all workers )
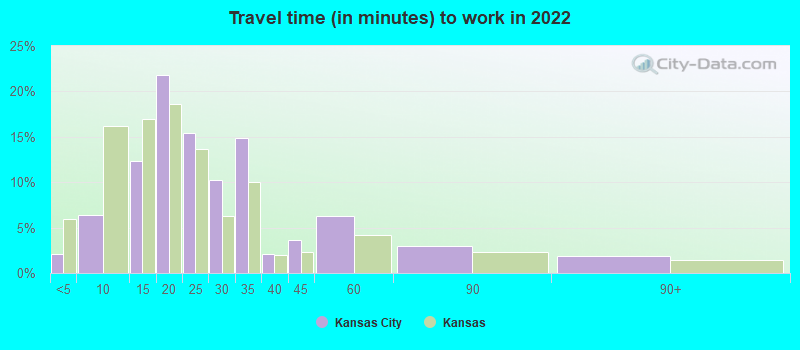
Travel time to work (commute)
Less than 5 minutes: 8795 to 9 minutes: 4,83410 to 14 minutes: 9,36815 to 19 minutes: 15,76620 to 24 minutes: 12,41725 to 29 minutes: 6,91730 to 34 minutes: 9,70535 to 39 minutes: 1,56140 to 44 minutes: 1,72345 to 59 minutes: 1,71260 to 89 minutes: 84190 or more minutes: 259
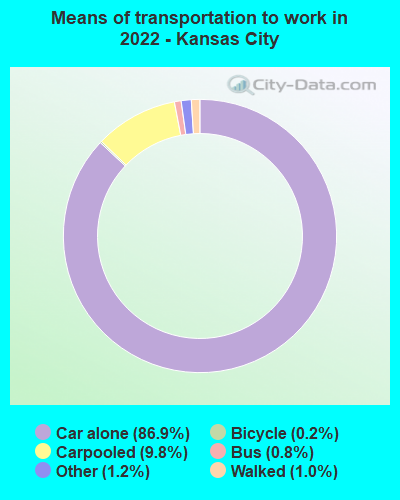
Means of transportation to work:
Drove a car alone: 70,199 (79.1%)Carpooled: 8,031 (9.0%)Bus : 733 (0.8%)Taxi: 1,180 (1.3%)Bicycle: 179 (0.2%)Walked: 864 (1.0%)Worked at home: 6,667 (7.5%)
Unemployment by race in 2022
Unemployment rate for White non-Hispanic residents 3.5% Males3.6% FemalesUnemployment rate for Black residents 8.6% Males1.7% FemalesUnemployment rate for American Indian and Alaska Native residents 2.3% MalesUnemployment rate for Asian residents 1.1% Males4.1% FemalesUnemployment rate for other race residents 4.3% Males13.1% FemalesUnemployment rate for two or more race residents 10.3% Males2.2% FemalesUnemployment rate for Hispanic or Latino residents 5.3% Males7.1% Females
Year of entry for the foreign-born population in Kansas City, Kansas
10,526 2010 or later 9,469 2000 to 2009 4,956 1990 to 1999 3,112 1980 to 1989 1,296 1970 to 1979 849 Before 1970
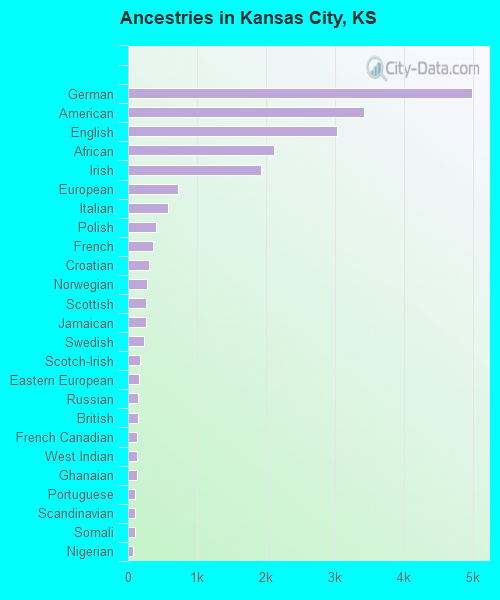
First ancestries reported:
German: 4,988 (5.9%)
American: 3,421 (4.0%)
English: 3,039 (3.6%)
African: 2,117 (2.5%)
Irish: 1,936 (2.3%)
European: 732 (0.9%)
Italian: 587 (0.7%)
Polish: 401 (0.5%)
French: 357 (0.4%)
Croatian: 305 (0.4%)
Norwegian: 279 (0.3%)
Scottish: 265 (0.3%)
Jamaican: 257 (0.3%)
Swedish: 228 (0.3%)
Scotch-Irish: 175 (0.2%)
Eastern European: 160 (0.2%)
Russian: 149 (0.2%)
British: 138 (0.2%)
French Canadian: 137 (0.2%)
West Indian: 131 (0.2%)
Ghanaian: 130 (0.2%)
Portuguese: 107 (0.1%)
Scandinavian: 99 (0.1%)
Somali: 95 (0.1%)
Nigerian: 66 (0.08%)
Slovene: 63 (0.07%)
Armenian: 60 (0.07%)
Moroccan: 57 (0.07%)
Basque: 56 (0.07%)
Dutch: 54 (0.06%)
Haitian: 49 (0.06%)
Serbian: 47 (0.06%)
Liberian: 39 (0.05%)
Ethiopian: 38 (0.04%)
Danish: 36 (0.04%)
Arab: 35 (0.04%)
Israeli: 32 (0.04%)
Greek: 32 (0.04%)
Canadian: 31 (0.04%)
Northern European: 31 (0.04%)
Ukrainian: 30 (0.04%)
Yugoslavian: 29 (0.03%)
Austrian: 28 (0.03%)
Belgian: 25 (0.03%)
Kenyan: 25 (0.03%)
Australian: 24 (0.03%)
Welsh: 24 (0.03%)
Czech: 22 (0.03%)
Brazilian: 20 (0.02%)
Iraqi: 16 (0.02%)
Sudanese: 16 (0.02%)
Czechoslovakian: 11 (0.01%)
Barbadian: 11 (0.01%)
Slavic: 9 (0.01%)
Romanian: 9 (0.01%)
Egyptian: 9 (0.01%)
Swiss: 9 (0.01%)
German Russian: 8 (0.01%)
Palestinian: 7 (0.01%)
Slovak: 6 (0.01%)
Most common places of birth for foreign-born residents (%): Mexico Kansas City:
53.8% (15,086)Kansas:
39.2% (81,282)
Burma (Myanmar) Kansas City:
7.1% (1,983)Kansas:
1.4% (2,831)
Guatemala Kansas City:
6.7% (1,885)Kansas:
3.5% (7,355)
Honduras Kansas City:
6.7% (1,874)Kansas:
1.6% (3,353)
Laos Kansas City:
2.8% (789)Kansas:
1.5% (3,082)
El Salvador Kansas City:
2.7% (770)Kansas:
2.2% (4,488)
Place of birth for U.S.-born residents:
This state: 82,205Other state: 43,878Northeast: 1,466Midwest: 23,563South: 10,269West: 8,580 86.1% of Kansas City residents lived in the same house 1 years ago.
Out of people who lived in different houses, 32.9% lived in this county.
Out of people who lived in different counties, 46.3% lived in Kansas.
Kansas City:
86.1%State average:
85.3%
Education attainment for males 25 years and older:
No schooling: 1,811Nursery to 4th grade: 7275th and 6th grade: 1,0447th and 8th grade: 1,5969th grade: 69110th grade: 65711th grade: 56012th grade, no diploma: 1,348High school graduate (or equivalency): 16,010Less than 1 year of college: 3,118Some college more than 1 year, no degree: 6,972Associate degree: 4,192Bachelor's degree: 5,812Master's degree: 2,679Professional school degree: 691Doctorate degree: 543
Education attainment for females 25 years and older:
No schooling: 2,427Nursery to 4th grade: 975th and 6th grade: 5527th and 8th grade: 3409th grade: 1,21510th grade: 1,11211th grade: 85112th grade, no diploma: 874High school graduate (or equivalency): 14,406Less than 1 year of college: 3,306Some college more than 1 year, no degree: 7,164Associate degree: 5,112Bachelor's degree: 7,284Master's degree: 3,696Professional school degree: 579Doctorate degree: 295
Housing units in structures:
One, detached: 41,908One, attached: 6,462Two: 1,1443 or 4: 2,3305 to 9: 2,14810 to 19: 3,79220 to 49: 1,35750 or more: 3,436Mobile homes: 1,307Boats, RVs, vans, etc.: 107Median worth of mobile homes: $18,582
Housing units lacking complete plumbing facilities in 2022: 2.4%Housing units lacking complete kitchen facilities in 2022: 3.6%House/condo owner moved in on average 12 years ago
Renter moved in on average 3 years ago
Private vs. public school enrollment:
Students in private schools in grades 1 to 8 (elementary and middle school): 2,420 Students in private schools in grades 9 to 12 (high school): 727 Students in private undergraduate colleges: 1,391