Kenner, LA (Louisiana) Houses and Residents
Estimated median house or condo value in 2022: $257,000 (it was $108,800 in 2000 )
Kenner:
$257,000Louisiana:
$209,200
Lower value quartile - upper value quartile: $179,900 - $340,000Mean price in 2022: Detached houses: $302,902 Here:
$302,902State:
$273,555
Townhouses or other attached units: $200,864 Here:
$200,864State:
$297,713
In 5-or-more-unit structures: $126,534 Here:
$126,534State:
$257,054
Mobile homes: $162,105 Here:
$162,105State:
$89,857
Total population: 67,064 (All urban)
Houses: 28,654 (26,635 occupied: 16,296 owner occupied, 10,339 renter occupied )
% of renters here:
39%State:
32%
Housing density: 1,893 houses/condos per square mile
Median price asked for vacant for-sale houses and condos in 2022: $365,523.
Median contract rent in 2022: $934 (lower quartile is $792, upper quartile is $1,141)
Median rent asked for vacant for-rent units in 2022: $756
Median gross rent in Kenner, LA in 2022: $1,092
Housing units in Kenner with a mortgage: 9,229 (1,117 second mortgage, 459 home equity loan, 568 both second mortgage and home equity loan )Houses without a mortgage: 138
Median household income for houses/condos with a mortgage: $100,561
Median household income for apartments without a mortgage: $66,532
Median monthly housing costs: $1,078
Data:
Median house or condo value ($)
Median house or condo value ($ change since 2000)
Median house or condo value ($) - White
Median house or condo value ($) - Black or African American
Median house or condo value ($) - Asian
Median house or condo value ($) - Hispanic or Latino
Median house or condo value ($) - American Indian and Alaska Native
Median house or condo value ($) - Multirace
Median house or condo value ($) - Other Race
Median price asked for mobile homes ($)
Household density (households per square mile)
Mean house or condo value by units in structure - 1, detached ($)
Mean house or condo value by units in structure - 1, attached ($)
Mean house or condo value by units in structure - 2 ($)
Mean house or condo value by units in structure by units in structure - 3 or 4 ($)
Mean house or condo value by units in structure - 5 or more ($)
Mean house or condo value by units in structure - Boat, RV, van, etc. ($)
Mean house or condo value by units in structure - Mobile home ($)
Median contract rent ($)
Median contract rent - Lower quartile ($)
Median contract rent - Upper quartile ($)
Median gross rent ($)
Urban houses (%)
Rural houses (%)
Houses occupied (%)
Houses occupied (% change since 2000)
Houses owner occupied (%)
Houses owner occupied (% change since 2000)
Houses renter occupied (%)
Houses renter occupied (% change since 2000)
Vacant housing units - For rent (%)
Vacant housing units - For rent (% change since 2000)
Vacant housing units - For sale only (%)
Vacant housing units - For sale only (% change since 2000)
Vacant housing units - Rented or sold, not occupied (%)
Vacant housing units - Rented or sold, not occupied (% change since 2000)
Vacant housing units - For seasonal, recreational, or occasional use (%)
Vacant housing units - For seasonal, recreational, or occasional use (% change since 2000)
Vacant housing units - For migrant workers (%)
Vacant housing units - For migrant workers (% change since 2000)
Vacant housing units - Other vacant (%)
Vacant housing units - Other vacant (% change since 2000)
Median monthly housing costs ($)
Median household income for houses/condos with a mortgage ($)
Median household income for houses/condos without a mortgage ($)
Median household income ($)
Median household income ($) - White
Median household income ($) - Black or African American
Median household income ($) - Asian
Median household income ($) - Hispanic or Latino
Median household income ($) - American Indian and Alaska Native
Median household income ($) - Multirace
Median household income ($) - Other Race
Mortgage status - with mortgage (%)
Mortgage status - with second mortgage (%)
Mortgage status - with home equity loan (%)
Mortgage status - with both second mortgage and home equity loan (%)
Mortgage status - without a mortgage (%)
Median year house/condo built
Median year apartment built
Household type by relationship - Male householder living alone (%)
Household type by relationship - Male householder not living alone (%)
Household type by relationship - Female householder living alone (%)
Household type by relationship - Female householder not living alone (%)
Household type by relationship - Opposite-Sex spouse (%)
Household type by relationship - Same-Sex spouse (%)
Household type by relationship - Opposite-Sex unmarried partner (%)
Household type by relationship - Same-Sex unmarried partner (%)
Household type by relationship - In group quarters (%)
Size of family households - 2-person household (%)
Size of family households - 3-person household (%)
Size of family households - 4-person household (%)
Size of family households - 5-person household (%)
Size of family households - 6-person household (%)
Size of family households - 7-or-more-person household (%)
Size of nonfamily households - 1-person household (%)
Size of nonfamily households - 2-person household (%)
Size of nonfamily households - 3-person household (%)
Size of nonfamily households - 4-person household (%)
Size of nonfamily households - 5-person household (%)
Size of nonfamily households - 6-person household (%)
Size of nonfamily households - 7-or-moreperson household (%)
Year house built - Built 2010 or later (%)
Year house built - Built 2000 to 2009 (%)
Year house built - Built 1990 to 1999 (%)
Year house built - Built 1980 to 1989 (%)
Year house built - Built 1970 to 1979 (%)
Year house built - Built 1960 to 1969 (%)
Year house built - Built 1950 to 1959 (%)
Year house built - Built 1940 to 1949 (%)
Year house built - Built 1939 or earlier (%)
Median number of rooms in houses and condos
Median number of rooms in apartments
Median number of bedrooms in owner occupied houses
Mean number of bedrooms in owner occupied houses
Median number of bedrooms in renter occupied houses
Mean number of bedrooms in renter occupied houses
Median number of vehichles in owner occupied houses
Mean number of vehichles in owner occupied houses
Median number of vehichles in renter occupied houses
Mean number of vehichles in renter occupied houses
Rooms in owner-occupied houses - 1 room (%)
Rooms in owner-occupied houses - 2 rooms (%)
Rooms in owner-occupied houses - 3 rooms (%)
Rooms in owner-occupied houses - 4 rooms (%)
Rooms in owner-occupied houses - 5 rooms (%)
Rooms in owner-occupied houses - 6 rooms (%)
Rooms in owner-occupied houses - 7 rooms (%)
Rooms in owner-occupied houses - 8 rooms (%)
Rooms in owner-occupied houses - 9+ rooms (%)
Rooms in renter-occupied houses - 1 room (%)
Rooms in renter-occupied houses - 2 rooms (%)
Rooms in renter-occupied houses - 3 rooms (%)
Rooms in renter-occupied houses - 4 rooms (%)
Rooms in renter-occupied houses - 5 rooms (%)
Rooms in renter-occupied houses - 6 rooms (%)
Rooms in renter-occupied houses - 7 rooms (%)
Rooms in renter-occupied houses - 8 rooms (%)
Rooms in renter-occupied houses - 9+ rooms (%)
Bedrooms in owner-occupied houses - no bedrooms (%)
Bedrooms in owner-occupied houses - 1 bedroom (%)
Bedrooms in owner-occupied houses - 2 bedrooms (%)
Bedrooms in owner-occupied houses - 3 bedrooms (%)
Bedrooms in owner-occupied houses - 4 bedrooms (%)
Bedrooms in owner-occupied houses - 5+ bedrooms (%)
Bedrooms in renter-occupied houses - no bedrooms (%)
Bedrooms in renter-occupied houses - 1 bedroom (%)
Bedrooms in renter-occupied houses - 2 bedrooms (%)
Bedrooms in renter-occupied houses - 3 bedrooms (%)
Bedrooms in renter-occupied houses - 4 bedrooms (%)
Bedrooms in renter-occupied houses - 5+ bedrooms (%)
Vehicles available in owner-occupied houses - no vehicle available (%)
Vehicles available in owner-occupied houses - 1 vehicle available(%)
Vehicles available in owner-occupied houses - 2 Vehicles available (%)
Vehicles available in owner-occupied houses - 3 Vehicles available (%)
Vehicles available in owner-occupied houses - 4 Vehicles available (%)
Vehicles available in owner-occupied houses - 5+ Vehicles available (%)
Vehicles available in renter-occupied houses - no vehicle available (%)
Vehicles available in renter-occupied houses - 1 vehicle available (%)
Vehicles available in renter-occupied houses - 2 Vehicles available (%)
Vehicles available in renter-occupied houses - 3 Vehicles available (%)
Vehicles available in renter-occupied houses - 4 Vehicles available (%)
Vehicles available in renter-occupied houses - 5+ Vehicles available (%)
Housing units in structures - 1, detached (%)
Housing units in structures - 1, attached (%)
Housing units in structures - 2 (%)
Housing units in structures - 3 or 4 (%)
Housing units in structures - 5 to 9 (%)
Housing units in structures - 10 to 19 (%)
Housing units in structures - 20 to 49 (%)
Housing units in structures - 50 or more (%)
Housing units in structures - Mobile home (%)
Housing units in structures - Boat, RV, van, etc. (%)
Housing units in structures - Owners - 1, detached (%)
Housing units in structures - Owners - 1, attached (%)
Housing units in structures - Owners - 2 (%)
Housing units in structures - Owners - 3 or 4 (%)
Housing units in structures - Owners - 5 to 9 (%)
Housing units in structures - Owners - 10 to 19 (%)
Housing units in structures - Owners - 20 to 49 (%)
Housing units in structures - Owners - 50 or more (%)
Housing units in structures - Owners - Mobile home (%)
Housing units in structures - Owners - Boat, RV, van, etc. (%)
Housing units in structures - Renters - 1, detached (%)
Housing units in structures - Renters - 1, attached (%)
Housing units in structures - Renters - 2 (%)
Housing units in structures - Renters - 3 or 4 (%)
Housing units in structures - Renters - 5 to 9 (%)
Housing units in structures - Renters - 10 to 19 (%)
Housing units in structures - Renters - 20 to 49 (%)
Housing units in structures - Renters - 50 or more (%)
Housing units in structures - Renters - Mobile home (%)
Housing units in structures - Renters - Boat, RV, van, etc. (%)
House/condo owner moved in on average (years ago)
Renter moved in on average (years ago)
Year householder moved into unit - Moved in 1999 to March 2000 (%)
Year householder moved into unit - Moved in 1999 to March 2000 (%) - White
Year householder moved into unit - Moved in 1999 to March 2000 (%) - Black or African American
Year householder moved into unit - Moved in 1999 to March 2000 (%) - Asian
Year householder moved into unit - Moved in 1999 to March 2000 (%) - Hispanic or Latino
Year householder moved into unit - Moved in 1999 to March 2000 (%) - American Indian and Alaska Native
Year householder moved into unit - Moved in 1999 to March 2000 (%) - Multirace
Year householder moved into unit - Moved in 1999 to March 2000 (%) - Other Race
Year householder moved into unit - Moved in 1995 to 1998 (%)
Year householder moved into unit - Moved in 1995 to 1998 (%) - White
Year householder moved into unit - Moved in 1995 to 1998 (%) - Black or African American
Year householder moved into unit - Moved in 1995 to 1998 (%) - Asian
Year householder moved into unit - Moved in 1995 to 1998 (%) - Hispanic or Latino
Year householder moved into unit - Moved in 1995 to 1998 (%) - American Indian and Alaska Native
Year householder moved into unit - Moved in 1995 to 1998 (%) - Multirace
Year householder moved into unit - Moved in 1995 to 1998 (%) - Other Race
Year householder moved into unit - Moved in 1990 to 1994 (%)
Year householder moved into unit - Moved in 1990 to 1994 (%) - White
Year householder moved into unit - Moved in 1990 to 1994 (%) - Black or African American
Year householder moved into unit - Moved in 1990 to 1994 (%) - Asian
Year householder moved into unit - Moved in 1990 to 1994 (%) - Hispanic or Latino
Year householder moved into unit - Moved in 1990 to 1994 (%) - American Indian and Alaska Native
Year householder moved into unit - Moved in 1990 to 1994 (%) - Multirace
Year householder moved into unit - Moved in 1990 to 1994 (%) - Other Race
Year householder moved into unit - Moved in 1980 to 1989 (%)
Year householder moved into unit - Moved in 1980 to 1989 (%) - White
Year householder moved into unit - Moved in 1980 to 1989 (%) - Black or African American
Year householder moved into unit - Moved in 1980 to 1989 (%) - Asian
Year householder moved into unit - Moved in 1980 to 1989 (%) - Hispanic or Latino
Year householder moved into unit - Moved in 1980 to 1989 (%) - American Indian and Alaska Native
Year householder moved into unit - Moved in 1980 to 1989 (%) - Multirace
Year householder moved into unit - Moved in 1980 to 1989 (%) - Other Race
Year householder moved into unit - Moved in 1970 to 1979 (%)
Year householder moved into unit - Moved in 1970 to 1979 (%) - White
Year householder moved into unit - Moved in 1970 to 1979 (%) - Black or African American
Year householder moved into unit - Moved in 1970 to 1979 (%) - Asian
Year householder moved into unit - Moved in 1970 to 1979 (%) - Hispanic or Latino
Year householder moved into unit - Moved in 1970 to 1979 (%) - American Indian and Alaska Native
Year householder moved into unit - Moved in 1970 to 1979 (%) - Multirace
Year householder moved into unit - Moved in 1970 to 1979 (%) - Other Race
Year householder moved into unit - Moved in 1969 or earlier (%)
Year householder moved into unit - Moved in 1969 or earlier (%) - White
Year householder moved into unit - Moved in 1969 or earlier (%) - Black or African American
Year householder moved into unit - Moved in 1969 or earlier (%) - Asian
Year householder moved into unit - Moved in 1969 or earlier (%) - Hispanic or Latino
Year householder moved into unit - Moved in 1969 or earlier (%) - American Indian and Alaska Native
Year householder moved into unit - Moved in 1969 or earlier (%) - Multirace
Year householder moved into unit - Moved in 1969 or earlier (%) - Other Race
Housing units lacking complete plumbing facilities (%)
Housing units lacking complete kitchen facilities (%)
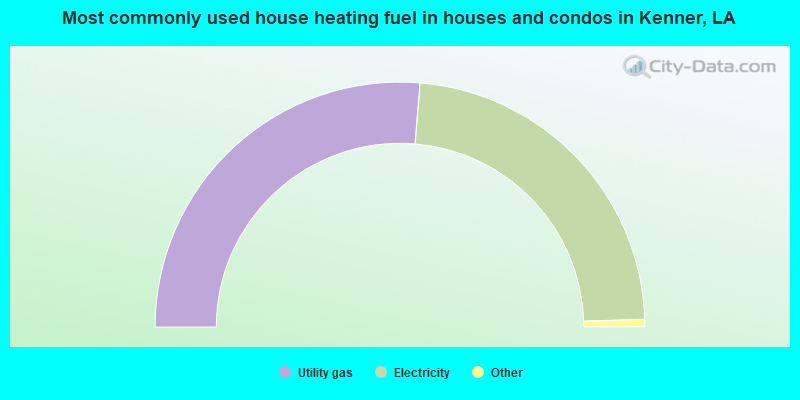
House heating fuel used in houses and condos - Utility gas (%)
House heating fuel used in houses and condos - Bottled, tank, or LP gas (%)
House heating fuel used in houses and condos - Electricity (%)
House heating fuel used in houses and condos - Fuel oil, kerosene, etc. (%)
House heating fuel used in houses and condos - Coal or coke (%)
House heating fuel used in houses and condos - Wood (%)
House heating fuel used in houses and condos - Solar energy (%)
House heating fuel used in houses and condos - Other fuel (%)
House heating fuel used in houses and condos - No fuel used (%)
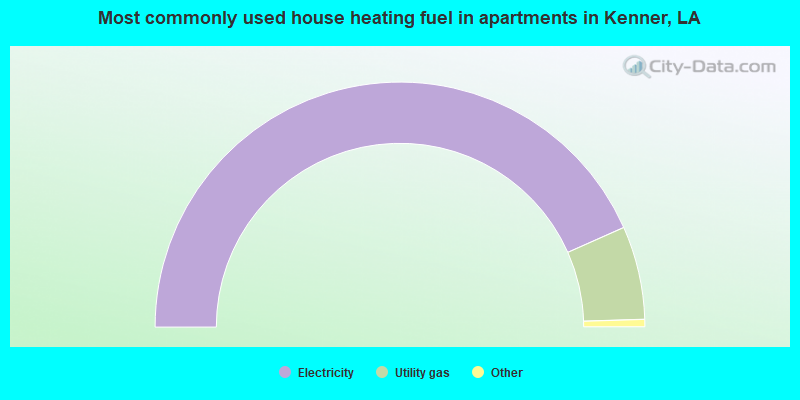
House heating fuel used in apartments - Utility gas (%)
House heating fuel used in apartments - Bottled, tank, or LP gas (%)
House heating fuel used in apartments - Electricity (%)
House heating fuel used in apartments - Fuel oil, kerosene, etc. (%)
House heating fuel used in apartments - Coal or coke (%)
House heating fuel used in apartments - Wood (%)
House heating fuel used in apartments - Solar energy (%)
House heating fuel used in apartments - Other fuel (%)
House heating fuel used in apartments - No fuel used (%)
Latest news about housing in Kenner, LA collected exclusively by city-data.com from local newspapers, TV, and radio stations
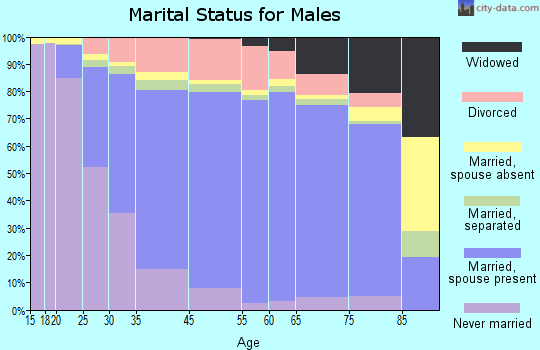
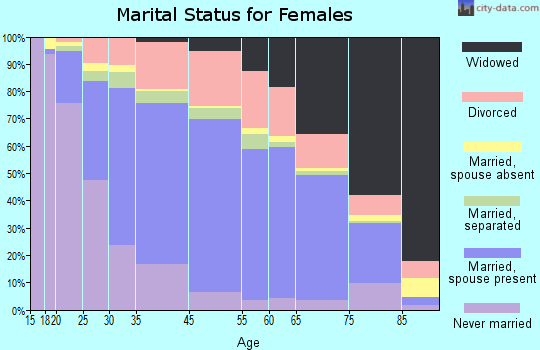
Median year house/condo built: 1978Median year apartment built: 1982Household type by relationship:
Households: 63,991
Male householders: 12,464 (3,588 living alone ), Female householders: 14,171 (5,213 living alone )10,755 spouses (10,614 opposite-sex spouses ), 1,376 unmarried partners , (1,325 opposite-sex unmarried partners ), 16,893 children (16,021 natural , 0 adopted , 872 stepchildren ), 2,052 grandchildren , 691 brothers or sisters , 815 parents , 0 foster children , 1,659 other relatives , 2,648 non-relatives In group quarters: 467
Size of family households: 6,724 2-persons , 3,764 3-persons , 3,407 4-persons , 1,536 5-persons , 175 6-persons , 318 7-or-more-persons .
Size of nonfamily households: 8,914 1-person , 1,202 2-persons , 92 3-persons , 117 4-persons , 64 5-persons .
7,634 married couples with children. single-parent households (1,028 men , 3,542 women ).
72.6% of residents of Kenner speak English at home. of residents speak Spanish at home (58% speak English very well , 20% speak English well , 12% speak English not well , 10% don't speak English at all ).of residents speak other Indo-European language at home (55% speak English very well , 17% speak English well , 24% speak English not well , 4% don't speak English at all ).of residents speak Asian or Pacific Island language at home (74% speak English very well , 21% speak English well , 4% speak English not well , 1% don't speak English at all ).of residents speak other language at home (50% speak English very well , 38% speak English well , 9% speak English not well , 3% don't speak English at all ).
Foreign born population: 10,478 (16.4%)of them are naturalized citizens )
Median number of rooms in houses and condos:
Median number of rooms in apartments
Owner-occupied Renter-occupied
Rooms in owner-occupied houses in Kenner, Louisiana
306 1 room 31 2 rooms 108 3 rooms 1,328 4 rooms 4,057 5 rooms 4,154 6 rooms 3,184 7 rooms 1,797 8 rooms 1,331 9+ rooms
Rooms in renter-occupied apartments in Kenner, Louisiana
1,119 1 room 1,045 2 rooms 1,905 3 rooms 1,330 4 rooms 3,138 5 rooms 902 6 rooms 325 7 rooms 102 8 rooms 473 9+ rooms
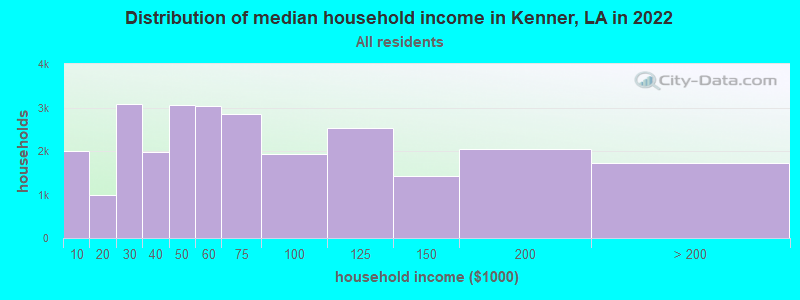
Kenner, LA household income distribution 1,990 Less than $10,000992 $10,000 to $19,9993,082 $20,000 to $29,9991,970 $30,000 to $39,9993,049 $40,000 to $49,9993,025 $50,000 to $59,9992,846 $60,000 to $74,9991,939 $75,000 to $99,9992,531 $100,000 to $124,9991,424 $125,000 to $149,9992,053 $150,000 to $199,9991,734 $200,000 or more
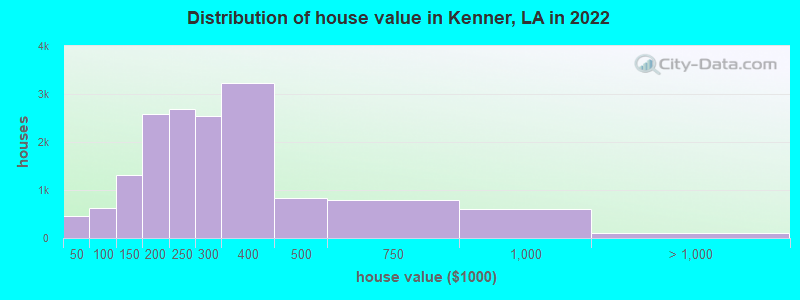
Home value of owner - occupied houses in 2022 in Kenner, LA 211 Less than $10,0007 $10,000 to $14,99986 $15,000 to $19,99966 $20,000 to $24,9996 $25,000 to $29,99918 $30,000 to $34,99939 $35,000 to $39,99914 $40,000 to $49,99930 $50,000 to $59,999206 $60,000 to $69,999126 $70,000 to $79,999148 $80,000 to $89,999104 $90,000 to $99,999551 $100,000 to $124,999762 $125,000 to $149,9991,297 $150,000 to $174,9991,294 $175,000 to $199,9992,678 $200,000 to $249,9992,545 $250,000 to $299,9993,221 $300,000 to $399,999837 $400,000 to $499,999794 $500,000 to $749,999597 $750,000 to $999,999101 $1,000,000 to $1,499,999Rent paid by renters in 2022 in Kenner, LA 59 $100 to $14921 $150 to $19930 $200 to $24926 $250 to $299148 $300 to $34947 $350 to $3999 $400 to $44913 $450 to $499115 $500 to $549370 $550 to $599104 $600 to $649183 $650 to $699799 $700 to $7491,098 $750 to $7991,552 $800 to $8991,255 $900 to $9992,071 $1,000 to $1,2491,011 $1,250 to $1,499410 $1,500 to $1,999167 $2,000 to $2,49968 $3,500 or more626 No cash rent
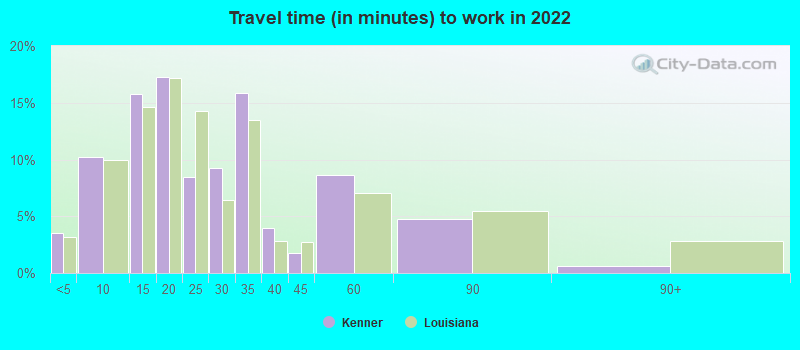
Percentage of workers working in this county: 65.3%Number of people working at home: 1,820 (5.8% of all workers )
Travel time to work (commute)
Less than 5 minutes: 8215 to 9 minutes: 2,30010 to 14 minutes: 2,99415 to 19 minutes: 3,93420 to 24 minutes: 5,64625 to 29 minutes: 1,97530 to 34 minutes: 3,77535 to 39 minutes: 1,60240 to 44 minutes: 1,76245 to 59 minutes: 2,42460 to 89 minutes: 2,23290 or more minutes: 89
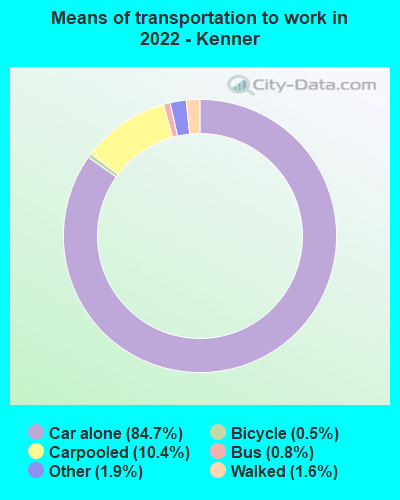
Means of transportation to work:
Drove a car alone: 19,561 (79.4%)Carpooled: 1,972 (8.0%)Bus : 100 (0.4%)Taxi: 659 (2.7%)Bicycle: 61 (0.2%)Walked: 280 (1.1%)Worked at home: 1,820 (7.4%)
Unemployment by race in 2022
Unemployment rate for White non-Hispanic residents 0.6% Males2.0% FemalesUnemployment rate for Black residents 1.4% Males1.5% FemalesUnemployment rate for American Indian and Alaska Native residents 49.9% FemalesUnemployment rate for Asian residents 5.7% MalesUnemployment rate for other race residents 3.9% Males4.1% FemalesUnemployment rate for two or more race residents 1.3% Males2.2% FemalesUnemployment rate for Hispanic or Latino residents 1.4% Males4.5% Females
Year of entry for the foreign-born population in Kenner, Louisiana
5,007 2010 or later 3,070 2000 to 2009 1,910 1990 to 1999 2,422 1980 to 1989 1,440 1970 to 1979 1,632 Before 1970
First ancestries reported:
Italian: 2,986 (8.2%)
American: 2,289 (6.3%)
French: 1,633 (4.5%)
German: 1,516 (4.2%)
English: 1,413 (3.9%)
Irish: 805 (2.2%)
European: 375 (1.0%)
Arab: 217 (0.6%)
African: 204 (0.6%)
Egyptian: 176 (0.5%)
Iranian: 171 (0.5%)
Nigerian: 162 (0.4%)
French Canadian: 151 (0.4%)
Ethiopian: 125 (0.3%)
Lebanese: 123 (0.3%)
Romanian: 115 (0.3%)
Cajun: 104 (0.3%)
Palestinian: 75 (0.2%)
Somali: 68 (0.2%)
Turkish: 63 (0.2%)
Syrian: 56 (0.2%)
Brazilian: 56 (0.2%)
Slovene: 47 (0.1%)
Jamaican: 47 (0.1%)
British: 45 (0.1%)
Russian: 45 (0.1%)
Jordanian: 45 (0.1%)
Norwegian: 26 (0.07%)
Greek: 26 (0.07%)
Polish: 22 (0.06%)
Dutch: 22 (0.06%)
Scottish: 19 (0.05%)
Bulgarian: 19 (0.05%)
Israeli: 19 (0.05%)
Swiss: 18 (0.05%)
Eastern European: 14 (0.04%)
Canadian: 11 (0.03%)
Alsatian: 9 (0.02%)
Swedish: 8 (0.02%)
Danish: 7 (0.02%)
Yugoslavian: 7 (0.02%)
Austrian: 4 (0.01%)
Welsh: 4 (0.01%) Most common places of birth for foreign-born residents (%): Honduras Kenner:
34.0% (4,465)Louisiana:
18.9% (37,225)
Cuba Kenner:
8.0% (1,044)Louisiana:
3.1% (6,172)
Mexico Kenner:
6.8% (890)Louisiana:
12.1% (23,732)
Nicaragua Kenner:
5.9% (780)Louisiana:
2.1% (4,115)
Pakistan Kenner:
5.7% (746)Louisiana:
1.2% (2,282)
Dominican Republic Kenner:
5.3% (699)Louisiana:
2.0% (3,999)
Guatemala Kenner:
4.8% (635)Louisiana:
2.8% (5,576)
El Salvador Kenner:
4.1% (534)Louisiana:
2.2% (4,241)
Vietnam Kenner:
3.1% (402)Louisiana:
9.2% (18,115)
China, excluding Hong Kong and Taiwan Kenner:
2.9% (380)Louisiana:
3.4% (6,779)
Egypt Kenner:
2.5% (327)Louisiana:
0.8% (1,613)
Iran Kenner:
1.8% (233)Louisiana:
0.7% (1,368)
Taiwan Kenner:
1.8% (231)Louisiana:
0.5% (947)
Brazil Kenner:
1.7% (218)Louisiana:
1.5% (2,923)
Algeria Kenner:
1.6% (205)Louisiana:
0.2% (466)
Place of birth for U.S.-born residents:
This state: 40,797Other state: 10,957Northeast: 1,460Midwest: 1,557South: 6,522West: 1,418 88.6% of Kenner residents lived in the same house 1 years ago.
Out of people who lived in different houses, 35.0% lived in this county.
Out of people who lived in different counties, 70.9% lived in Louisiana.
Kenner:
88.6%State average:
88.3%
Education attainment for males 25 years and older:
No schooling: 618Nursery to 4th grade: 2215th and 6th grade: 5977th and 8th grade: 369th grade: 53810th grade: 13311th grade: 51412th grade, no diploma: 67High school graduate (or equivalency): 6,163Less than 1 year of college: 1,484Some college more than 1 year, no degree: 2,187Associate degree: 2,090Bachelor's degree: 4,873Master's degree: 857Professional school degree: 980Doctorate degree: 639
Education attainment for females 25 years and older:
No schooling: 397Nursery to 4th grade: 05th and 6th grade: 2837th and 8th grade: 6299th grade: 67510th grade: 16511th grade: 63612th grade, no diploma: 902High school graduate (or equivalency): 7,117Less than 1 year of college: 1,616Some college more than 1 year, no degree: 3,465Associate degree: 2,295Bachelor's degree: 3,986Master's degree: 2,745Professional school degree: 0Doctorate degree: 47
Housing units in structures:
One, detached: 16,740One, attached: 1,492Two: 7413 or 4: 2,7965 to 9: 2,91910 to 19: 2,18920 to 49: 77450 or more: 702Mobile homes: 301Housing units lacking complete plumbing facilities in 2022: 0.8%Housing units lacking complete kitchen facilities in 2022: 2.2%House/condo owner moved in on average 17 years ago
Renter moved in on average 3 years ago
Private vs. public school enrollment:
Students in private schools in grades 1 to 8 (elementary and middle school): 1,861 Here:
31.0%Louisiana:
19.6%
Students in private schools in grades 9 to 12 (high school): 798 Here:
23.0%Louisiana:
18.3%
Students in private undergraduate colleges: 517 Here:
24.3%Louisiana:
17.4%