Kennewick, WA (Washington) Houses and Residents
Estimated median house or condo value in 2022: $363,700 (it was $106,300 in 2000 )
Kennewick:
$363,700Washington:
$569,500
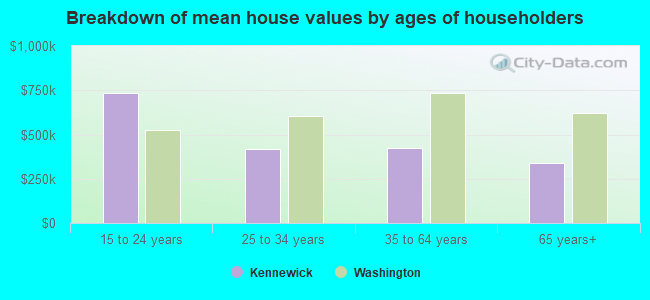
Lower value quartile - upper value quartile: $286,100 - $486,200Mean price in 2022: Detached houses: $391,136 Here:
$391,136State:
$734,307
Townhouses or other attached units: $385,639 Here:
$385,639State:
$657,697
In 2-unit structures: $481,939 Here:
$481,939State:
$534,634
In 3-to-4-unit structures: $500,516 Here:
$500,516State:
$510,239
In 5-or-more-unit structures: $280,116 Here:
$280,116State:
$503,183
Mobile homes: $160,131 Here:
$160,131State:
$218,362
Occupied boats, RVs, vans, etc.: $1,138,669 Here:
$1,138,669State:
$159,523
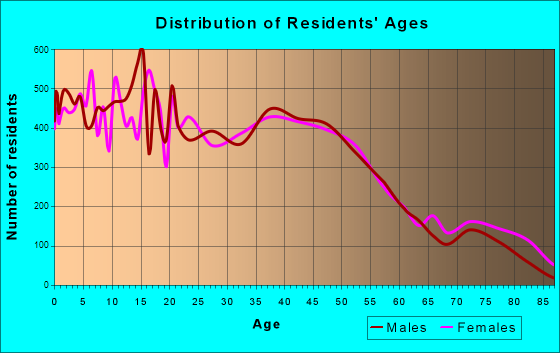
Total population: 77,421 (Urban population: 54,686, Rural population: 404 (all nonfarm) )
Houses: 31,648 (30,210 occupied: 19,724 owner occupied, 10,486 renter occupied )
% of renters here:
35%State:
36%
Housing density: 1,380 houses/condos per square mile
Median price asked for vacant for-sale houses and condos in 2022: $305,978.
Median contract rent in 2022: $986 (lower quartile is $837, upper quartile is $1,332)
Median rent asked for vacant for-rent units in 2022: $703
Median gross rent in Kennewick, WA in 2022: $1,190
Housing units in Kennewick with a mortgage: 11,899 (809 second mortgage, 0 home equity loan, 637 both second mortgage and home equity loan )Houses without a mortgage: 233
Median household income for houses/condos with a mortgage: $110,079
Median household income for apartments without a mortgage: $71,768
Median monthly housing costs: $1,176
Data:
Median house or condo value ($)
Median house or condo value ($ change since 2000)
Median house or condo value ($) - White
Median house or condo value ($) - Black or African American
Median house or condo value ($) - Asian
Median house or condo value ($) - Hispanic or Latino
Median house or condo value ($) - American Indian and Alaska Native
Median house or condo value ($) - Multirace
Median house or condo value ($) - Other Race
Median price asked for mobile homes ($)
Household density (households per square mile)
Mean house or condo value by units in structure - 1, detached ($)
Mean house or condo value by units in structure - 1, attached ($)
Mean house or condo value by units in structure - 2 ($)
Mean house or condo value by units in structure by units in structure - 3 or 4 ($)
Mean house or condo value by units in structure - 5 or more ($)
Mean house or condo value by units in structure - Boat, RV, van, etc. ($)
Mean house or condo value by units in structure - Mobile home ($)
Median contract rent ($)
Median contract rent - Lower quartile ($)
Median contract rent - Upper quartile ($)
Median gross rent ($)
Urban houses (%)
Rural houses (%)
Houses occupied (%)
Houses occupied (% change since 2000)
Houses owner occupied (%)
Houses owner occupied (% change since 2000)
Houses renter occupied (%)
Houses renter occupied (% change since 2000)
Vacant housing units - For rent (%)
Vacant housing units - For rent (% change since 2000)
Vacant housing units - For sale only (%)
Vacant housing units - For sale only (% change since 2000)
Vacant housing units - Rented or sold, not occupied (%)
Vacant housing units - Rented or sold, not occupied (% change since 2000)
Vacant housing units - For seasonal, recreational, or occasional use (%)
Vacant housing units - For seasonal, recreational, or occasional use (% change since 2000)
Vacant housing units - For migrant workers (%)
Vacant housing units - For migrant workers (% change since 2000)
Vacant housing units - Other vacant (%)
Vacant housing units - Other vacant (% change since 2000)
Median monthly housing costs ($)
Median household income for houses/condos with a mortgage ($)
Median household income for houses/condos without a mortgage ($)
Median household income ($)
Median household income ($) - White
Median household income ($) - Black or African American
Median household income ($) - Asian
Median household income ($) - Hispanic or Latino
Median household income ($) - American Indian and Alaska Native
Median household income ($) - Multirace
Median household income ($) - Other Race
Mortgage status - with mortgage (%)
Mortgage status - with second mortgage (%)
Mortgage status - with home equity loan (%)
Mortgage status - with both second mortgage and home equity loan (%)
Mortgage status - without a mortgage (%)
Median year house/condo built
Median year apartment built
Household type by relationship - Male householder living alone (%)
Household type by relationship - Male householder not living alone (%)
Household type by relationship - Female householder living alone (%)
Household type by relationship - Female householder not living alone (%)
Household type by relationship - Opposite-Sex spouse (%)
Household type by relationship - Same-Sex spouse (%)
Household type by relationship - Opposite-Sex unmarried partner (%)
Household type by relationship - Same-Sex unmarried partner (%)
Household type by relationship - In group quarters (%)
Size of family households - 2-person household (%)
Size of family households - 3-person household (%)
Size of family households - 4-person household (%)
Size of family households - 5-person household (%)
Size of family households - 6-person household (%)
Size of family households - 7-or-more-person household (%)
Size of nonfamily households - 1-person household (%)
Size of nonfamily households - 2-person household (%)
Size of nonfamily households - 3-person household (%)
Size of nonfamily households - 4-person household (%)
Size of nonfamily households - 5-person household (%)
Size of nonfamily households - 6-person household (%)
Size of nonfamily households - 7-or-moreperson household (%)
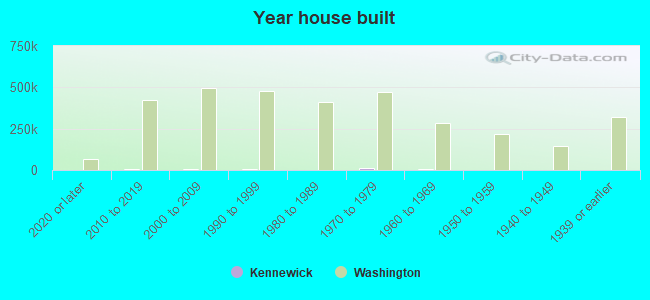
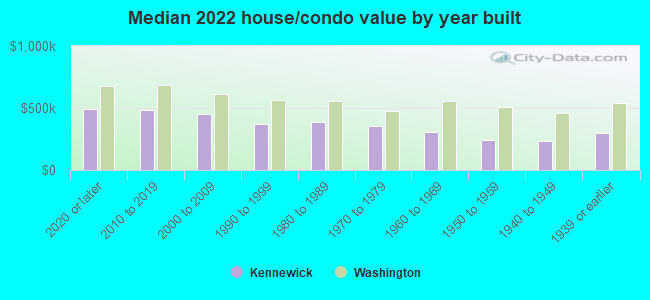
Year house built - Built 2010 or later (%)
Year house built - Built 2000 to 2009 (%)
Year house built - Built 1990 to 1999 (%)
Year house built - Built 1980 to 1989 (%)
Year house built - Built 1970 to 1979 (%)
Year house built - Built 1960 to 1969 (%)
Year house built - Built 1950 to 1959 (%)
Year house built - Built 1940 to 1949 (%)
Year house built - Built 1939 or earlier (%)
Median number of rooms in houses and condos
Median number of rooms in apartments
Median number of bedrooms in owner occupied houses
Mean number of bedrooms in owner occupied houses
Median number of bedrooms in renter occupied houses
Mean number of bedrooms in renter occupied houses
Median number of vehichles in owner occupied houses
Mean number of vehichles in owner occupied houses
Median number of vehichles in renter occupied houses
Mean number of vehichles in renter occupied houses
Rooms in owner-occupied houses - 1 room (%)
Rooms in owner-occupied houses - 2 rooms (%)
Rooms in owner-occupied houses - 3 rooms (%)
Rooms in owner-occupied houses - 4 rooms (%)
Rooms in owner-occupied houses - 5 rooms (%)
Rooms in owner-occupied houses - 6 rooms (%)
Rooms in owner-occupied houses - 7 rooms (%)
Rooms in owner-occupied houses - 8 rooms (%)
Rooms in owner-occupied houses - 9+ rooms (%)
Rooms in renter-occupied houses - 1 room (%)
Rooms in renter-occupied houses - 2 rooms (%)
Rooms in renter-occupied houses - 3 rooms (%)
Rooms in renter-occupied houses - 4 rooms (%)
Rooms in renter-occupied houses - 5 rooms (%)
Rooms in renter-occupied houses - 6 rooms (%)
Rooms in renter-occupied houses - 7 rooms (%)
Rooms in renter-occupied houses - 8 rooms (%)
Rooms in renter-occupied houses - 9+ rooms (%)
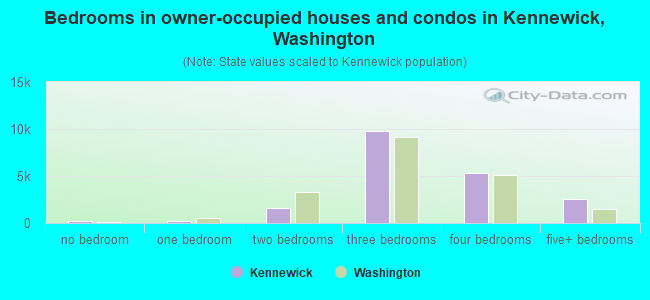
Bedrooms in owner-occupied houses - no bedrooms (%)
Bedrooms in owner-occupied houses - 1 bedroom (%)
Bedrooms in owner-occupied houses - 2 bedrooms (%)
Bedrooms in owner-occupied houses - 3 bedrooms (%)
Bedrooms in owner-occupied houses - 4 bedrooms (%)
Bedrooms in owner-occupied houses - 5+ bedrooms (%)
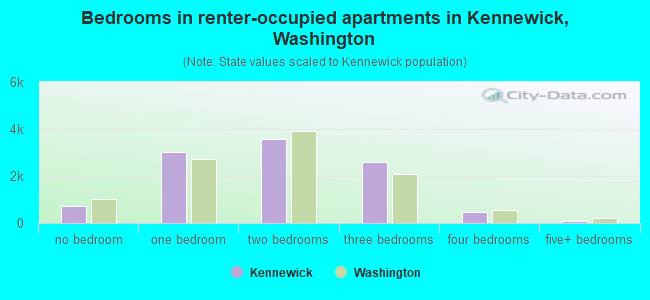
Bedrooms in renter-occupied houses - no bedrooms (%)
Bedrooms in renter-occupied houses - 1 bedroom (%)
Bedrooms in renter-occupied houses - 2 bedrooms (%)
Bedrooms in renter-occupied houses - 3 bedrooms (%)
Bedrooms in renter-occupied houses - 4 bedrooms (%)
Bedrooms in renter-occupied houses - 5+ bedrooms (%)
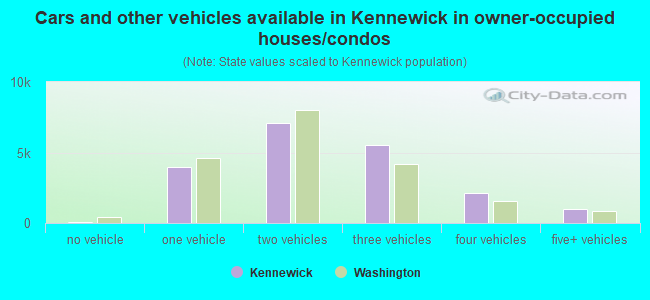
Vehicles available in owner-occupied houses - no vehicle available (%)
Vehicles available in owner-occupied houses - 1 vehicle available(%)
Vehicles available in owner-occupied houses - 2 Vehicles available (%)
Vehicles available in owner-occupied houses - 3 Vehicles available (%)
Vehicles available in owner-occupied houses - 4 Vehicles available (%)
Vehicles available in owner-occupied houses - 5+ Vehicles available (%)
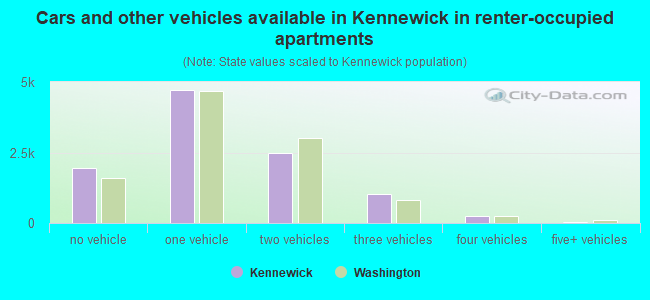
Vehicles available in renter-occupied houses - no vehicle available (%)
Vehicles available in renter-occupied houses - 1 vehicle available (%)
Vehicles available in renter-occupied houses - 2 Vehicles available (%)
Vehicles available in renter-occupied houses - 3 Vehicles available (%)
Vehicles available in renter-occupied houses - 4 Vehicles available (%)
Vehicles available in renter-occupied houses - 5+ Vehicles available (%)
Housing units in structures - 1, detached (%)
Housing units in structures - 1, attached (%)
Housing units in structures - 2 (%)
Housing units in structures - 3 or 4 (%)
Housing units in structures - 5 to 9 (%)
Housing units in structures - 10 to 19 (%)
Housing units in structures - 20 to 49 (%)
Housing units in structures - 50 or more (%)
Housing units in structures - Mobile home (%)
Housing units in structures - Boat, RV, van, etc. (%)
Housing units in structures - Owners - 1, detached (%)
Housing units in structures - Owners - 1, attached (%)
Housing units in structures - Owners - 2 (%)
Housing units in structures - Owners - 3 or 4 (%)
Housing units in structures - Owners - 5 to 9 (%)
Housing units in structures - Owners - 10 to 19 (%)
Housing units in structures - Owners - 20 to 49 (%)
Housing units in structures - Owners - 50 or more (%)
Housing units in structures - Owners - Mobile home (%)
Housing units in structures - Owners - Boat, RV, van, etc. (%)
Housing units in structures - Renters - 1, detached (%)
Housing units in structures - Renters - 1, attached (%)
Housing units in structures - Renters - 2 (%)
Housing units in structures - Renters - 3 or 4 (%)
Housing units in structures - Renters - 5 to 9 (%)
Housing units in structures - Renters - 10 to 19 (%)
Housing units in structures - Renters - 20 to 49 (%)
Housing units in structures - Renters - 50 or more (%)
Housing units in structures - Renters - Mobile home (%)
Housing units in structures - Renters - Boat, RV, van, etc. (%)
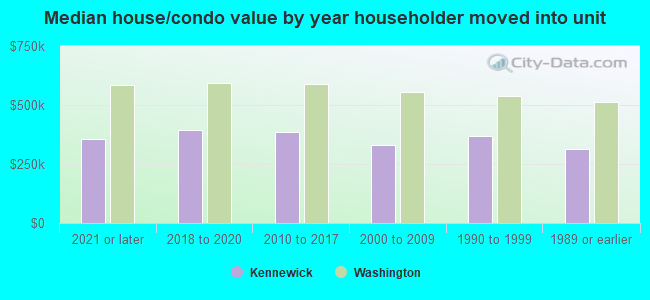
House/condo owner moved in on average (years ago)
Renter moved in on average (years ago)
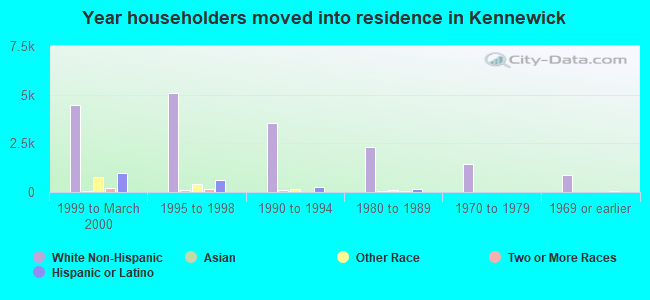
Year householder moved into unit - Moved in 1999 to March 2000 (%)
Year householder moved into unit - Moved in 1999 to March 2000 (%) - White
Year householder moved into unit - Moved in 1999 to March 2000 (%) - Black or African American
Year householder moved into unit - Moved in 1999 to March 2000 (%) - Asian
Year householder moved into unit - Moved in 1999 to March 2000 (%) - Hispanic or Latino
Year householder moved into unit - Moved in 1999 to March 2000 (%) - American Indian and Alaska Native
Year householder moved into unit - Moved in 1999 to March 2000 (%) - Multirace
Year householder moved into unit - Moved in 1999 to March 2000 (%) - Other Race
Year householder moved into unit - Moved in 1995 to 1998 (%)
Year householder moved into unit - Moved in 1995 to 1998 (%) - White
Year householder moved into unit - Moved in 1995 to 1998 (%) - Black or African American
Year householder moved into unit - Moved in 1995 to 1998 (%) - Asian
Year householder moved into unit - Moved in 1995 to 1998 (%) - Hispanic or Latino
Year householder moved into unit - Moved in 1995 to 1998 (%) - American Indian and Alaska Native
Year householder moved into unit - Moved in 1995 to 1998 (%) - Multirace
Year householder moved into unit - Moved in 1995 to 1998 (%) - Other Race
Year householder moved into unit - Moved in 1990 to 1994 (%)
Year householder moved into unit - Moved in 1990 to 1994 (%) - White
Year householder moved into unit - Moved in 1990 to 1994 (%) - Black or African American
Year householder moved into unit - Moved in 1990 to 1994 (%) - Asian
Year householder moved into unit - Moved in 1990 to 1994 (%) - Hispanic or Latino
Year householder moved into unit - Moved in 1990 to 1994 (%) - American Indian and Alaska Native
Year householder moved into unit - Moved in 1990 to 1994 (%) - Multirace
Year householder moved into unit - Moved in 1990 to 1994 (%) - Other Race
Year householder moved into unit - Moved in 1980 to 1989 (%)
Year householder moved into unit - Moved in 1980 to 1989 (%) - White
Year householder moved into unit - Moved in 1980 to 1989 (%) - Black or African American
Year householder moved into unit - Moved in 1980 to 1989 (%) - Asian
Year householder moved into unit - Moved in 1980 to 1989 (%) - Hispanic or Latino
Year householder moved into unit - Moved in 1980 to 1989 (%) - American Indian and Alaska Native
Year householder moved into unit - Moved in 1980 to 1989 (%) - Multirace
Year householder moved into unit - Moved in 1980 to 1989 (%) - Other Race
Year householder moved into unit - Moved in 1970 to 1979 (%)
Year householder moved into unit - Moved in 1970 to 1979 (%) - White
Year householder moved into unit - Moved in 1970 to 1979 (%) - Black or African American
Year householder moved into unit - Moved in 1970 to 1979 (%) - Asian
Year householder moved into unit - Moved in 1970 to 1979 (%) - Hispanic or Latino
Year householder moved into unit - Moved in 1970 to 1979 (%) - American Indian and Alaska Native
Year householder moved into unit - Moved in 1970 to 1979 (%) - Multirace
Year householder moved into unit - Moved in 1970 to 1979 (%) - Other Race
Year householder moved into unit - Moved in 1969 or earlier (%)
Year householder moved into unit - Moved in 1969 or earlier (%) - White
Year householder moved into unit - Moved in 1969 or earlier (%) - Black or African American
Year householder moved into unit - Moved in 1969 or earlier (%) - Asian
Year householder moved into unit - Moved in 1969 or earlier (%) - Hispanic or Latino
Year householder moved into unit - Moved in 1969 or earlier (%) - American Indian and Alaska Native
Year householder moved into unit - Moved in 1969 or earlier (%) - Multirace
Year householder moved into unit - Moved in 1969 or earlier (%) - Other Race
Housing units lacking complete plumbing facilities (%)
Housing units lacking complete kitchen facilities (%)
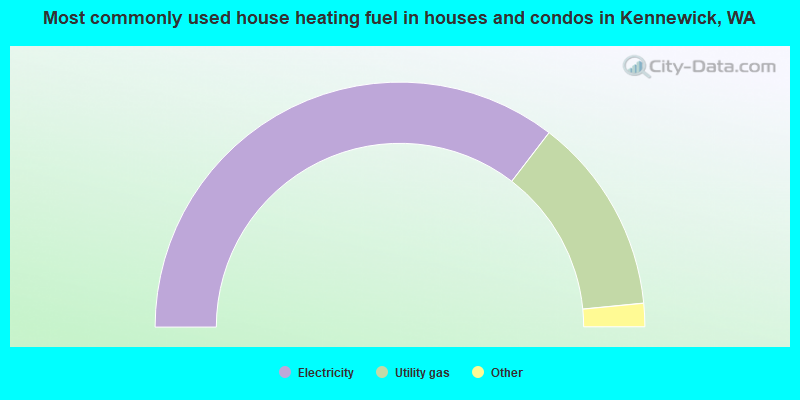
House heating fuel used in houses and condos - Utility gas (%)
House heating fuel used in houses and condos - Bottled, tank, or LP gas (%)
House heating fuel used in houses and condos - Electricity (%)
House heating fuel used in houses and condos - Fuel oil, kerosene, etc. (%)
House heating fuel used in houses and condos - Coal or coke (%)
House heating fuel used in houses and condos - Wood (%)
House heating fuel used in houses and condos - Solar energy (%)
House heating fuel used in houses and condos - Other fuel (%)
House heating fuel used in houses and condos - No fuel used (%)
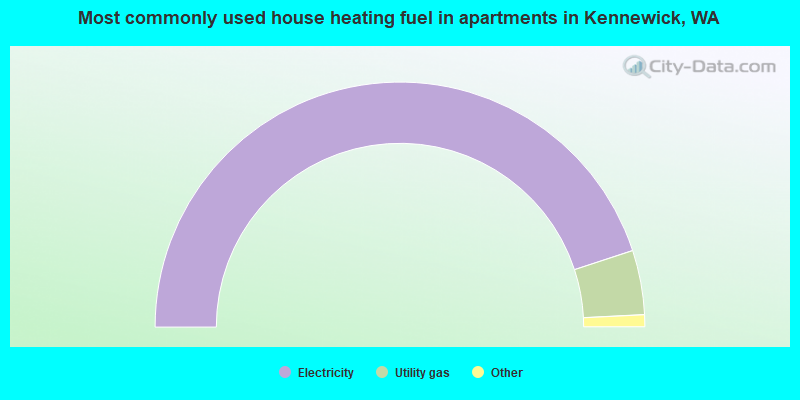
House heating fuel used in apartments - Utility gas (%)
House heating fuel used in apartments - Bottled, tank, or LP gas (%)
House heating fuel used in apartments - Electricity (%)
House heating fuel used in apartments - Fuel oil, kerosene, etc. (%)
House heating fuel used in apartments - Coal or coke (%)
House heating fuel used in apartments - Wood (%)
House heating fuel used in apartments - Solar energy (%)
House heating fuel used in apartments - Other fuel (%)
House heating fuel used in apartments - No fuel used (%)
Latest news about housing in Kennewick, WA collected exclusively by city-data.com from local newspapers, TV, and radio stations
Median year house/condo built: 1980Median year apartment built: 1978Household type by relationship:
Households: 84,757
Male householders: 16,877 (3,968 living alone ), Female householders: 13,333 (4,213 living alone )14,290 spouses (14,116 opposite-sex spouses ), 2,731 unmarried partners , (2,731 opposite-sex unmarried partners ), 29,686 children (25,430 natural , 1,908 adopted , 2,348 stepchildren ), 1,448 grandchildren , 838 brothers or sisters , 717 parents , 0 foster children , 713 other relatives , 3,293 non-relatives In group quarters: 831
Size of family households: 8,137 2-persons , 3,925 3-persons , 4,177 4-persons , 2,489 5-persons , 1,238 6-persons , 618 7-or-more-persons .
Size of nonfamily households: 8,181 1-person , 1,322 2-persons , 85 3-persons , 38 4-persons .
13,092 married couples with children. single-parent households (2,105 men , 5,161 women ).
71.8% of residents of Kennewick speak English at home. of residents speak Spanish at home (59% speak English very well , 21% speak English well , 13% speak English not well , 7% don't speak English at all ).of residents speak other Indo-European language at home (80% speak English very well , 8% speak English well , 11% speak English not well , 1% don't speak English at all ).of residents speak Asian or Pacific Island language at home (48% speak English very well , 27% speak English well , 11% speak English not well , 14% don't speak English at all ).of residents speak other language at home (50% speak English very well , 35% speak English well , 14% speak English not well ).
Foreign born population: 10,679 (12.6%)of them are naturalized citizens )
Median number of rooms in houses and condos:
Median number of rooms in apartments
Owner-occupied Renter-occupied
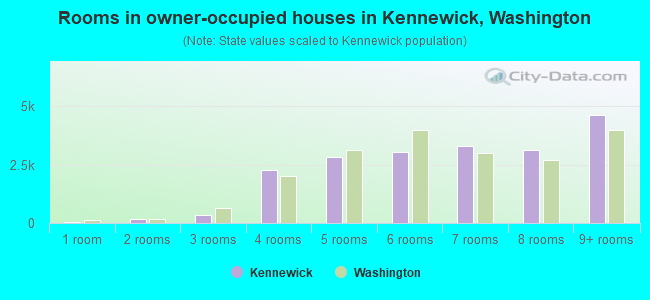
Rooms in owner-occupied houses in Kennewick, Washington
62 1 room 162 2 rooms 322 3 rooms 2,258 4 rooms 2,837 5 rooms 3,036 6 rooms 3,290 7 rooms 3,132 8 rooms 4,625 9+ rooms
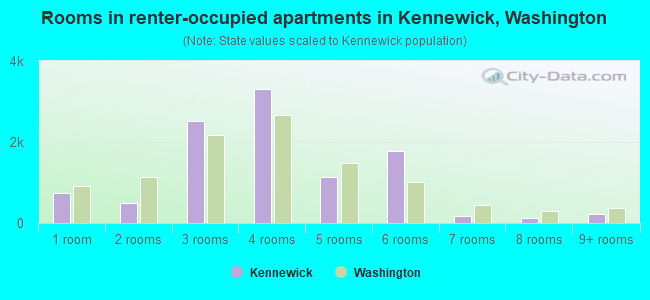
Rooms in renter-occupied apartments in Kennewick, Washington
734 1 room 499 2 rooms 2,516 3 rooms 3,311 4 rooms 1,146 5 rooms 1,773 6 rooms 171 7 rooms 125 8 rooms 211 9+ rooms
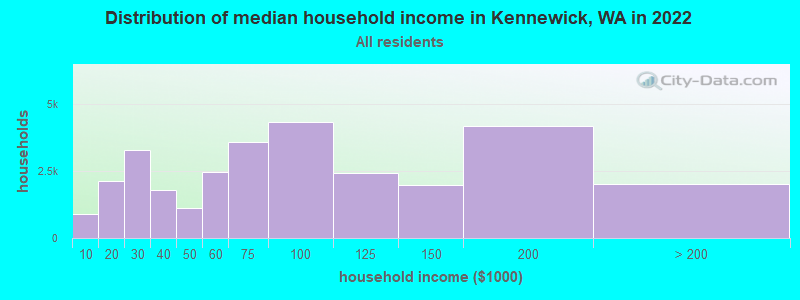
Kennewick, WA household income distribution 900 Less than $10,0002,128 $10,000 to $19,9993,296 $20,000 to $29,9991,797 $30,000 to $39,9991,135 $40,000 to $49,9992,471 $50,000 to $59,9993,571 $60,000 to $74,9994,328 $75,000 to $99,9992,428 $100,000 to $124,9991,975 $125,000 to $149,9994,163 $150,000 to $199,9992,018 $200,000 or more
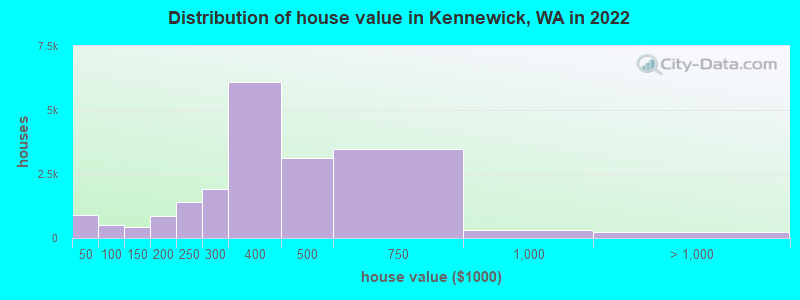
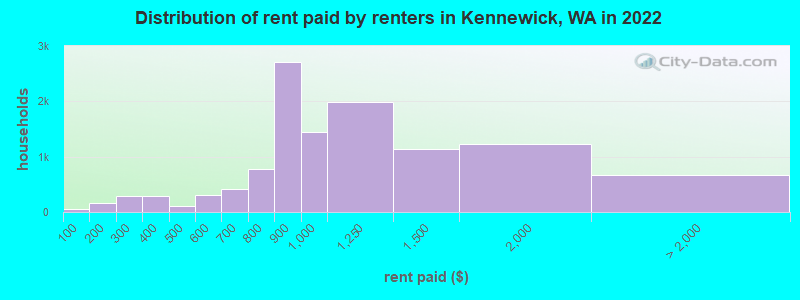
Home value of owner - occupied houses in 2022 in Kennewick, WA 191 Less than $10,000119 $10,000 to $14,9995 $15,000 to $19,999101 $20,000 to $24,999319 $25,000 to $29,99930 $30,000 to $34,99941 $35,000 to $39,99985 $40,000 to $49,99919 $50,000 to $59,999169 $60,000 to $69,99984 $70,000 to $79,99975 $80,000 to $89,99971 $90,000 to $99,999174 $100,000 to $124,999264 $125,000 to $149,999280 $150,000 to $174,999595 $175,000 to $199,9991,387 $200,000 to $249,9991,898 $250,000 to $299,9996,096 $300,000 to $399,9993,137 $400,000 to $499,9993,475 $500,000 to $749,999327 $750,000 to $999,999203 $1,000,000 to $1,499,99913 $1,500,000 to $1,999,99925 $2,000,000 or moreRent paid by renters in 2022 in Kennewick, WA 55 Less than $100167 $150 to $19956 $200 to $249231 $250 to $299198 $300 to $34984 $350 to $39980 $400 to $44935 $450 to $49990 $500 to $549223 $550 to $599281 $600 to $649129 $650 to $69979 $700 to $749704 $750 to $7992,702 $800 to $8991,441 $900 to $9991,984 $1,000 to $1,2491,139 $1,250 to $1,4991,223 $1,500 to $1,999155 $2,000 to $2,49944 $2,500 to $2,99944 $3,000 to $3,499169 $3,500 or more260 No cash rent
Percentage of workers working in this county: 80.9%Number of people working at home: 3,893 (9.9% of all workers )
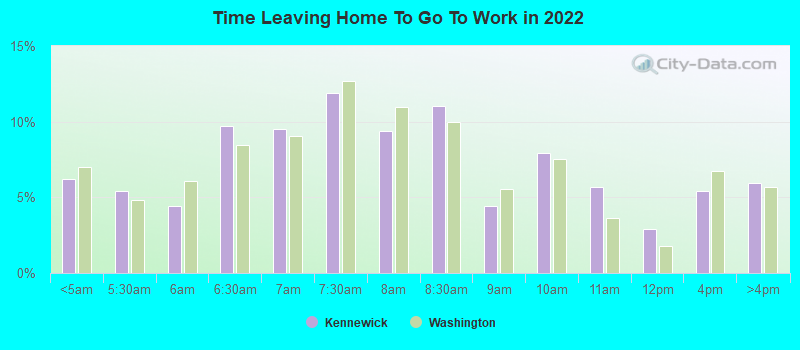
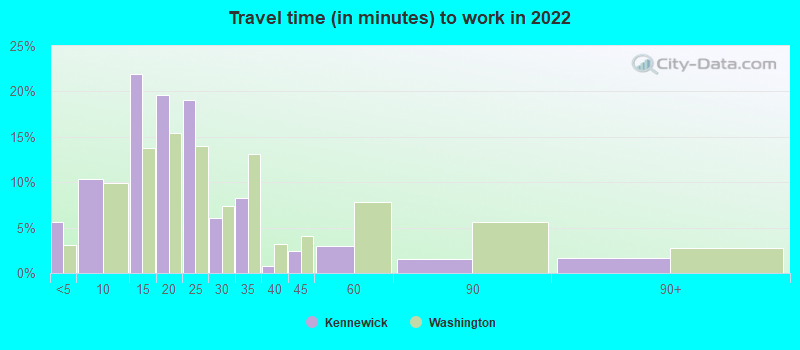
Travel time to work (commute)
Less than 5 minutes: 1,9385 to 9 minutes: 3,30710 to 14 minutes: 7,45515 to 19 minutes: 7,15320 to 24 minutes: 5,81525 to 29 minutes: 1,65330 to 34 minutes: 2,96235 to 39 minutes: 7740 to 44 minutes: 69445 to 59 minutes: 1,85660 to 89 minutes: 79790 or more minutes: 349
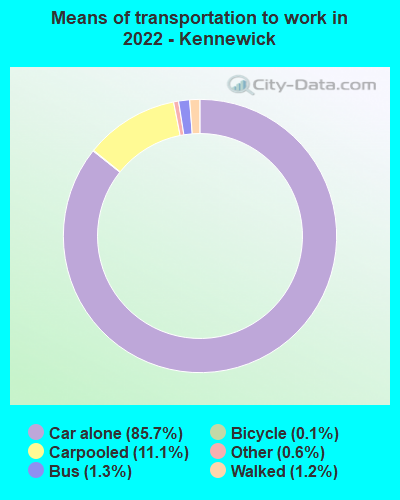
Means of transportation to work:
Drove a car alone: 27,951 (73.9%)Carpooled: 4,195 (11.1%)Bus : 742 (2.0%)Taxi: 210 (0.6%)Bicycle: 40 (0.1%)Walked: 434 (1.1%)Worked at home: 3,893 (10.3%)
Unemployment by race in 2022
Unemployment rate for White non-Hispanic residents 3.4% Males4.6% FemalesUnemployment rate for Black residents 4.5% Males5.1% FemalesUnemployment rate for Asian residents 2.7% FemalesUnemployment rate for other race residents 0.8% Males14.9% FemalesUnemployment rate for two or more race residents 1.2% Males1.9% FemalesUnemployment rate for Hispanic or Latino residents 1.6% Males7.2% Females
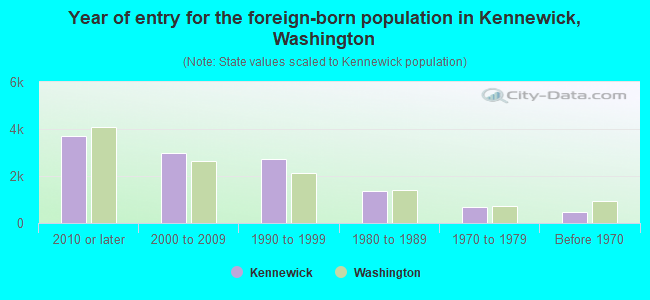
Year of entry for the foreign-born population in Kennewick, Washington
3,687 2010 or later 2,962 2000 to 2009 2,739 1990 to 1999 1,369 1980 to 1989 691 1970 to 1979 476 Before 1970
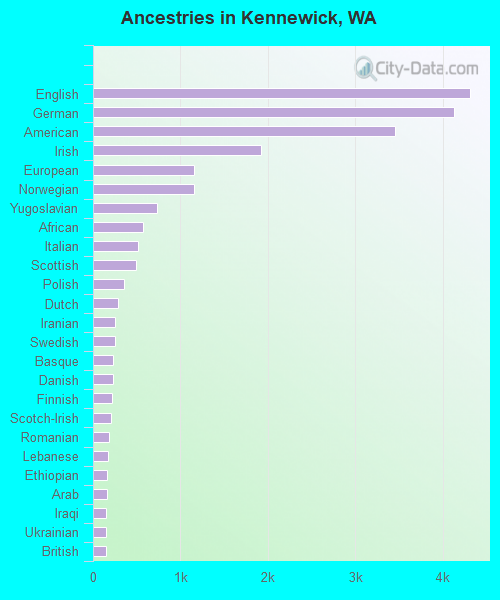
First ancestries reported:
English: 4,311 (9.2%)
German: 4,130 (8.8%)
American: 3,450 (7.4%)
Irish: 1,919 (4.1%)
European: 1,157 (2.5%)
Norwegian: 1,154 (2.5%)
Yugoslavian: 733 (1.6%)
African: 566 (1.2%)
Italian: 511 (1.1%)
Scottish: 495 (1.1%)
Polish: 356 (0.8%)
Dutch: 290 (0.6%)
Iranian: 251 (0.5%)
Swedish: 246 (0.5%)
Basque: 228 (0.5%)
Danish: 225 (0.5%)
Finnish: 215 (0.5%)
Scotch-Irish: 208 (0.4%)
Romanian: 187 (0.4%)
Lebanese: 169 (0.4%)
Ethiopian: 165 (0.4%)
Arab: 155 (0.3%)
Iraqi: 151 (0.3%)
Ukrainian: 150 (0.3%)
British: 144 (0.3%)
Welsh: 139 (0.3%)
French: 132 (0.3%)
Northern European: 131 (0.3%)
Hungarian: 114 (0.2%)
Scandinavian: 96 (0.2%)
Armenian: 85 (0.2%)
Croatian: 83 (0.2%)
French Canadian: 83 (0.2%)
Swiss: 82 (0.2%)
Sudanese: 74 (0.2%)
Czech: 61 (0.1%)
Russian: 50 (0.1%)
Guyanese: 41 (0.09%)
Latvian: 38 (0.08%)
Canadian: 38 (0.08%)
Eastern European: 33 (0.07%)
Belgian: 23 (0.05%)
Austrian: 18 (0.04%)
Australian: 17 (0.04%)
Czechoslovakian: 11 (0.02%)
Pennsylvania German: 11 (0.02%)
Greek: 10 (0.02%)
Slavic: 8 (0.02%)
Jamaican: 3 (0.01%)
Most common places of birth for foreign-born residents (%): Mexico Kennewick:
49.6% (5,982)Washington:
21.1% (241,655)
Cuba Kennewick:
4.0% (478)Washington:
0.3% (3,147)
Vietnam Kennewick:
3.3% (397)Washington:
5.4% (62,003)
Bosnia and Herzegovina Kennewick:
3.0% (356)Washington:
0.3% (3,825)
Guatemala Kennewick:
2.8% (333)Washington:
1.2% (13,855)
Canada Kennewick:
2.4% (290)Washington:
4.1% (47,238)
Philippines Kennewick:
2.0% (236)Washington:
6.3% (71,661)
Colombia Kennewick:
1.9% (234)Washington:
0.5% (5,640)
Pakistan Kennewick:
1.9% (225)Washington:
0.6% (6,294)
Burma (Myanmar) Kennewick:
1.6% (198)Washington:
0.3% (3,171)
Ethiopia Kennewick:
1.6% (193)Washington:
1.6% (17,938)
Iraq Kennewick:
1.6% (193)Washington:
0.5% (6,259)
Place of birth for U.S.-born residents:
This state: 48,157Other state: 25,595Northeast: 2,148Midwest: 3,833South: 4,022West: 15,592 85.6% of Kennewick residents lived in the same house 1 years ago.
Out of people who lived in different houses, 35.4% lived in this county.
Out of people who lived in different counties, 61.3% lived in Washington.
Kennewick:
85.6%State average:
85.2%
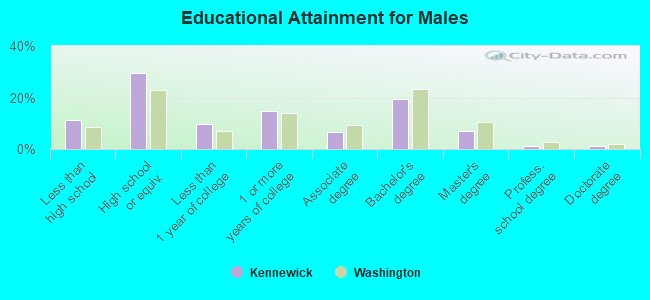
Education attainment for males 25 years and older:
No schooling: 287Nursery to 4th grade: 1055th and 6th grade: 3657th and 8th grade: 2669th grade: 65310th grade: 66911th grade: 6012th grade, no diploma: 602High school graduate (or equivalency): 7,716Less than 1 year of college: 2,506Some college more than 1 year, no degree: 3,851Associate degree: 1,687Bachelor's degree: 5,083Master's degree: 1,801Professional school degree: 307Doctorate degree: 318
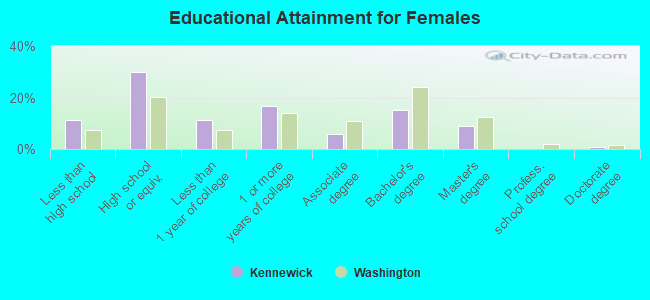
Education attainment for females 25 years and older:
No schooling: 711Nursery to 4th grade: 1945th and 6th grade: 6587th and 8th grade: 7029th grade: 47010th grade: 8111th grade: 19712th grade, no diploma: 0High school graduate (or equivalency): 8,130Less than 1 year of college: 3,050Some college more than 1 year, no degree: 4,582Associate degree: 1,586Bachelor's degree: 4,142Master's degree: 2,409Professional school degree: 38Doctorate degree: 232
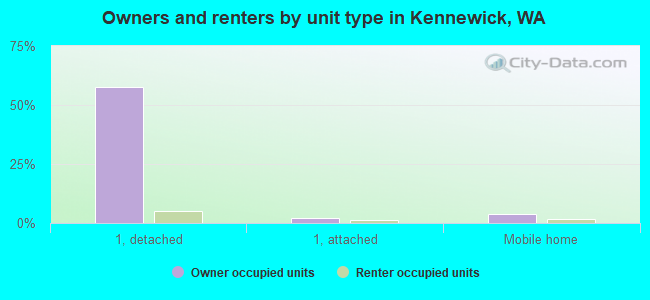
Housing units in structures:
One, detached: 19,470One, attached: 1,382Two: 1,4673 or 4: 1,5505 to 9: 1,54010 to 19: 94220 to 49: 79950 or more: 3,167Mobile homes: 1,257Boats, RVs, vans, etc.: 74Median worth of mobile homes: $63,777
Housing units lacking complete plumbing facilities in 2022: 0.7%Housing units lacking complete kitchen facilities in 2022: 2.4%House/condo owner moved in on average 10 years ago
Renter moved in on average 2 years ago
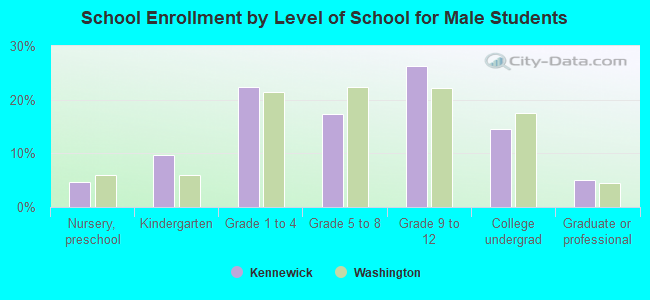
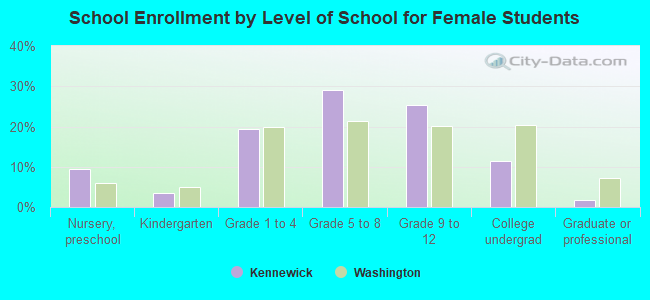
Private vs. public school enrollment:
Students in private schools in grades 1 to 8 (elementary and middle school): 817 Here:
8.9%Washington:
12.4%
Students in private schools in grades 9 to 12 (high school): 251 Students in private undergraduate colleges: 380 Here:
14.1%Washington:
16.5%