Housing density: 1,977 houses/condos per square mile
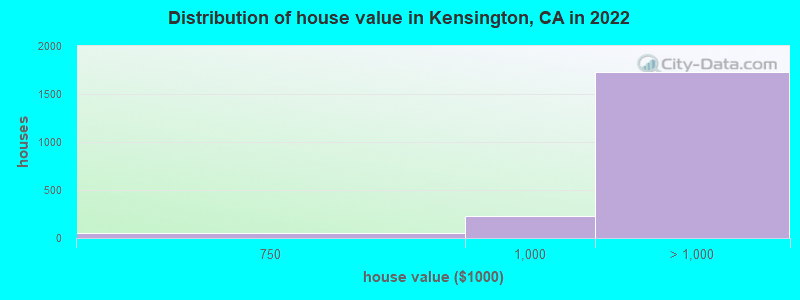
Median price asked for vacant for-sale houses and condos in 2022 in this county: $378,161.
Median contract rent in 2022: over $2,000
Median gross rent in Kensington, CA in 2022: over $2,000
Housing units in Kensington with a mortgage: 1,142 (137 second mortgage, 0 home equity loan, 134 both second mortgage and home equity loan) Houses without a mortgage: 0
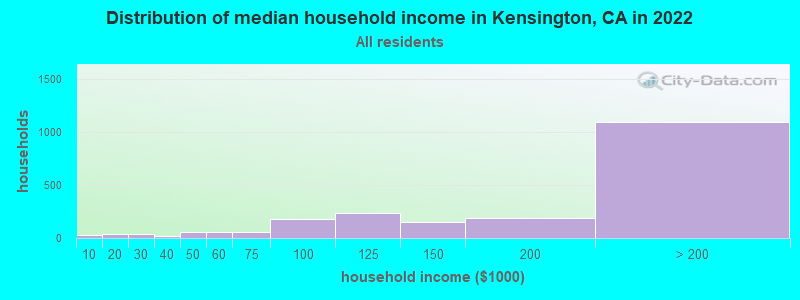
Median household income for houses/condos with a mortgage: $252,501
Median household income for apartments without a mortgage: $106,647
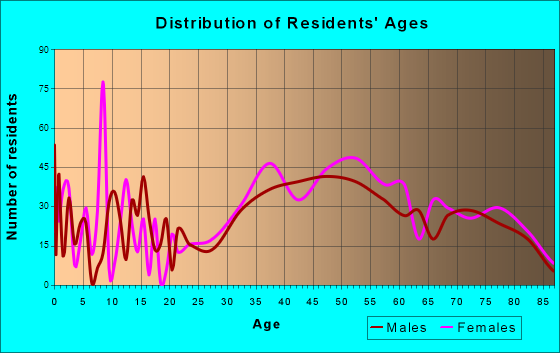
896 married couples with children.
202 single-parent households (18 men, 184 women).
81.3% of residents of Kensington speak English at home.
3.8% of residents speak Spanish at home (57% speak English very well, 24% speak English well, 19% speak English not well).
8.8% of residents speak other Indo-European language at home (99% speak English very well, 1% speak English well).
5.8% of residents speak Asian or Pacific Island language at home (36% speak English very well, 55% speak English well, 6% speak English not well, 3% don't speak English at all).
0.5% of residents speak other language at home (100% speak English very well).
Foreign born population: 738 (14.0%)
(77.8% of them are naturalized citizens)
Percentage of workers working in this county: 62.3% Number of people working at home: 1,449 (56.7% of all workers)
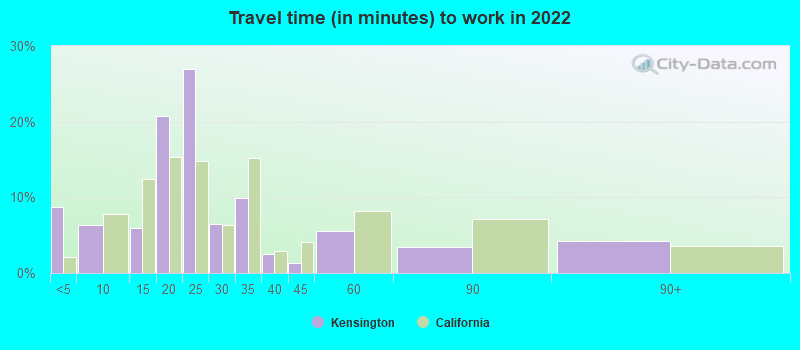
Travel time to work (commute)
Less than 5 minutes: 38
5 to 9 minutes: 40
10 to 14 minutes: 297
15 to 19 minutes: 128
20 to 24 minutes: 156
25 to 29 minutes: 76
30 to 34 minutes: 101
35 to 39 minutes: 45
40 to 44 minutes: 31
45 to 59 minutes: 136
60 to 89 minutes: 189
90 or more minutes: 79
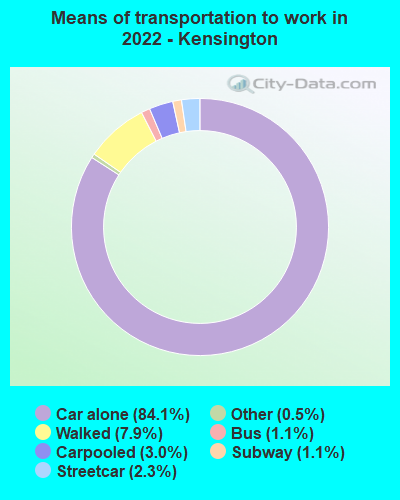
Means of transportation to work:
Drove a car alone: 716 (33.3%)
Carpooled: 28 (1.3%)
Bus: 7 (0.3%)
Subway or elevated rail: 13 (0.6%)
Long-distance train or commuter rail: 7 (0.3%)
Taxi: 4 (0.2%)
Walked: 95 (4.4%)
Worked at home: 1,449 (67.4%)
Unemployment by race in 2022
Unemployment rate for White non-Hispanic residents
4.6%Males
6.9%Females
Unemployment rate for Asian residents
11.8%Males
Unemployment rate for Hispanic or Latino residents
25.1%Females
Year of entry for the foreign-born population in Kensington, California
1372010 or later
1392000 to 2009
1411990 to 1999
1791980 to 1989
1341970 to 1979
365Before 1970
First ancestries reported:
European: 304 (11.6%)
English: 225 (8.6%)
French: 154 (5.9%)
Irish: 135 (5.1%)
German: 92 (3.5%)
Iranian: 92 (3.5%)
Danish: 90 (3.4%)
Italian: 73 (2.8%)
Russian: 57 (2.2%)
Northern European: 43 (1.6%)
Scottish: 36 (1.4%)
Cajun: 30 (1.1%)
Israeli: 29 (1.1%)
Swedish: 26 (1.0%)
Eastern European: 25 (1.0%)
Swiss: 21 (0.8%)
Finnish: 20 (0.8%)
American: 18 (0.7%)
British: 15 (0.6%)
Dutch: 14 (0.5%)
French Canadian: 13 (0.5%)
Polish: 13 (0.5%)
Ukrainian: 10 (0.4%)
Belgian: 9 (0.3%)
Greek: 9 (0.3%)
Lithuanian: 9 (0.3%)
Scotch-Irish: 8 (0.3%)
Norwegian: 6 (0.2%)
Jamaican: 5 (0.2%)
Hungarian: 3 (0.1%)
Most common places of birth for foreign-born residents (%):
India
Kensington:
12.6% (88)
California:
5.2% (539,184)
China, excluding Hong Kong and Taiwan
Kensington:
11.9% (83)
California:
6.6% (684,672)
Iran
Kensington:
11.5% (80)
California:
2.0% (206,004)
Germany
Kensington:
10.7% (75)
California:
0.7% (73,304)
France
Kensington:
5.7% (40)
California:
0.4% (40,224)
Denmark
Kensington:
5.6% (39)
California:
0.1% (6,555)
Russia
Kensington:
4.9% (34)
California:
0.7% (71,932)
Philippines
Kensington:
4.4% (31)
California:
7.8% (818,297)
Nepal
Kensington:
3.3% (23)
California:
0.2% (16,541)
United Kingdom, excluding England and Scotland
Kensington:
3.0% (21)
California:
0.6% (60,582)
Israel
Kensington:
2.9% (20)
California:
0.3% (33,029)
Hong Kong
Kensington:
2.6% (18)
California:
1.0% (105,215)
Dominican Republic
Kensington:
2.3% (16)
California:
0.1% (7,168)
Belgium
Kensington:
2.1% (15)
California:
0.1% (6,176)
Mexico
Kensington:
2.0% (14)
California:
37.2% (3,881,193)
Brazil
Kensington:
2.0% (14)
California:
0.5% (53,222)
Japan
Kensington:
1.6% (11)
California:
1.0% (103,575)
Peru
Kensington:
1.6% (11)
California:
0.7% (74,025)
Place of birth for U.S.-born residents:
This state: 2,826
Other state: 1,580
Northeast: 642
Midwest: 432
South: 398
West: 132
95.8% of Kensington residents lived in the same house 1 years ago. Out of people who lived in different houses, 3.8% lived in this county. Out of people who lived in different counties, 68.7% lived in California.
Kensington:
95.8%
State average:
88.9%
Education attainment for males 25 years and older:
No schooling: 24
Nursery to 4th grade: 0
5th and 6th grade: 0
7th and 8th grade: 0
9th grade: 9
10th grade: 0
11th grade: 0
12th grade, no diploma: 3
High school graduate (or equivalency): 55
Less than 1 year of college: 12
Some college more than 1 year, no degree: 218
Associate degree: 11
Bachelor's degree: 578
Master's degree: 476
Professional school degree: 218
Doctorate degree: 334
Education attainment for females 25 years and older:
No schooling: 12
Nursery to 4th grade: 0
5th and 6th grade: 0
7th and 8th grade: 7
9th grade: 0
10th grade: 5
11th grade: 0
12th grade, no diploma: 0
High school graduate (or equivalency): 52
Less than 1 year of college: 36
Some college more than 1 year, no degree: 137
Associate degree: 33
Bachelor's degree: 696
Master's degree: 567
Professional school degree: 193
Doctorate degree: 296
Housing units in structures:
One, detached: 2,126
One, attached: 25
Two: 117
Housing units lacking complete kitchen facilities in 2022: 0.4%
House/condo owner moved in on average 20 years ago