Lawrence, IN (Indiana) Houses and Residents
Estimated median house or condo value in 2022: $227,399 (it was $102,900 in 2000 )
Lawrence:
$227,399Indiana:
$208,700
Lower value quartile - upper value quartile: $154,392 - $312,310Mean price in 2022: Detached houses: $228,208 Here:
$228,208State:
$257,916
Townhouses or other attached units: $183,469 Here:
$183,469State:
$224,114
In 3-to-4-unit structures: $153,878 Here:
$153,878State:
$151,116
In 5-or-more-unit structures: $194,124 Here:
$194,124State:
$200,844
Mobile homes: $25,187 Here:
$25,187State:
$67,116
Total population: 47,550 (Urban population: 38,800, Rural population: 437 (all nonfarm) )
Houses: 20,466 (19,172 occupied: 12,655 owner occupied, 6,889 renter occupied )
% of renters here:
35%State:
29%
Housing density: 1,019 houses/condos per square mile
Median price asked for vacant for-sale houses and condos in 2022: $136,307.
Median contract rent in 2022: $857 (lower quartile is $692, upper quartile is $1,179)
Median rent asked for vacant for-rent units in 2022: $1,075
Median gross rent in Lawrence, IN in 2022: $1,062
Housing units in Lawrence with a mortgage: 9,190 (677 second mortgage, 39 home equity loan, 574 both second mortgage and home equity loan )Houses without a mortgage: 155
Median household income for houses/condos with a mortgage: $107,315
Median household income for apartments without a mortgage: $73,004
Median monthly housing costs: $1,117
Data:
Median house or condo value ($)
Median house or condo value ($ change since 2000)
Median house or condo value ($) - White
Median house or condo value ($) - Black or African American
Median house or condo value ($) - Asian
Median house or condo value ($) - Hispanic or Latino
Median house or condo value ($) - American Indian and Alaska Native
Median house or condo value ($) - Multirace
Median house or condo value ($) - Other Race
Median price asked for mobile homes ($)
Household density (households per square mile)
Mean house or condo value by units in structure - 1, detached ($)
Mean house or condo value by units in structure - 1, attached ($)
Mean house or condo value by units in structure - 2 ($)
Mean house or condo value by units in structure by units in structure - 3 or 4 ($)
Mean house or condo value by units in structure - 5 or more ($)
Mean house or condo value by units in structure - Boat, RV, van, etc. ($)
Mean house or condo value by units in structure - Mobile home ($)
Median contract rent ($)
Median contract rent - Lower quartile ($)
Median contract rent - Upper quartile ($)
Median gross rent ($)
Urban houses (%)
Rural houses (%)
Houses occupied (%)
Houses occupied (% change since 2000)
Houses owner occupied (%)
Houses owner occupied (% change since 2000)
Houses renter occupied (%)
Houses renter occupied (% change since 2000)
Vacant housing units - For rent (%)
Vacant housing units - For rent (% change since 2000)
Vacant housing units - For sale only (%)
Vacant housing units - For sale only (% change since 2000)
Vacant housing units - Rented or sold, not occupied (%)
Vacant housing units - Rented or sold, not occupied (% change since 2000)
Vacant housing units - For seasonal, recreational, or occasional use (%)
Vacant housing units - For seasonal, recreational, or occasional use (% change since 2000)
Vacant housing units - For migrant workers (%)
Vacant housing units - For migrant workers (% change since 2000)
Vacant housing units - Other vacant (%)
Vacant housing units - Other vacant (% change since 2000)
Median monthly housing costs ($)
Median household income for houses/condos with a mortgage ($)
Median household income for houses/condos without a mortgage ($)
Median household income ($)
Median household income ($) - White
Median household income ($) - Black or African American
Median household income ($) - Asian
Median household income ($) - Hispanic or Latino
Median household income ($) - American Indian and Alaska Native
Median household income ($) - Multirace
Median household income ($) - Other Race
Mortgage status - with mortgage (%)
Mortgage status - with second mortgage (%)
Mortgage status - with home equity loan (%)
Mortgage status - with both second mortgage and home equity loan (%)
Mortgage status - without a mortgage (%)
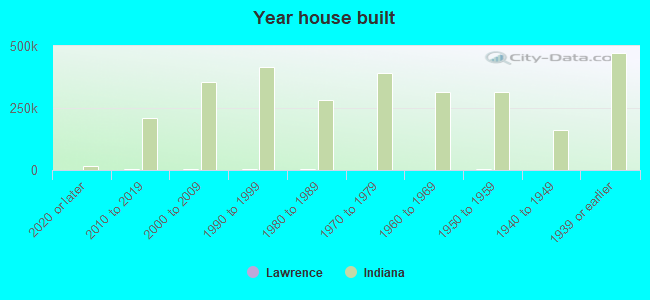
Median year house/condo built
Median year apartment built
Household type by relationship - Male householder living alone (%)
Household type by relationship - Male householder not living alone (%)
Household type by relationship - Female householder living alone (%)
Household type by relationship - Female householder not living alone (%)
Household type by relationship - Opposite-Sex spouse (%)
Household type by relationship - Same-Sex spouse (%)
Household type by relationship - Opposite-Sex unmarried partner (%)
Household type by relationship - Same-Sex unmarried partner (%)
Household type by relationship - In group quarters (%)
Size of family households - 2-person household (%)
Size of family households - 3-person household (%)
Size of family households - 4-person household (%)
Size of family households - 5-person household (%)
Size of family households - 6-person household (%)
Size of family households - 7-or-more-person household (%)
Size of nonfamily households - 1-person household (%)
Size of nonfamily households - 2-person household (%)
Size of nonfamily households - 3-person household (%)
Size of nonfamily households - 4-person household (%)
Size of nonfamily households - 5-person household (%)
Size of nonfamily households - 6-person household (%)
Size of nonfamily households - 7-or-moreperson household (%)
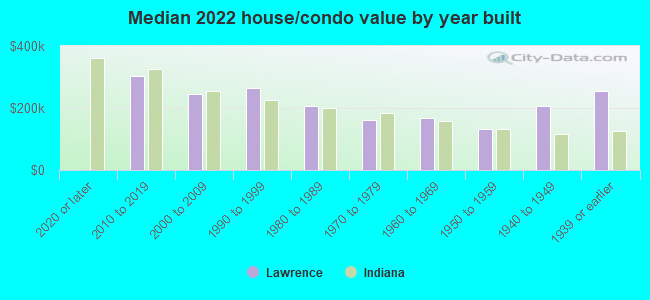
Year house built - Built 2010 or later (%)
Year house built - Built 2000 to 2009 (%)
Year house built - Built 1990 to 1999 (%)
Year house built - Built 1980 to 1989 (%)
Year house built - Built 1970 to 1979 (%)
Year house built - Built 1960 to 1969 (%)
Year house built - Built 1950 to 1959 (%)
Year house built - Built 1940 to 1949 (%)
Year house built - Built 1939 or earlier (%)
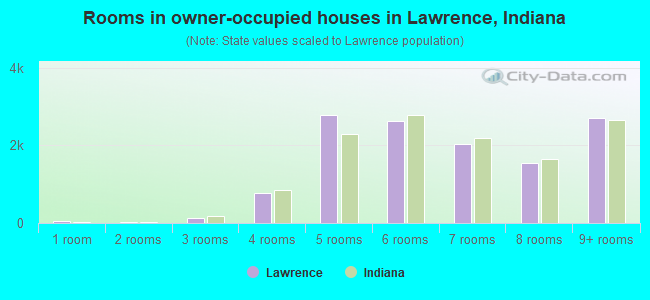
Median number of rooms in houses and condos
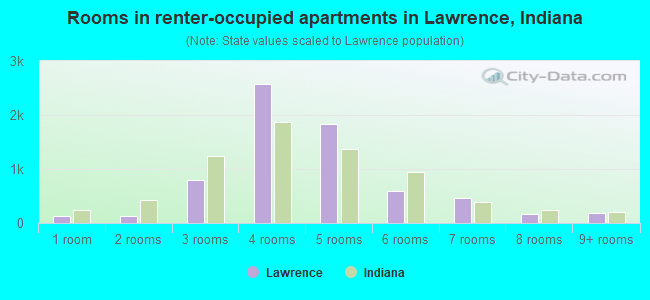
Median number of rooms in apartments
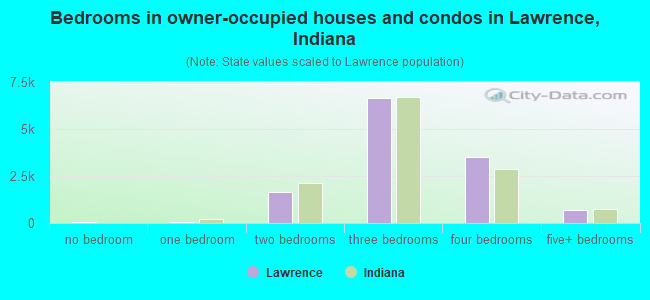
Median number of bedrooms in owner occupied houses
Mean number of bedrooms in owner occupied houses
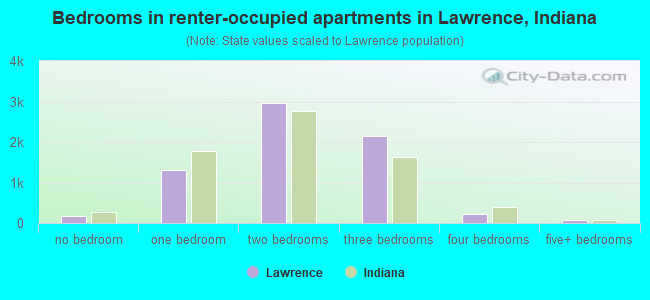
Median number of bedrooms in renter occupied houses
Mean number of bedrooms in renter occupied houses
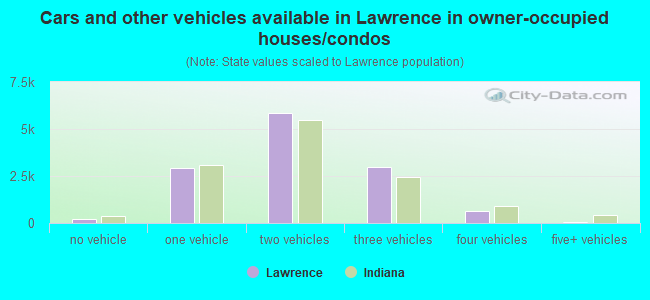
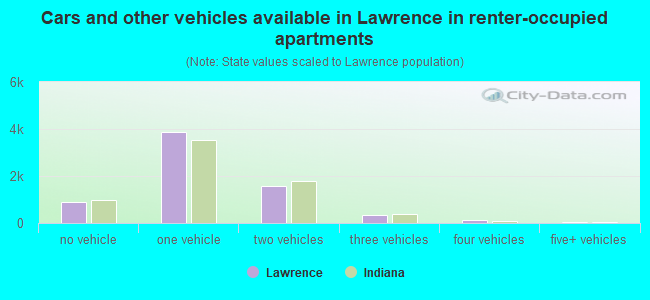
Median number of vehichles in owner occupied houses
Mean number of vehichles in owner occupied houses
Median number of vehichles in renter occupied houses
Mean number of vehichles in renter occupied houses
Rooms in owner-occupied houses - 1 room (%)
Rooms in owner-occupied houses - 2 rooms (%)
Rooms in owner-occupied houses - 3 rooms (%)
Rooms in owner-occupied houses - 4 rooms (%)
Rooms in owner-occupied houses - 5 rooms (%)
Rooms in owner-occupied houses - 6 rooms (%)
Rooms in owner-occupied houses - 7 rooms (%)
Rooms in owner-occupied houses - 8 rooms (%)
Rooms in owner-occupied houses - 9+ rooms (%)
Rooms in renter-occupied houses - 1 room (%)
Rooms in renter-occupied houses - 2 rooms (%)
Rooms in renter-occupied houses - 3 rooms (%)
Rooms in renter-occupied houses - 4 rooms (%)
Rooms in renter-occupied houses - 5 rooms (%)
Rooms in renter-occupied houses - 6 rooms (%)
Rooms in renter-occupied houses - 7 rooms (%)
Rooms in renter-occupied houses - 8 rooms (%)
Rooms in renter-occupied houses - 9+ rooms (%)
Bedrooms in owner-occupied houses - no bedrooms (%)
Bedrooms in owner-occupied houses - 1 bedroom (%)
Bedrooms in owner-occupied houses - 2 bedrooms (%)
Bedrooms in owner-occupied houses - 3 bedrooms (%)
Bedrooms in owner-occupied houses - 4 bedrooms (%)
Bedrooms in owner-occupied houses - 5+ bedrooms (%)
Bedrooms in renter-occupied houses - no bedrooms (%)
Bedrooms in renter-occupied houses - 1 bedroom (%)
Bedrooms in renter-occupied houses - 2 bedrooms (%)
Bedrooms in renter-occupied houses - 3 bedrooms (%)
Bedrooms in renter-occupied houses - 4 bedrooms (%)
Bedrooms in renter-occupied houses - 5+ bedrooms (%)
Vehicles available in owner-occupied houses - no vehicle available (%)
Vehicles available in owner-occupied houses - 1 vehicle available(%)
Vehicles available in owner-occupied houses - 2 Vehicles available (%)
Vehicles available in owner-occupied houses - 3 Vehicles available (%)
Vehicles available in owner-occupied houses - 4 Vehicles available (%)
Vehicles available in owner-occupied houses - 5+ Vehicles available (%)
Vehicles available in renter-occupied houses - no vehicle available (%)
Vehicles available in renter-occupied houses - 1 vehicle available (%)
Vehicles available in renter-occupied houses - 2 Vehicles available (%)
Vehicles available in renter-occupied houses - 3 Vehicles available (%)
Vehicles available in renter-occupied houses - 4 Vehicles available (%)
Vehicles available in renter-occupied houses - 5+ Vehicles available (%)
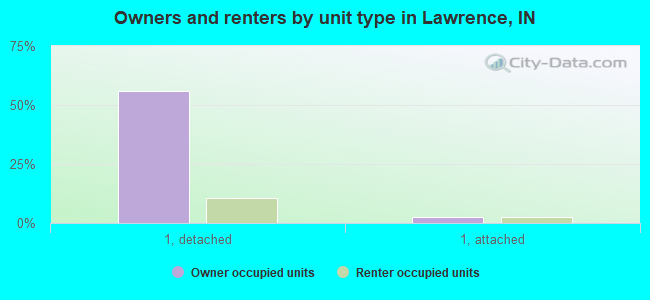
Housing units in structures - 1, detached (%)
Housing units in structures - 1, attached (%)
Housing units in structures - 2 (%)
Housing units in structures - 3 or 4 (%)
Housing units in structures - 5 to 9 (%)
Housing units in structures - 10 to 19 (%)
Housing units in structures - 20 to 49 (%)
Housing units in structures - 50 or more (%)
Housing units in structures - Mobile home (%)
Housing units in structures - Boat, RV, van, etc. (%)
Housing units in structures - Owners - 1, detached (%)
Housing units in structures - Owners - 1, attached (%)
Housing units in structures - Owners - 2 (%)
Housing units in structures - Owners - 3 or 4 (%)
Housing units in structures - Owners - 5 to 9 (%)
Housing units in structures - Owners - 10 to 19 (%)
Housing units in structures - Owners - 20 to 49 (%)
Housing units in structures - Owners - 50 or more (%)
Housing units in structures - Owners - Mobile home (%)
Housing units in structures - Owners - Boat, RV, van, etc. (%)
Housing units in structures - Renters - 1, detached (%)
Housing units in structures - Renters - 1, attached (%)
Housing units in structures - Renters - 2 (%)
Housing units in structures - Renters - 3 or 4 (%)
Housing units in structures - Renters - 5 to 9 (%)
Housing units in structures - Renters - 10 to 19 (%)
Housing units in structures - Renters - 20 to 49 (%)
Housing units in structures - Renters - 50 or more (%)
Housing units in structures - Renters - Mobile home (%)
Housing units in structures - Renters - Boat, RV, van, etc. (%)
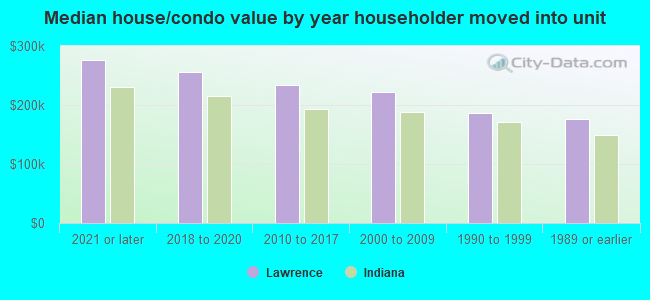
House/condo owner moved in on average (years ago)
Renter moved in on average (years ago)
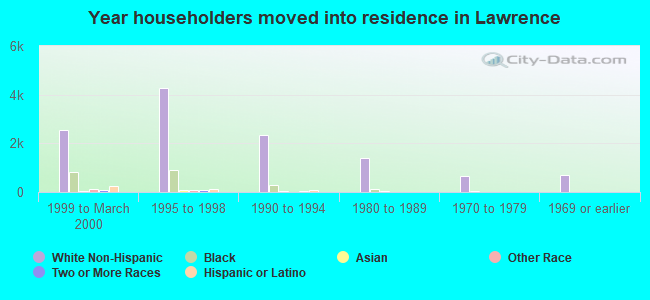
Year householder moved into unit - Moved in 1999 to March 2000 (%)
Year householder moved into unit - Moved in 1999 to March 2000 (%) - White
Year householder moved into unit - Moved in 1999 to March 2000 (%) - Black or African American
Year householder moved into unit - Moved in 1999 to March 2000 (%) - Asian
Year householder moved into unit - Moved in 1999 to March 2000 (%) - Hispanic or Latino
Year householder moved into unit - Moved in 1999 to March 2000 (%) - American Indian and Alaska Native
Year householder moved into unit - Moved in 1999 to March 2000 (%) - Multirace
Year householder moved into unit - Moved in 1999 to March 2000 (%) - Other Race
Year householder moved into unit - Moved in 1995 to 1998 (%)
Year householder moved into unit - Moved in 1995 to 1998 (%) - White
Year householder moved into unit - Moved in 1995 to 1998 (%) - Black or African American
Year householder moved into unit - Moved in 1995 to 1998 (%) - Asian
Year householder moved into unit - Moved in 1995 to 1998 (%) - Hispanic or Latino
Year householder moved into unit - Moved in 1995 to 1998 (%) - American Indian and Alaska Native
Year householder moved into unit - Moved in 1995 to 1998 (%) - Multirace
Year householder moved into unit - Moved in 1995 to 1998 (%) - Other Race
Year householder moved into unit - Moved in 1990 to 1994 (%)
Year householder moved into unit - Moved in 1990 to 1994 (%) - White
Year householder moved into unit - Moved in 1990 to 1994 (%) - Black or African American
Year householder moved into unit - Moved in 1990 to 1994 (%) - Asian
Year householder moved into unit - Moved in 1990 to 1994 (%) - Hispanic or Latino
Year householder moved into unit - Moved in 1990 to 1994 (%) - American Indian and Alaska Native
Year householder moved into unit - Moved in 1990 to 1994 (%) - Multirace
Year householder moved into unit - Moved in 1990 to 1994 (%) - Other Race
Year householder moved into unit - Moved in 1980 to 1989 (%)
Year householder moved into unit - Moved in 1980 to 1989 (%) - White
Year householder moved into unit - Moved in 1980 to 1989 (%) - Black or African American
Year householder moved into unit - Moved in 1980 to 1989 (%) - Asian
Year householder moved into unit - Moved in 1980 to 1989 (%) - Hispanic or Latino
Year householder moved into unit - Moved in 1980 to 1989 (%) - American Indian and Alaska Native
Year householder moved into unit - Moved in 1980 to 1989 (%) - Multirace
Year householder moved into unit - Moved in 1980 to 1989 (%) - Other Race
Year householder moved into unit - Moved in 1970 to 1979 (%)
Year householder moved into unit - Moved in 1970 to 1979 (%) - White
Year householder moved into unit - Moved in 1970 to 1979 (%) - Black or African American
Year householder moved into unit - Moved in 1970 to 1979 (%) - Asian
Year householder moved into unit - Moved in 1970 to 1979 (%) - Hispanic or Latino
Year householder moved into unit - Moved in 1970 to 1979 (%) - American Indian and Alaska Native
Year householder moved into unit - Moved in 1970 to 1979 (%) - Multirace
Year householder moved into unit - Moved in 1970 to 1979 (%) - Other Race
Year householder moved into unit - Moved in 1969 or earlier (%)
Year householder moved into unit - Moved in 1969 or earlier (%) - White
Year householder moved into unit - Moved in 1969 or earlier (%) - Black or African American
Year householder moved into unit - Moved in 1969 or earlier (%) - Asian
Year householder moved into unit - Moved in 1969 or earlier (%) - Hispanic or Latino
Year householder moved into unit - Moved in 1969 or earlier (%) - American Indian and Alaska Native
Year householder moved into unit - Moved in 1969 or earlier (%) - Multirace
Year householder moved into unit - Moved in 1969 or earlier (%) - Other Race
Housing units lacking complete plumbing facilities (%)
Housing units lacking complete kitchen facilities (%)
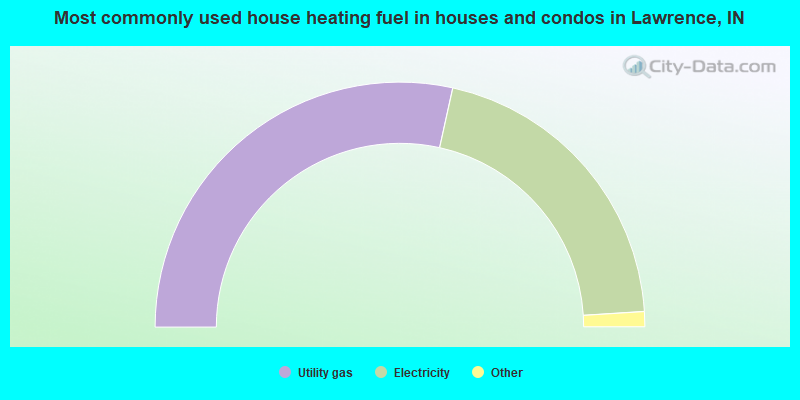
House heating fuel used in houses and condos - Utility gas (%)
House heating fuel used in houses and condos - Bottled, tank, or LP gas (%)
House heating fuel used in houses and condos - Electricity (%)
House heating fuel used in houses and condos - Fuel oil, kerosene, etc. (%)
House heating fuel used in houses and condos - Coal or coke (%)
House heating fuel used in houses and condos - Wood (%)
House heating fuel used in houses and condos - Solar energy (%)
House heating fuel used in houses and condos - Other fuel (%)
House heating fuel used in houses and condos - No fuel used (%)
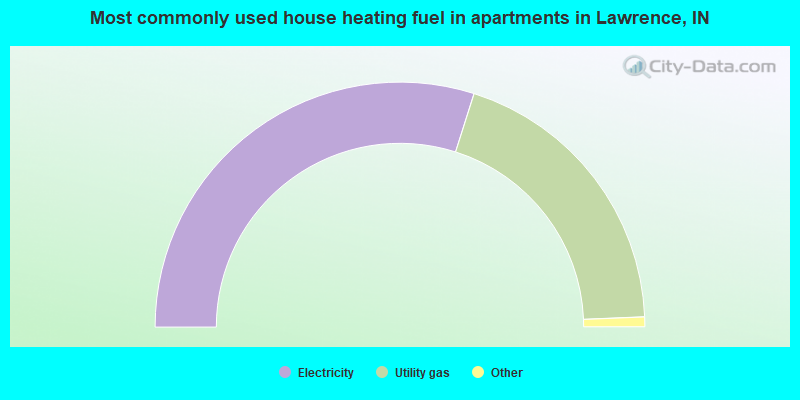
House heating fuel used in apartments - Utility gas (%)
House heating fuel used in apartments - Bottled, tank, or LP gas (%)
House heating fuel used in apartments - Electricity (%)
House heating fuel used in apartments - Fuel oil, kerosene, etc. (%)
House heating fuel used in apartments - Coal or coke (%)
House heating fuel used in apartments - Wood (%)
House heating fuel used in apartments - Solar energy (%)
House heating fuel used in apartments - Other fuel (%)
House heating fuel used in apartments - No fuel used (%)
Latest news about housing in Lawrence, IN collected exclusively by city-data.com from local newspapers, TV, and radio stations
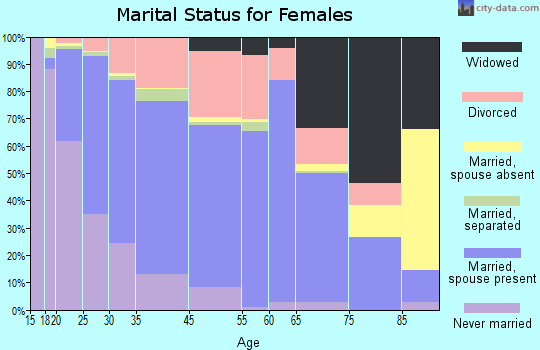
Median year house/condo built: 1996Median year apartment built: 1988Household type by relationship:
Households: 49,102
Male householders: 8,590 (2,359 living alone ), Female householders: 10,357 (3,165 living alone )8,008 spouses (7,887 opposite-sex spouses ), 1,959 unmarried partners , (1,831 opposite-sex unmarried partners ), 15,556 children (14,498 natural , 261 adopted , 797 stepchildren ), 1,041 grandchildren , 569 brothers or sisters , 477 parents , 140 foster children , 808 other relatives , 1,395 non-relatives In group quarters: 196
Size of family households: 5,555 2-persons , 2,561 3-persons , 2,459 4-persons , 1,236 5-persons , 226 6-persons , 182 7-or-more-persons .
Size of nonfamily households: 5,348 1-person , 1,754 2-persons , 228 3-persons , 9 5-persons .
8,855 married couples with children. single-parent households (536 men , 2,752 women ).
80.7% of residents of Lawrence speak English at home. of residents speak Spanish at home (35% speak English very well , 29% speak English well , 31% speak English not well , 5% don't speak English at all ).of residents speak other Indo-European language at home (91% speak English very well , 9% speak English well ).of residents speak Asian or Pacific Island language at home (86% speak English very well , 7% speak English well , 7% speak English not well ).of residents speak other language at home (100% speak English very well ).
Foreign born population: 6,075 (12.4%)of them are naturalized citizens )
Median number of rooms in houses and condos:
Median number of rooms in apartments
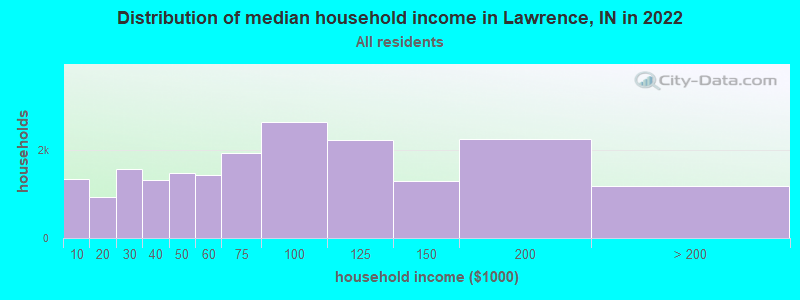
Lawrence, IN household income distribution 1,338 Less than $10,000930 $10,000 to $19,9991,563 $20,000 to $29,9991,326 $30,000 to $39,9991,468 $40,000 to $49,9991,430 $50,000 to $59,9991,927 $60,000 to $74,9992,639 $75,000 to $99,9992,223 $100,000 to $124,9991,289 $125,000 to $149,9992,247 $150,000 to $199,9991,175 $200,000 or more
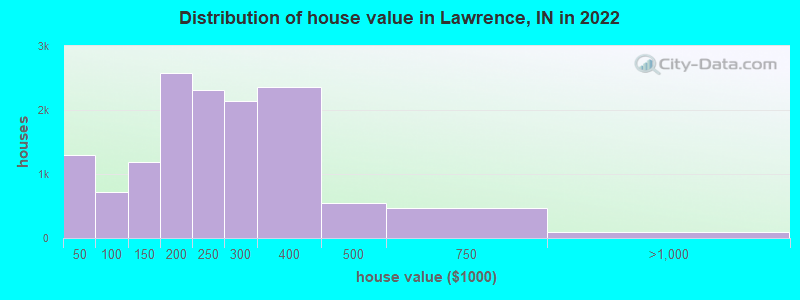
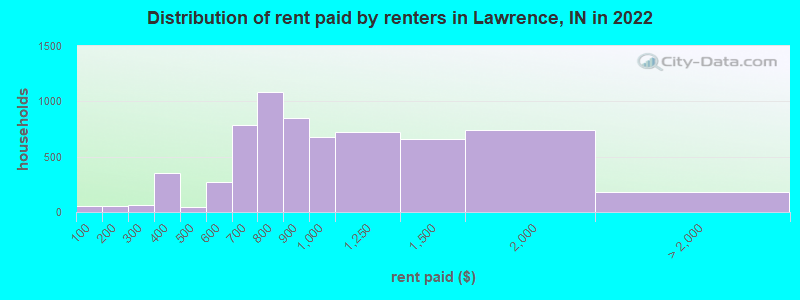
Home value of owner - occupied houses in 2022 in Lawrence, IN 328 Less than $10,00083 $10,000 to $14,999190 $15,000 to $19,99996 $20,000 to $24,999297 $25,000 to $29,999114 $30,000 to $34,999123 $35,000 to $39,99958 $40,000 to $49,999161 $50,000 to $59,99978 $60,000 to $69,999115 $70,000 to $79,999185 $80,000 to $89,999120 $90,000 to $99,999617 $100,000 to $124,999571 $125,000 to $149,9991,375 $150,000 to $174,9991,200 $175,000 to $199,9992,318 $200,000 to $249,9992,143 $250,000 to $299,9992,367 $300,000 to $399,999549 $400,000 to $499,999461 $500,000 to $749,99956 $750,000 to $999,9996 $1,000,000 to $1,499,99929 $2,000,000 or moreRent paid by renters in 2022 in Lawrence, IN 56 Less than $10027 $100 to $14930 $150 to $19938 $200 to $24925 $250 to $299347 $350 to $39943 $450 to $499145 $500 to $549121 $550 to $599443 $600 to $649341 $650 to $699391 $700 to $749689 $750 to $799846 $800 to $899681 $900 to $999721 $1,000 to $1,249663 $1,250 to $1,499740 $1,500 to $1,99958 $2,000 to $2,49930 $2,500 to $2,99915 $3,000 to $3,49917 $3,500 or more54 No cash rent
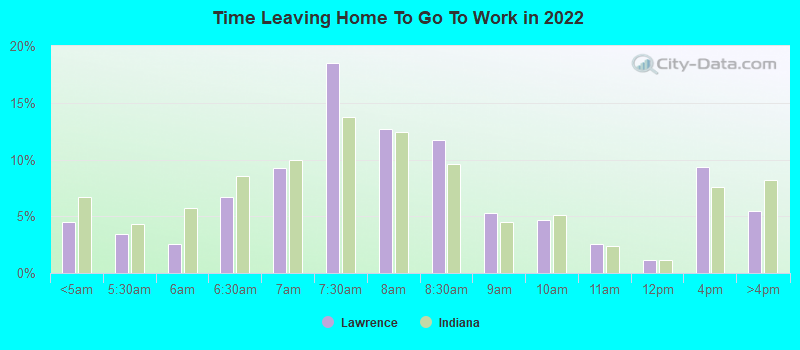
Percentage of workers working in this county: 79.0%Number of people working at home: 4,027 (15.2% of all workers )
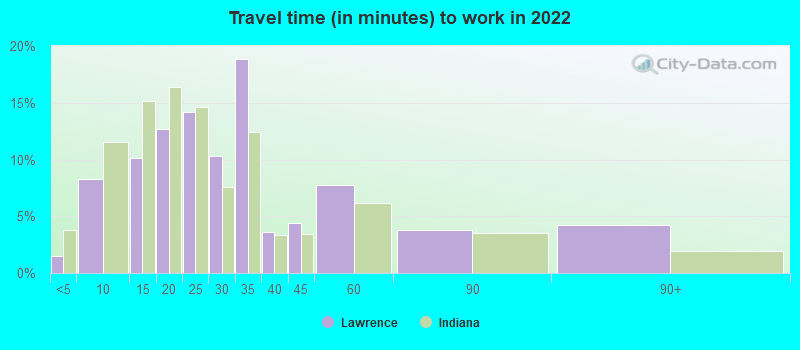
Travel time to work (commute)
Less than 5 minutes: 2385 to 9 minutes: 1,88410 to 14 minutes: 2,29815 to 19 minutes: 2,68520 to 24 minutes: 3,64325 to 29 minutes: 2,77730 to 34 minutes: 4,86935 to 39 minutes: 1,01040 to 44 minutes: 1,05445 to 59 minutes: 1,20360 to 89 minutes: 50490 or more minutes: 390
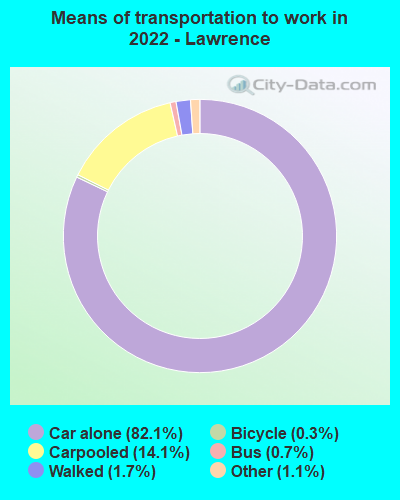
Means of transportation to work:
Drove a car alone: 13,169 (66.4%)Carpooled: 2,628 (13.3%)Bus : 90 (0.5%)Taxi: 259 (1.3%)Bicycle: 59 (0.3%)Walked: 277 (1.4%)Worked at home: 4,027 (20.3%)
Unemployment by race in 2022
Unemployment rate for White non-Hispanic residents 5.1% Males1.0% FemalesUnemployment rate for Black residents 11.7% Males6.4% FemalesUnemployment rate for American Indian and Alaska Native residents 5.8% MalesUnemployment rate for other race residents 8.6% FemalesUnemployment rate for two or more race residents 7.3% Males2.8% FemalesUnemployment rate for Hispanic or Latino residents 0.5% Males5.9% Females
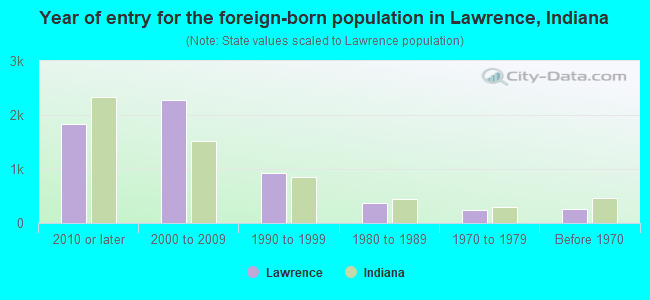
Year of entry for the foreign-born population in Lawrence, Indiana
1,828 2010 or later 2,287 2000 to 2009 923 1990 to 1999 372 1980 to 1989 234 1970 to 1979 253 Before 1970
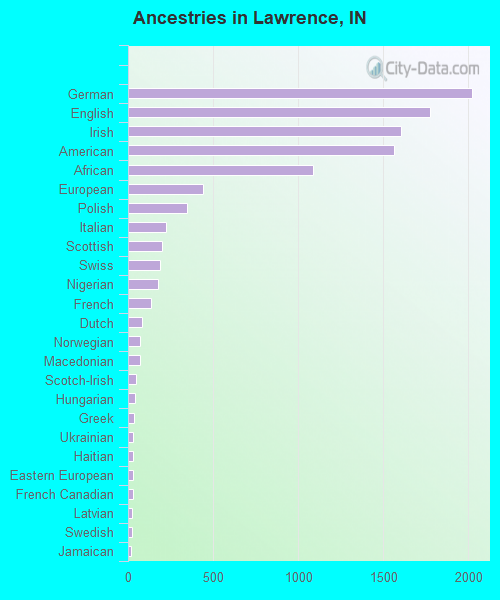
First ancestries reported:
German: 2,021 (7.7%)
English: 1,778 (6.8%)
Irish: 1,607 (6.1%)
American: 1,563 (5.9%)
African: 1,087 (4.1%)
European: 440 (1.7%)
Polish: 347 (1.3%)
Italian: 224 (0.9%)
Scottish: 202 (0.8%)
Swiss: 191 (0.7%)
Nigerian: 176 (0.7%)
French: 136 (0.5%)
Dutch: 80 (0.3%)
Norwegian: 72 (0.3%)
Macedonian: 72 (0.3%)
Scotch-Irish: 47 (0.2%)
Hungarian: 44 (0.2%)
Greek: 36 (0.1%)
Ukrainian: 31 (0.1%)
Haitian: 31 (0.1%)
Eastern European: 27 (0.1%)
French Canadian: 27 (0.1%)
Latvian: 25 (0.09%)
Swedish: 25 (0.09%)
Jamaican: 19 (0.07%)
Danish: 14 (0.05%)
British: 13 (0.05%)
Northern European: 11 (0.04%)
Scandinavian: 11 (0.04%)
Austrian: 10 (0.04%)
Canadian: 10 (0.04%)
Ugandan: 8 (0.03%)
Russian: 8 (0.03%)
Alsatian: 7 (0.03%)
Romanian: 6 (0.02%) Most common places of birth for foreign-born residents (%): Mexico Lawrence:
35.7% (2,001)Indiana:
27.0% (101,996)
Cameroon Lawrence:
9.4% (529)Indiana:
0.2% (832)
Guatemala Lawrence:
8.7% (486)Indiana:
2.3% (8,656)
Honduras Lawrence:
8.6% (481)Indiana:
1.6% (5,892)
El Salvador Lawrence:
8.5% (476)Indiana:
2.2% (8,253)
Thailand Lawrence:
4.5% (251)Indiana:
1.4% (5,446)
Colombia Lawrence:
3.8% (212)Indiana:
0.8% (3,114)
Zimbabwe Lawrence:
2.8% (157)Indiana:
0.3% (1,036)
Nigeria Lawrence:
2.6% (145)Indiana:
3.3% (12,337)
Philippines Lawrence:
2.5% (138)Indiana:
3.1% (11,851)
Place of birth for U.S.-born residents:
This state: 29,771Other state: 12,483Northeast: 1,953Midwest: 5,040South: 4,212West: 1,300 88.7% of Lawrence residents lived in the same house 1 years ago.
Out of people who lived in different houses, 33.8% lived in this county.
Out of people who lived in different counties, 85.6% lived in Indiana.
Lawrence:
88.7%State average:
87.1%
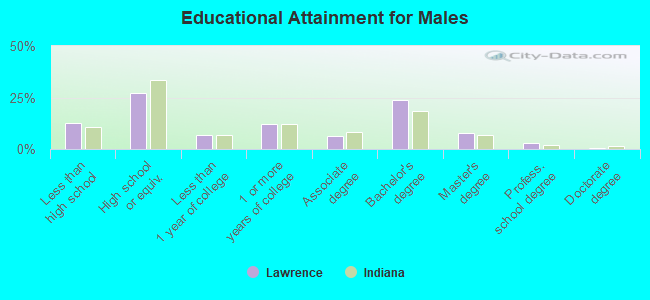
Education attainment for males 25 years and older:
No schooling: 246Nursery to 4th grade: 405th and 6th grade: 2247th and 8th grade: 519th grade: 15410th grade: 5211th grade: 30712th grade, no diploma: 897High school graduate (or equivalency): 4,149Less than 1 year of college: 1,035Some college more than 1 year, no degree: 1,856Associate degree: 965Bachelor's degree: 3,625Master's degree: 1,170Professional school degree: 482Doctorate degree: 80
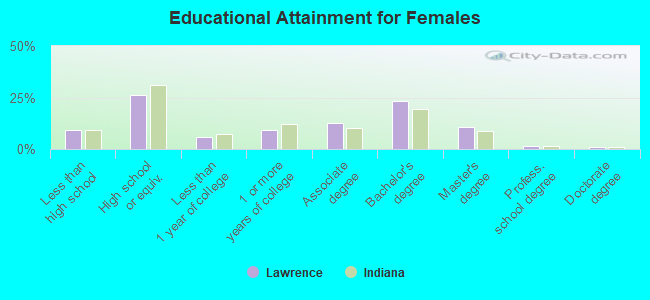
Education attainment for females 25 years and older:
No schooling: 246Nursery to 4th grade: 405th and 6th grade: 1597th and 8th grade: 1619th grade: 12710th grade: 17611th grade: 21412th grade, no diploma: 443High school graduate (or equivalency): 4,361Less than 1 year of college: 979Some college more than 1 year, no degree: 1,527Associate degree: 2,077Bachelor's degree: 3,823Master's degree: 1,770Professional school degree: 270Doctorate degree: 176
Housing units in structures:
One, detached: 13,216One, attached: 919Two: 1803 or 4: 3835 to 9: 1,39910 to 19: 1,41120 to 49: 25350 or more: 613Mobile homes: 2,088Median worth of mobile homes: $43,152
Housing units lacking complete plumbing facilities in 2022: 1.7%Housing units lacking complete kitchen facilities in 2022: 1.4%House/condo owner moved in on average 9 years ago
Renter moved in on average 3 years ago
Private vs. public school enrollment:
Students in private schools in grades 1 to 8 (elementary and middle school): 836 Students in private schools in grades 9 to 12 (high school): 379 Students in private undergraduate colleges: 261