Lee's Summit, MO (Missouri) Houses and Residents
Estimated median house or condo value in 2022: $339,900 (it was $131,700 in 2000 )
Lee's Summit:
$339,900Missouri:
$221,200
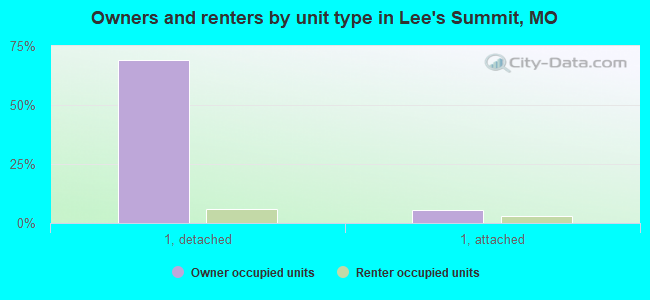
Lower value quartile - upper value quartile: $254,700 - $446,200Mean price in 2022: Detached houses: $351,277 Here:
$351,277State:
$278,068
Townhouses or other attached units: $203,837 Here:
$203,837State:
$260,773
In 2-unit structures: $161,525 Here:
$161,525State:
$172,667
In 3-to-4-unit structures: $107,611 Here:
$107,611State:
$181,162
In 5-or-more-unit structures: $196,546 Here:
$196,546State:
$263,082
Mobile homes: $421,647 Here:
$421,647State:
$95,912
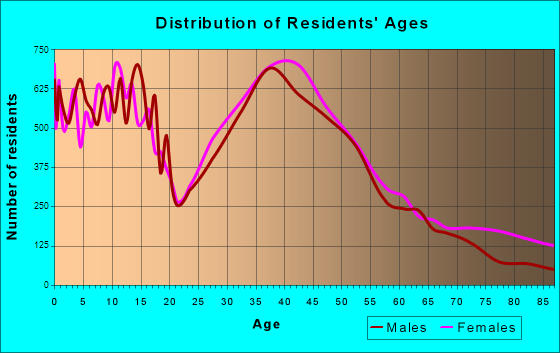
Total population: 93,864 (Urban population: 68,253, Rural population: 2,821 (all nonfarm) )
Houses: 42,171 (40,527 occupied: 28,925 owner occupied, 11,602 renter occupied )
% of renters here:
29%State:
32%
Housing density: 709 houses/condos per square mile
Median price asked for vacant for-sale houses and condos in 2022: $292,008.
Median contract rent in 2022: $1,095 (lower quartile is $926, upper quartile is $1,495)
Median rent asked for vacant for-rent units in 2022: $1,371
Median gross rent in Lee's Summit, MO in 2022: $1,274
Housing units in Lee's Summit with a mortgage: 19,550 (1,517 second mortgage, 0 home equity loan, 1,379 both second mortgage and home equity loan )Houses without a mortgage: 397
Median household income for houses/condos with a mortgage: $122,674
Median household income for apartments without a mortgage: $81,839
Median monthly housing costs: $1,408
Data:
Median house or condo value ($)
Median house or condo value ($ change since 2000)
Median house or condo value ($) - White
Median house or condo value ($) - Black or African American
Median house or condo value ($) - Asian
Median house or condo value ($) - Hispanic or Latino
Median house or condo value ($) - American Indian and Alaska Native
Median house or condo value ($) - Multirace
Median house or condo value ($) - Other Race
Median price asked for mobile homes ($)
Household density (households per square mile)
Mean house or condo value by units in structure - 1, detached ($)
Mean house or condo value by units in structure - 1, attached ($)
Mean house or condo value by units in structure - 2 ($)
Mean house or condo value by units in structure by units in structure - 3 or 4 ($)
Mean house or condo value by units in structure - 5 or more ($)
Mean house or condo value by units in structure - Boat, RV, van, etc. ($)
Mean house or condo value by units in structure - Mobile home ($)
Median contract rent ($)
Median contract rent - Lower quartile ($)
Median contract rent - Upper quartile ($)
Median gross rent ($)
Urban houses (%)
Rural houses (%)
Houses occupied (%)
Houses occupied (% change since 2000)
Houses owner occupied (%)
Houses owner occupied (% change since 2000)
Houses renter occupied (%)
Houses renter occupied (% change since 2000)
Vacant housing units - For rent (%)
Vacant housing units - For rent (% change since 2000)
Vacant housing units - For sale only (%)
Vacant housing units - For sale only (% change since 2000)
Vacant housing units - Rented or sold, not occupied (%)
Vacant housing units - Rented or sold, not occupied (% change since 2000)
Vacant housing units - For seasonal, recreational, or occasional use (%)
Vacant housing units - For seasonal, recreational, or occasional use (% change since 2000)
Vacant housing units - For migrant workers (%)
Vacant housing units - For migrant workers (% change since 2000)
Vacant housing units - Other vacant (%)
Vacant housing units - Other vacant (% change since 2000)
Median monthly housing costs ($)
Median household income for houses/condos with a mortgage ($)
Median household income for houses/condos without a mortgage ($)
Median household income ($)
Median household income ($) - White
Median household income ($) - Black or African American
Median household income ($) - Asian
Median household income ($) - Hispanic or Latino
Median household income ($) - American Indian and Alaska Native
Median household income ($) - Multirace
Median household income ($) - Other Race
Mortgage status - with mortgage (%)
Mortgage status - with second mortgage (%)
Mortgage status - with home equity loan (%)
Mortgage status - with both second mortgage and home equity loan (%)
Mortgage status - without a mortgage (%)
Median year house/condo built
Median year apartment built
Household type by relationship - Male householder living alone (%)
Household type by relationship - Male householder not living alone (%)
Household type by relationship - Female householder living alone (%)
Household type by relationship - Female householder not living alone (%)
Household type by relationship - Opposite-Sex spouse (%)
Household type by relationship - Same-Sex spouse (%)
Household type by relationship - Opposite-Sex unmarried partner (%)
Household type by relationship - Same-Sex unmarried partner (%)
Household type by relationship - In group quarters (%)
Size of family households - 2-person household (%)
Size of family households - 3-person household (%)
Size of family households - 4-person household (%)
Size of family households - 5-person household (%)
Size of family households - 6-person household (%)
Size of family households - 7-or-more-person household (%)
Size of nonfamily households - 1-person household (%)
Size of nonfamily households - 2-person household (%)
Size of nonfamily households - 3-person household (%)
Size of nonfamily households - 4-person household (%)
Size of nonfamily households - 5-person household (%)
Size of nonfamily households - 6-person household (%)
Size of nonfamily households - 7-or-moreperson household (%)
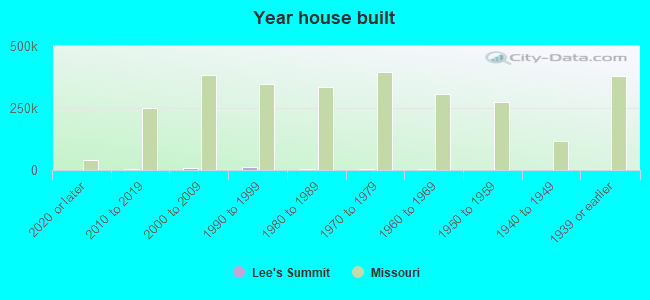
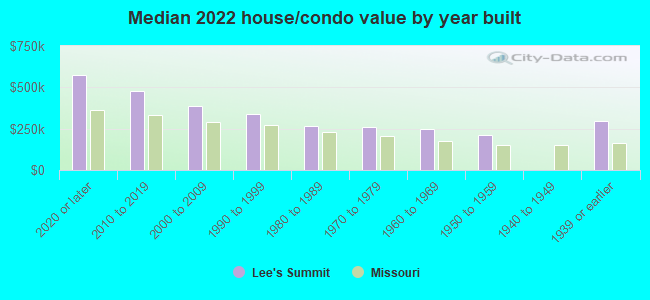
Year house built - Built 2010 or later (%)
Year house built - Built 2000 to 2009 (%)
Year house built - Built 1990 to 1999 (%)
Year house built - Built 1980 to 1989 (%)
Year house built - Built 1970 to 1979 (%)
Year house built - Built 1960 to 1969 (%)
Year house built - Built 1950 to 1959 (%)
Year house built - Built 1940 to 1949 (%)
Year house built - Built 1939 or earlier (%)
Median number of rooms in houses and condos
Median number of rooms in apartments
Median number of bedrooms in owner occupied houses
Mean number of bedrooms in owner occupied houses
Median number of bedrooms in renter occupied houses
Mean number of bedrooms in renter occupied houses
Median number of vehichles in owner occupied houses
Mean number of vehichles in owner occupied houses
Median number of vehichles in renter occupied houses
Mean number of vehichles in renter occupied houses
Rooms in owner-occupied houses - 1 room (%)
Rooms in owner-occupied houses - 2 rooms (%)
Rooms in owner-occupied houses - 3 rooms (%)
Rooms in owner-occupied houses - 4 rooms (%)
Rooms in owner-occupied houses - 5 rooms (%)
Rooms in owner-occupied houses - 6 rooms (%)
Rooms in owner-occupied houses - 7 rooms (%)
Rooms in owner-occupied houses - 8 rooms (%)
Rooms in owner-occupied houses - 9+ rooms (%)
Rooms in renter-occupied houses - 1 room (%)
Rooms in renter-occupied houses - 2 rooms (%)
Rooms in renter-occupied houses - 3 rooms (%)
Rooms in renter-occupied houses - 4 rooms (%)
Rooms in renter-occupied houses - 5 rooms (%)
Rooms in renter-occupied houses - 6 rooms (%)
Rooms in renter-occupied houses - 7 rooms (%)
Rooms in renter-occupied houses - 8 rooms (%)
Rooms in renter-occupied houses - 9+ rooms (%)
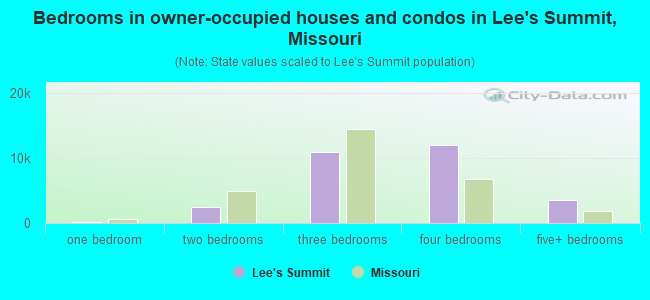
Bedrooms in owner-occupied houses - no bedrooms (%)
Bedrooms in owner-occupied houses - 1 bedroom (%)
Bedrooms in owner-occupied houses - 2 bedrooms (%)
Bedrooms in owner-occupied houses - 3 bedrooms (%)
Bedrooms in owner-occupied houses - 4 bedrooms (%)
Bedrooms in owner-occupied houses - 5+ bedrooms (%)
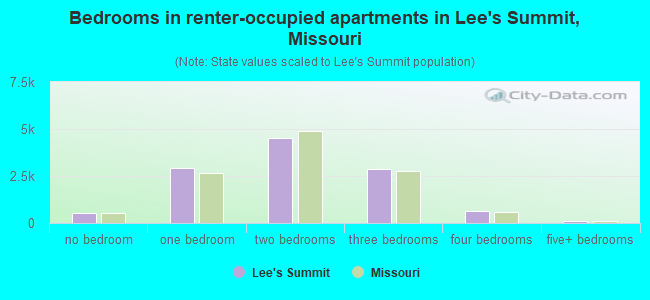
Bedrooms in renter-occupied houses - no bedrooms (%)
Bedrooms in renter-occupied houses - 1 bedroom (%)
Bedrooms in renter-occupied houses - 2 bedrooms (%)
Bedrooms in renter-occupied houses - 3 bedrooms (%)
Bedrooms in renter-occupied houses - 4 bedrooms (%)
Bedrooms in renter-occupied houses - 5+ bedrooms (%)
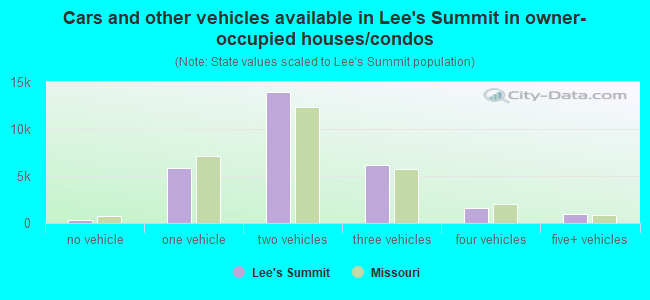
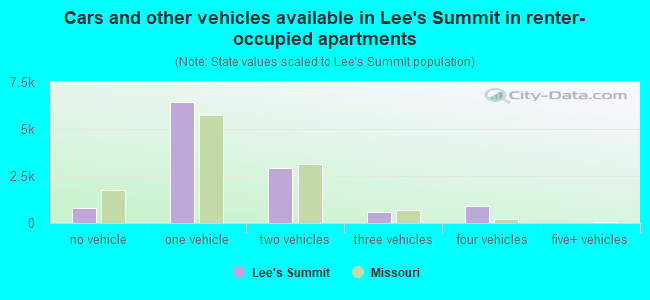
Vehicles available in owner-occupied houses - no vehicle available (%)
Vehicles available in owner-occupied houses - 1 vehicle available(%)
Vehicles available in owner-occupied houses - 2 Vehicles available (%)
Vehicles available in owner-occupied houses - 3 Vehicles available (%)
Vehicles available in owner-occupied houses - 4 Vehicles available (%)
Vehicles available in owner-occupied houses - 5+ Vehicles available (%)
Vehicles available in renter-occupied houses - no vehicle available (%)
Vehicles available in renter-occupied houses - 1 vehicle available (%)
Vehicles available in renter-occupied houses - 2 Vehicles available (%)
Vehicles available in renter-occupied houses - 3 Vehicles available (%)
Vehicles available in renter-occupied houses - 4 Vehicles available (%)
Vehicles available in renter-occupied houses - 5+ Vehicles available (%)
Housing units in structures - 1, detached (%)
Housing units in structures - 1, attached (%)
Housing units in structures - 2 (%)
Housing units in structures - 3 or 4 (%)
Housing units in structures - 5 to 9 (%)
Housing units in structures - 10 to 19 (%)
Housing units in structures - 20 to 49 (%)
Housing units in structures - 50 or more (%)
Housing units in structures - Mobile home (%)
Housing units in structures - Boat, RV, van, etc. (%)
Housing units in structures - Owners - 1, detached (%)
Housing units in structures - Owners - 1, attached (%)
Housing units in structures - Owners - 2 (%)
Housing units in structures - Owners - 3 or 4 (%)
Housing units in structures - Owners - 5 to 9 (%)
Housing units in structures - Owners - 10 to 19 (%)
Housing units in structures - Owners - 20 to 49 (%)
Housing units in structures - Owners - 50 or more (%)
Housing units in structures - Owners - Mobile home (%)
Housing units in structures - Owners - Boat, RV, van, etc. (%)
Housing units in structures - Renters - 1, detached (%)
Housing units in structures - Renters - 1, attached (%)
Housing units in structures - Renters - 2 (%)
Housing units in structures - Renters - 3 or 4 (%)
Housing units in structures - Renters - 5 to 9 (%)
Housing units in structures - Renters - 10 to 19 (%)
Housing units in structures - Renters - 20 to 49 (%)
Housing units in structures - Renters - 50 or more (%)
Housing units in structures - Renters - Mobile home (%)
Housing units in structures - Renters - Boat, RV, van, etc. (%)
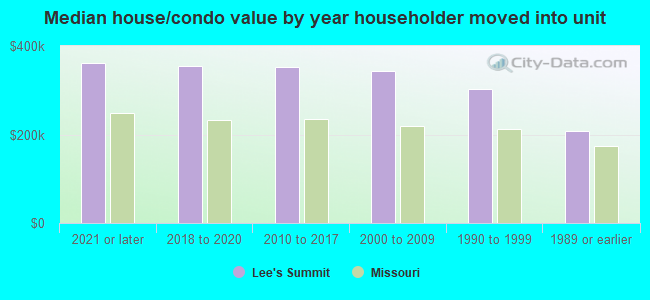
House/condo owner moved in on average (years ago)
Renter moved in on average (years ago)
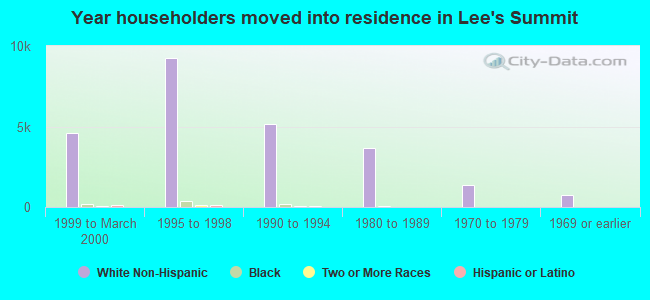
Year householder moved into unit - Moved in 1999 to March 2000 (%)
Year householder moved into unit - Moved in 1999 to March 2000 (%) - White
Year householder moved into unit - Moved in 1999 to March 2000 (%) - Black or African American
Year householder moved into unit - Moved in 1999 to March 2000 (%) - Asian
Year householder moved into unit - Moved in 1999 to March 2000 (%) - Hispanic or Latino
Year householder moved into unit - Moved in 1999 to March 2000 (%) - American Indian and Alaska Native
Year householder moved into unit - Moved in 1999 to March 2000 (%) - Multirace
Year householder moved into unit - Moved in 1999 to March 2000 (%) - Other Race
Year householder moved into unit - Moved in 1995 to 1998 (%)
Year householder moved into unit - Moved in 1995 to 1998 (%) - White
Year householder moved into unit - Moved in 1995 to 1998 (%) - Black or African American
Year householder moved into unit - Moved in 1995 to 1998 (%) - Asian
Year householder moved into unit - Moved in 1995 to 1998 (%) - Hispanic or Latino
Year householder moved into unit - Moved in 1995 to 1998 (%) - American Indian and Alaska Native
Year householder moved into unit - Moved in 1995 to 1998 (%) - Multirace
Year householder moved into unit - Moved in 1995 to 1998 (%) - Other Race
Year householder moved into unit - Moved in 1990 to 1994 (%)
Year householder moved into unit - Moved in 1990 to 1994 (%) - White
Year householder moved into unit - Moved in 1990 to 1994 (%) - Black or African American
Year householder moved into unit - Moved in 1990 to 1994 (%) - Asian
Year householder moved into unit - Moved in 1990 to 1994 (%) - Hispanic or Latino
Year householder moved into unit - Moved in 1990 to 1994 (%) - American Indian and Alaska Native
Year householder moved into unit - Moved in 1990 to 1994 (%) - Multirace
Year householder moved into unit - Moved in 1990 to 1994 (%) - Other Race
Year householder moved into unit - Moved in 1980 to 1989 (%)
Year householder moved into unit - Moved in 1980 to 1989 (%) - White
Year householder moved into unit - Moved in 1980 to 1989 (%) - Black or African American
Year householder moved into unit - Moved in 1980 to 1989 (%) - Asian
Year householder moved into unit - Moved in 1980 to 1989 (%) - Hispanic or Latino
Year householder moved into unit - Moved in 1980 to 1989 (%) - American Indian and Alaska Native
Year householder moved into unit - Moved in 1980 to 1989 (%) - Multirace
Year householder moved into unit - Moved in 1980 to 1989 (%) - Other Race
Year householder moved into unit - Moved in 1970 to 1979 (%)
Year householder moved into unit - Moved in 1970 to 1979 (%) - White
Year householder moved into unit - Moved in 1970 to 1979 (%) - Black or African American
Year householder moved into unit - Moved in 1970 to 1979 (%) - Asian
Year householder moved into unit - Moved in 1970 to 1979 (%) - Hispanic or Latino
Year householder moved into unit - Moved in 1970 to 1979 (%) - American Indian and Alaska Native
Year householder moved into unit - Moved in 1970 to 1979 (%) - Multirace
Year householder moved into unit - Moved in 1970 to 1979 (%) - Other Race
Year householder moved into unit - Moved in 1969 or earlier (%)
Year householder moved into unit - Moved in 1969 or earlier (%) - White
Year householder moved into unit - Moved in 1969 or earlier (%) - Black or African American
Year householder moved into unit - Moved in 1969 or earlier (%) - Asian
Year householder moved into unit - Moved in 1969 or earlier (%) - Hispanic or Latino
Year householder moved into unit - Moved in 1969 or earlier (%) - American Indian and Alaska Native
Year householder moved into unit - Moved in 1969 or earlier (%) - Multirace
Year householder moved into unit - Moved in 1969 or earlier (%) - Other Race
Housing units lacking complete plumbing facilities (%)
Housing units lacking complete kitchen facilities (%)
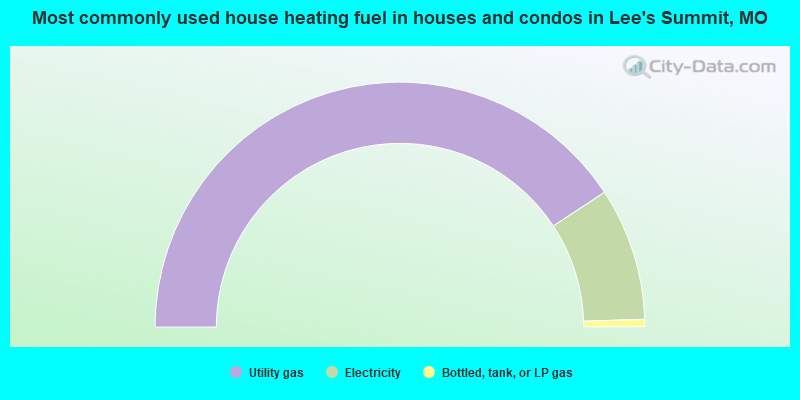
House heating fuel used in houses and condos - Utility gas (%)
House heating fuel used in houses and condos - Bottled, tank, or LP gas (%)
House heating fuel used in houses and condos - Electricity (%)
House heating fuel used in houses and condos - Fuel oil, kerosene, etc. (%)
House heating fuel used in houses and condos - Coal or coke (%)
House heating fuel used in houses and condos - Wood (%)
House heating fuel used in houses and condos - Solar energy (%)
House heating fuel used in houses and condos - Other fuel (%)
House heating fuel used in houses and condos - No fuel used (%)
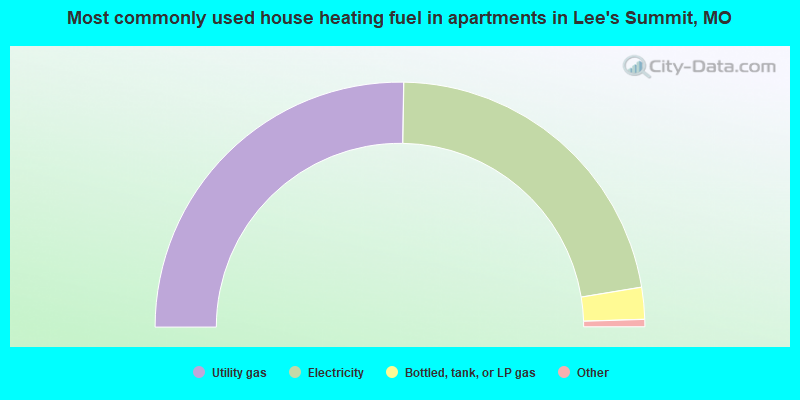
House heating fuel used in apartments - Utility gas (%)
House heating fuel used in apartments - Bottled, tank, or LP gas (%)
House heating fuel used in apartments - Electricity (%)
House heating fuel used in apartments - Fuel oil, kerosene, etc. (%)
House heating fuel used in apartments - Coal or coke (%)
House heating fuel used in apartments - Wood (%)
House heating fuel used in apartments - Solar energy (%)
House heating fuel used in apartments - Other fuel (%)
House heating fuel used in apartments - No fuel used (%)
Median year house/condo built: 1996Median year apartment built: 1990Household type by relationship:
Households: 104,336
Male householders: 20,359 (4,602 living alone ), Female householders: 20,168 (5,494 living alone )21,530 spouses (21,414 opposite-sex spouses ), 2,681 unmarried partners , (2,393 opposite-sex unmarried partners ), 30,892 children (28,945 natural , 742 adopted , 1,205 stepchildren ), 2,823 grandchildren , 405 brothers or sisters , 786 parents , 0 foster children , 1,669 other relatives , 2,453 non-relatives In group quarters: 570
Size of family households: 12,289 2-persons , 5,589 3-persons , 5,011 4-persons , 2,250 5-persons , 1,312 6-persons , 778 7-or-more-persons .
Size of nonfamily households: 10,096 1-person , 3,174 2-persons , 28 4-persons .
18,332 married couples with children. single-parent households (1,357 men , 4,287 women ).
93.7% of residents of Lee's Summit speak English at home. of residents speak Spanish at home (75% speak English very well , 14% speak English well , 10% speak English not well , 1% don't speak English at all ).of residents speak other Indo-European language at home (86% speak English very well , 7% speak English well , 6% speak English not well ).of residents speak Asian or Pacific Island language at home (71% speak English very well , 22% speak English well , 7% speak English not well , 1% don't speak English at all ).of residents speak other language at home (94% speak English very well , 6% speak English well ).
Foreign born population: 4,603 (4.4%)of them are naturalized citizens )
Median number of rooms in houses and condos:
Median number of rooms in apartments
Owner-occupied Renter-occupied
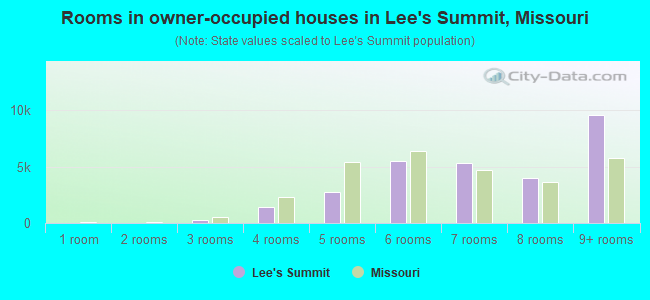
Rooms in owner-occupied houses in Lee's Summit, Missouri
0 1 room 0 2 rooms 237 3 rooms 1,456 4 rooms 2,772 5 rooms 5,510 6 rooms 5,351 7 rooms 4,022 8 rooms 9,577 9+ rooms
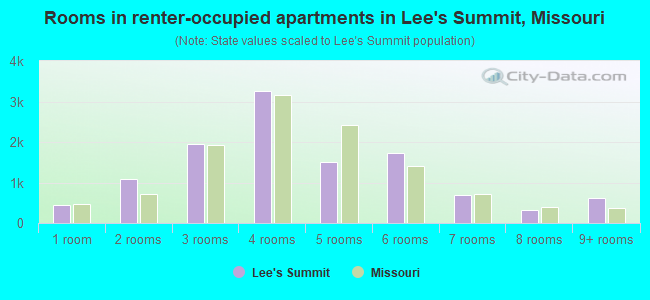
Rooms in renter-occupied apartments in Lee's Summit, Missouri
455 1 room 1,096 2 rooms 1,940 3 rooms 3,254 4 rooms 1,500 5 rooms 1,717 6 rooms 700 7 rooms 311 8 rooms 629 9+ rooms
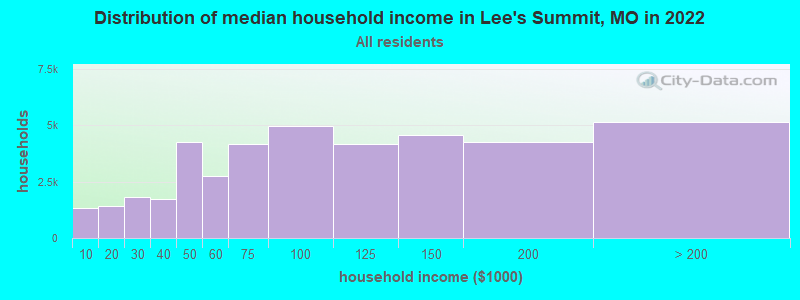
Lee's Summit, MO household income distribution 1,315 Less than $10,0001,417 $10,000 to $19,9991,813 $20,000 to $29,9991,742 $30,000 to $39,9994,257 $40,000 to $49,9992,747 $50,000 to $59,9994,146 $60,000 to $74,9994,981 $75,000 to $99,9994,170 $100,000 to $124,9994,548 $125,000 to $149,9994,253 $150,000 to $199,9995,138 $200,000 or more
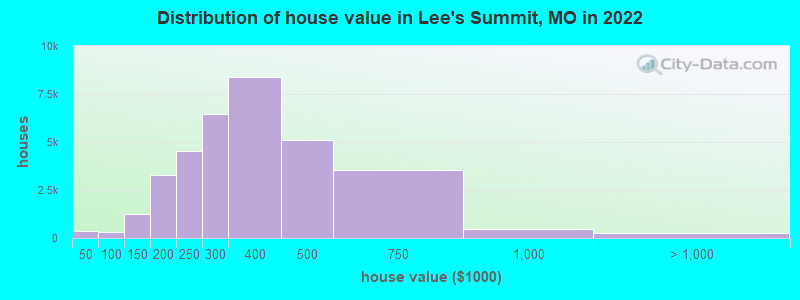
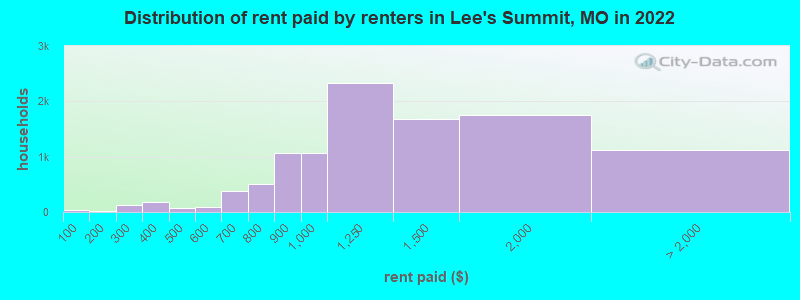
Home value of owner - occupied houses in 2022 in Lee's Summit, MO 110 Less than $10,00066 $10,000 to $14,99921 $15,000 to $19,99926 $20,000 to $24,99919 $25,000 to $29,99930 $30,000 to $34,99932 $35,000 to $39,99932 $40,000 to $49,99960 $50,000 to $59,99938 $60,000 to $69,99932 $70,000 to $79,99932 $80,000 to $89,999113 $90,000 to $99,999301 $100,000 to $124,999951 $125,000 to $149,9991,776 $150,000 to $174,9991,500 $175,000 to $199,9994,544 $200,000 to $249,9996,469 $250,000 to $299,9998,364 $300,000 to $399,9995,095 $400,000 to $499,9993,540 $500,000 to $749,999488 $750,000 to $999,999149 $1,000,000 to $1,499,9997 $1,500,000 to $1,999,99987 $2,000,000 or moreRent paid by renters in 2022 in Lee's Summit, MO 33 Less than $10019 $150 to $19919 $200 to $249113 $250 to $299100 $300 to $34974 $350 to $39925 $400 to $44941 $450 to $49917 $500 to $54977 $550 to $599140 $600 to $649242 $650 to $699284 $700 to $749218 $750 to $7991,065 $800 to $8991,059 $900 to $9992,323 $1,000 to $1,2491,686 $1,250 to $1,4991,751 $1,500 to $1,999413 $2,000 to $2,49978 $2,500 to $2,99997 $3,000 to $3,499169 $3,500 or more354 No cash rent
Percentage of workers working in this county: 78.9%Number of people working at home: 12,034 (22.8% of all workers )
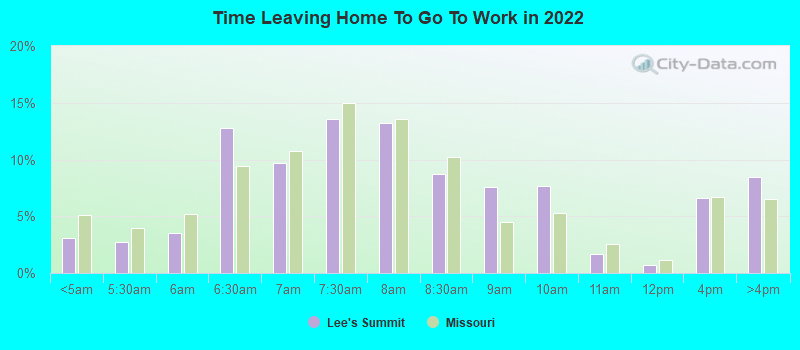
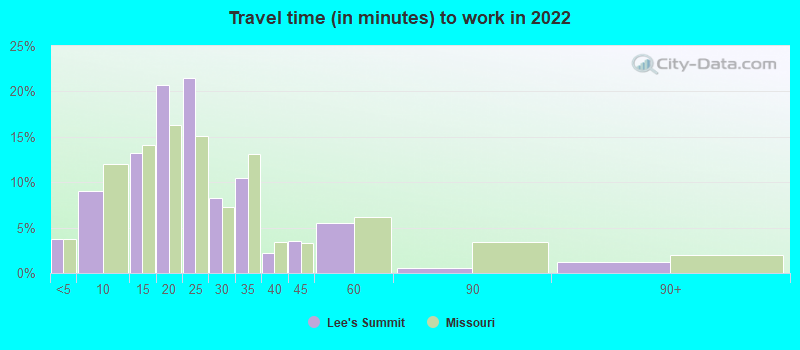
Travel time to work (commute)
Less than 5 minutes: 9745 to 9 minutes: 4,67610 to 14 minutes: 5,13715 to 19 minutes: 5,72820 to 24 minutes: 6,03825 to 29 minutes: 4,36530 to 34 minutes: 6,84135 to 39 minutes: 1,56040 to 44 minutes: 2,87045 to 59 minutes: 2,35860 to 89 minutes: 81690 or more minutes: 158
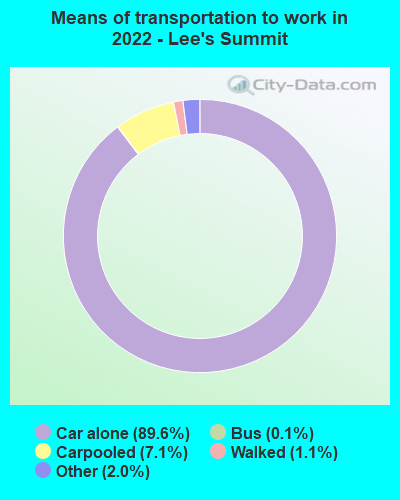
Means of transportation to work:
Drove a car alone: 34,292 (70.8%)Carpooled: 2,700 (5.6%)Bus : 35 (0.1%)Taxi: 790 (1.6%)Bicycle: 20 (0.0%)Walked: 335 (0.7%)Worked at home: 12,034 (24.8%)
Unemployment by race in 2022
Unemployment rate for White non-Hispanic residents 0.9% Males0.5% FemalesUnemployment rate for Black residents 5.2% Males6.2% FemalesUnemployment rate for Asian residents 7.4% Males0.6% FemalesUnemployment rate for other race residents 18.8% Males13.6% FemalesUnemployment rate for two or more race residents 10.3% Males0.7% FemalesUnemployment rate for Hispanic or Latino residents 7.3% Males4.9% Females
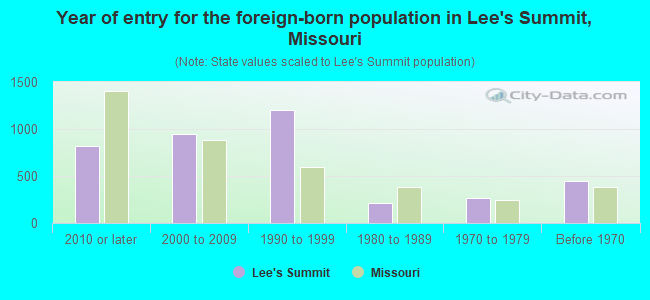
Year of entry for the foreign-born population in Lee's Summit, Missouri
823 2010 or later 947 2000 to 2009 1,198 1990 to 1999 210 1980 to 1989 270 1970 to 1979 444 Before 1970
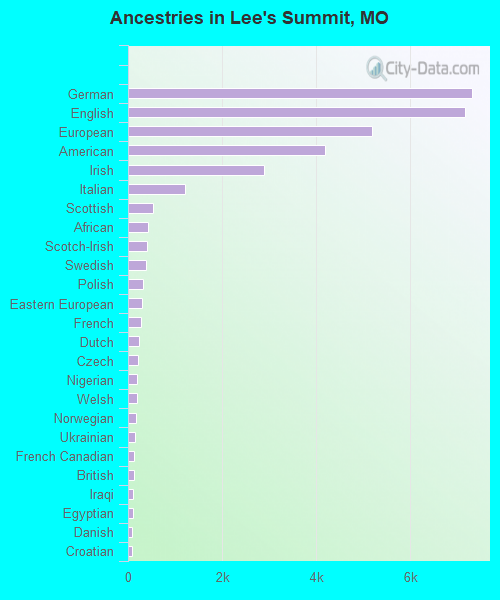
First ancestries reported:
German: 7,308 (15.5%)
English: 7,162 (15.2%)
European: 5,182 (11.0%)
American: 4,180 (8.9%)
Irish: 2,900 (6.2%)
Italian: 1,209 (2.6%)
Scottish: 521 (1.1%)
African: 425 (0.9%)
Scotch-Irish: 401 (0.9%)
Swedish: 391 (0.8%)
Polish: 326 (0.7%)
Eastern European: 306 (0.6%)
French: 266 (0.6%)
Dutch: 233 (0.5%)
Czech: 216 (0.5%)
Nigerian: 195 (0.4%)
Welsh: 184 (0.4%)
Norwegian: 162 (0.3%)
Ukrainian: 154 (0.3%)
French Canadian: 131 (0.3%)
British: 123 (0.3%)
Iraqi: 116 (0.2%)
Egyptian: 110 (0.2%)
Danish: 90 (0.2%)
Croatian: 80 (0.2%)
Northern European: 53 (0.1%)
Jordanian: 52 (0.1%)
Scandinavian: 52 (0.1%)
Greek: 51 (0.1%)
Lebanese: 43 (0.09%)
Lithuanian: 35 (0.07%)
Brazilian: 34 (0.07%)
Russian: 30 (0.06%)
Kenyan: 24 (0.05%)
Bulgarian: 20 (0.04%)
Hungarian: 18 (0.04%)
Slavic: 16 (0.03%)
Slovak: 15 (0.03%)
Turkish: 14 (0.03%)
Icelander: 13 (0.03%)
Swiss: 13 (0.03%)
Austrian: 13 (0.03%)
Pennsylvania German: 12 (0.03%)
Slovene: 11 (0.02%)
Ethiopian: 10 (0.02%)
Jamaican: 10 (0.02%)
Canadian: 9 (0.02%)
Latvian: 8 (0.02%)
Finnish: 8 (0.02%)
Serbian: 6 (0.01%)
Yugoslavian: 5 (0.01%)
Most common places of birth for foreign-born residents (%): Mexico Lee's Summit:
11.0% (468)Missouri:
14.9% (38,568)
India Lee's Summit:
10.3% (439)Missouri:
8.9% (22,932)
Philippines Lee's Summit:
6.2% (266)Missouri:
4.2% (10,873)
Vietnam Lee's Summit:
5.1% (218)Missouri:
4.1% (10,700)
Pakistan Lee's Summit:
4.7% (202)Missouri:
1.2% (3,209)
Korea Lee's Summit:
4.7% (201)Missouri:
2.9% (7,525)
Kenya Lee's Summit:
4.1% (174)Missouri:
1.7% (4,518)
Canada Lee's Summit:
3.7% (159)Missouri:
1.9% (4,806)
Nigeria Lee's Summit:
3.5% (151)Missouri:
1.4% (3,640)
Bosnia and Herzegovina Lee's Summit:
3.4% (145)Missouri:
3.2% (8,168)
China, excluding Hong Kong and Taiwan Lee's Summit:
3.2% (138)Missouri:
6.6% (17,002)
El Salvador Lee's Summit:
3.0% (130)Missouri:
1.5% (3,926)
Germany Lee's Summit:
2.5% (107)Missouri:
3.0% (7,803)
Colombia Lee's Summit:
2.0% (85)Missouri:
1.2% (2,988)
Ukraine Lee's Summit:
1.8% (76)Missouri:
1.1% (2,895)
Malaysia Lee's Summit:
1.7% (74)Missouri:
0.2% (582)
Burma (Myanmar) Lee's Summit:
1.7% (71)Missouri:
0.5% (1,247)
Kuwait Lee's Summit:
1.5% (66)Missouri:
0.2% (406)
Place of birth for U.S.-born residents:
This state: 60,393Other state: 38,149Northeast: 2,491Midwest: 22,800South: 6,240West: 6,618 86.9% of Lee's Summit residents lived in the same house 1 years ago.
Out of people who lived in different houses, 37.2% lived in this county.
Out of people who lived in different counties, 42.8% lived in Missouri.
Lee's Summit:
86.9%State average:
87.1%
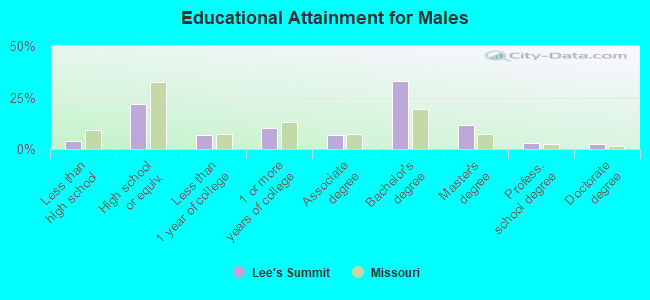
Education attainment for males 25 years and older:
No schooling: 372Nursery to 4th grade: 05th and 6th grade: 07th and 8th grade: 429th grade: 2810th grade: 46511th grade: 012th grade, no diploma: 470High school graduate (or equivalency): 7,606Less than 1 year of college: 2,399Some college more than 1 year, no degree: 3,571Associate degree: 2,336Bachelor's degree: 11,385Master's degree: 3,969Professional school degree: 1,047Doctorate degree: 876
Education attainment for females 25 years and older:
No schooling: 212Nursery to 4th grade: 985th and 6th grade: 907th and 8th grade: 09th grade: 4510th grade: 8611th grade: 24412th grade, no diploma: 256High school graduate (or equivalency): 7,847Less than 1 year of college: 3,312Some college more than 1 year, no degree: 3,770Associate degree: 2,760Bachelor's degree: 9,833Master's degree: 5,571Professional school degree: 667Doctorate degree: 802
Housing units in structures:
One, detached: 30,034One, attached: 4,028Two: 7753 or 4: 1,1345 to 9: 1,00710 to 19: 1,94120 to 49: 1,61850 or more: 1,634Housing units lacking complete plumbing facilities in 2022: 0.6%Housing units lacking complete kitchen facilities in 2022: 0.3%House/condo owner moved in on average 9 years ago
Renter moved in on average 2 years ago
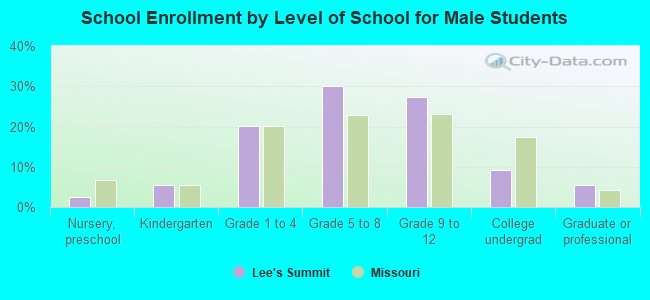
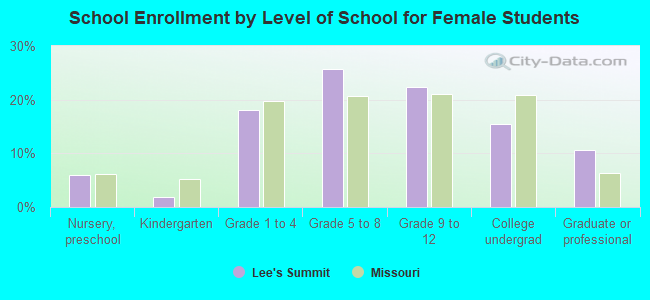
Private vs. public school enrollment:
Students in private schools in grades 1 to 8 (elementary and middle school): 1,191 Students in private schools in grades 9 to 12 (high school): 692 Students in private undergraduate colleges: 446